- EUR/USD, GBP/USD and JPY/USD are the big three in Cross Currency Basis swaps.
- The maturity profiles of the three markets are very different to each other.
- We can confidently state that JPY/USD is a short-end market, EUR/USD a medium term one and GBP/USD long-end.
- ICAP are dominant in the SEF market, with BGC increasing market share in the past 12 months.
Cross Currency Swaps in 2017
The past twelve months have seen relatively stable volumes in Cross Currency Swaps;
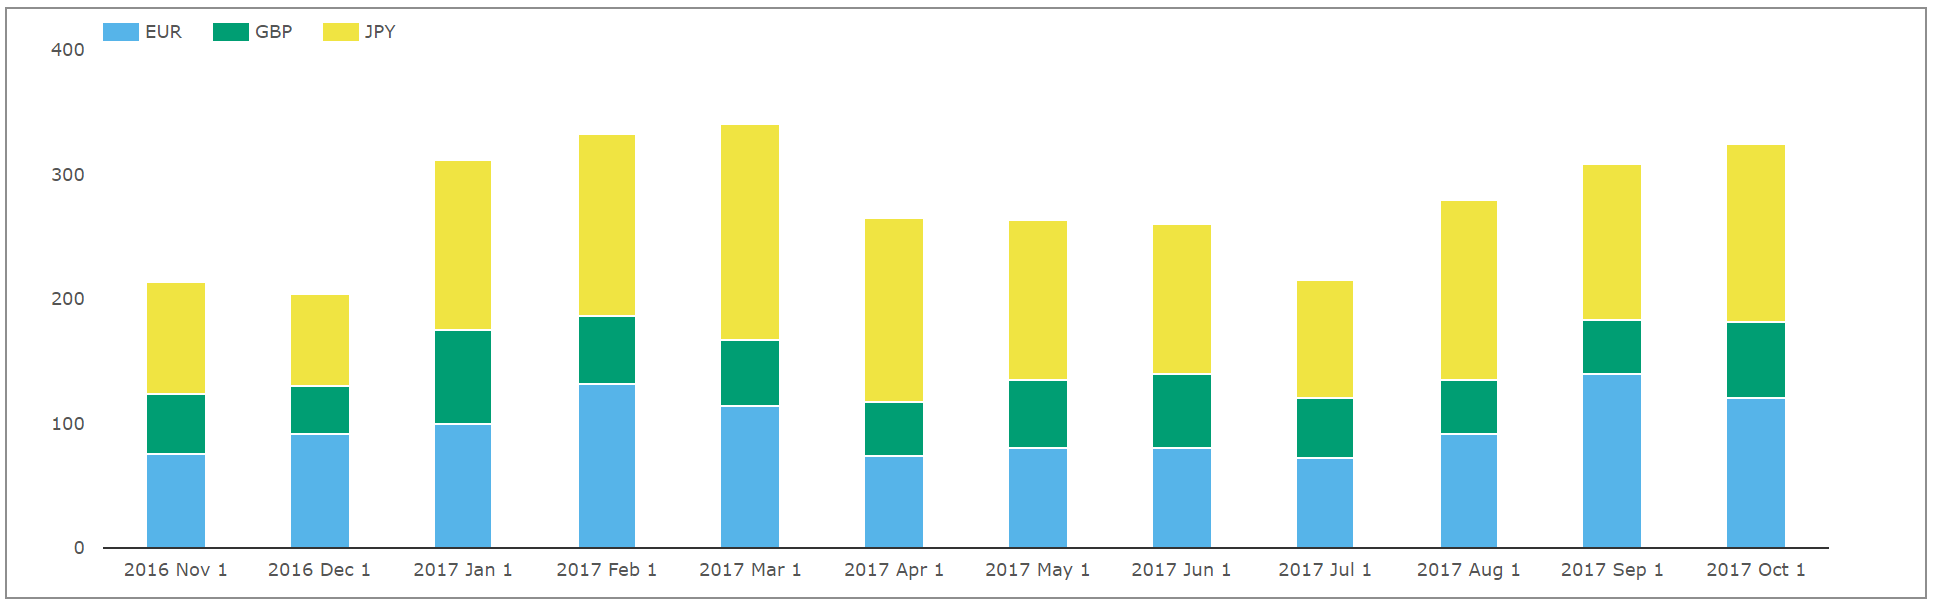
Showing;
- EUR/USD, GBP/USD and JPY/USD monthly volumes over the past year.
- Volumes can reach over $300bn in any given month.
- On a notional basis, JPY/USD is typically the largest market each month.
- 46% of volumes over the past year have been JPY/USD.
- 35% have been EUR/USD, with the balance (<20%) GBP/USD.
Cross Currency DV01s
This result was somewhat of a surprise to me. To my mind, EUR/USD has always been the largest market. So I took a look at the tenor profile from SDRView for these 3 markets over the past year:
Showing;
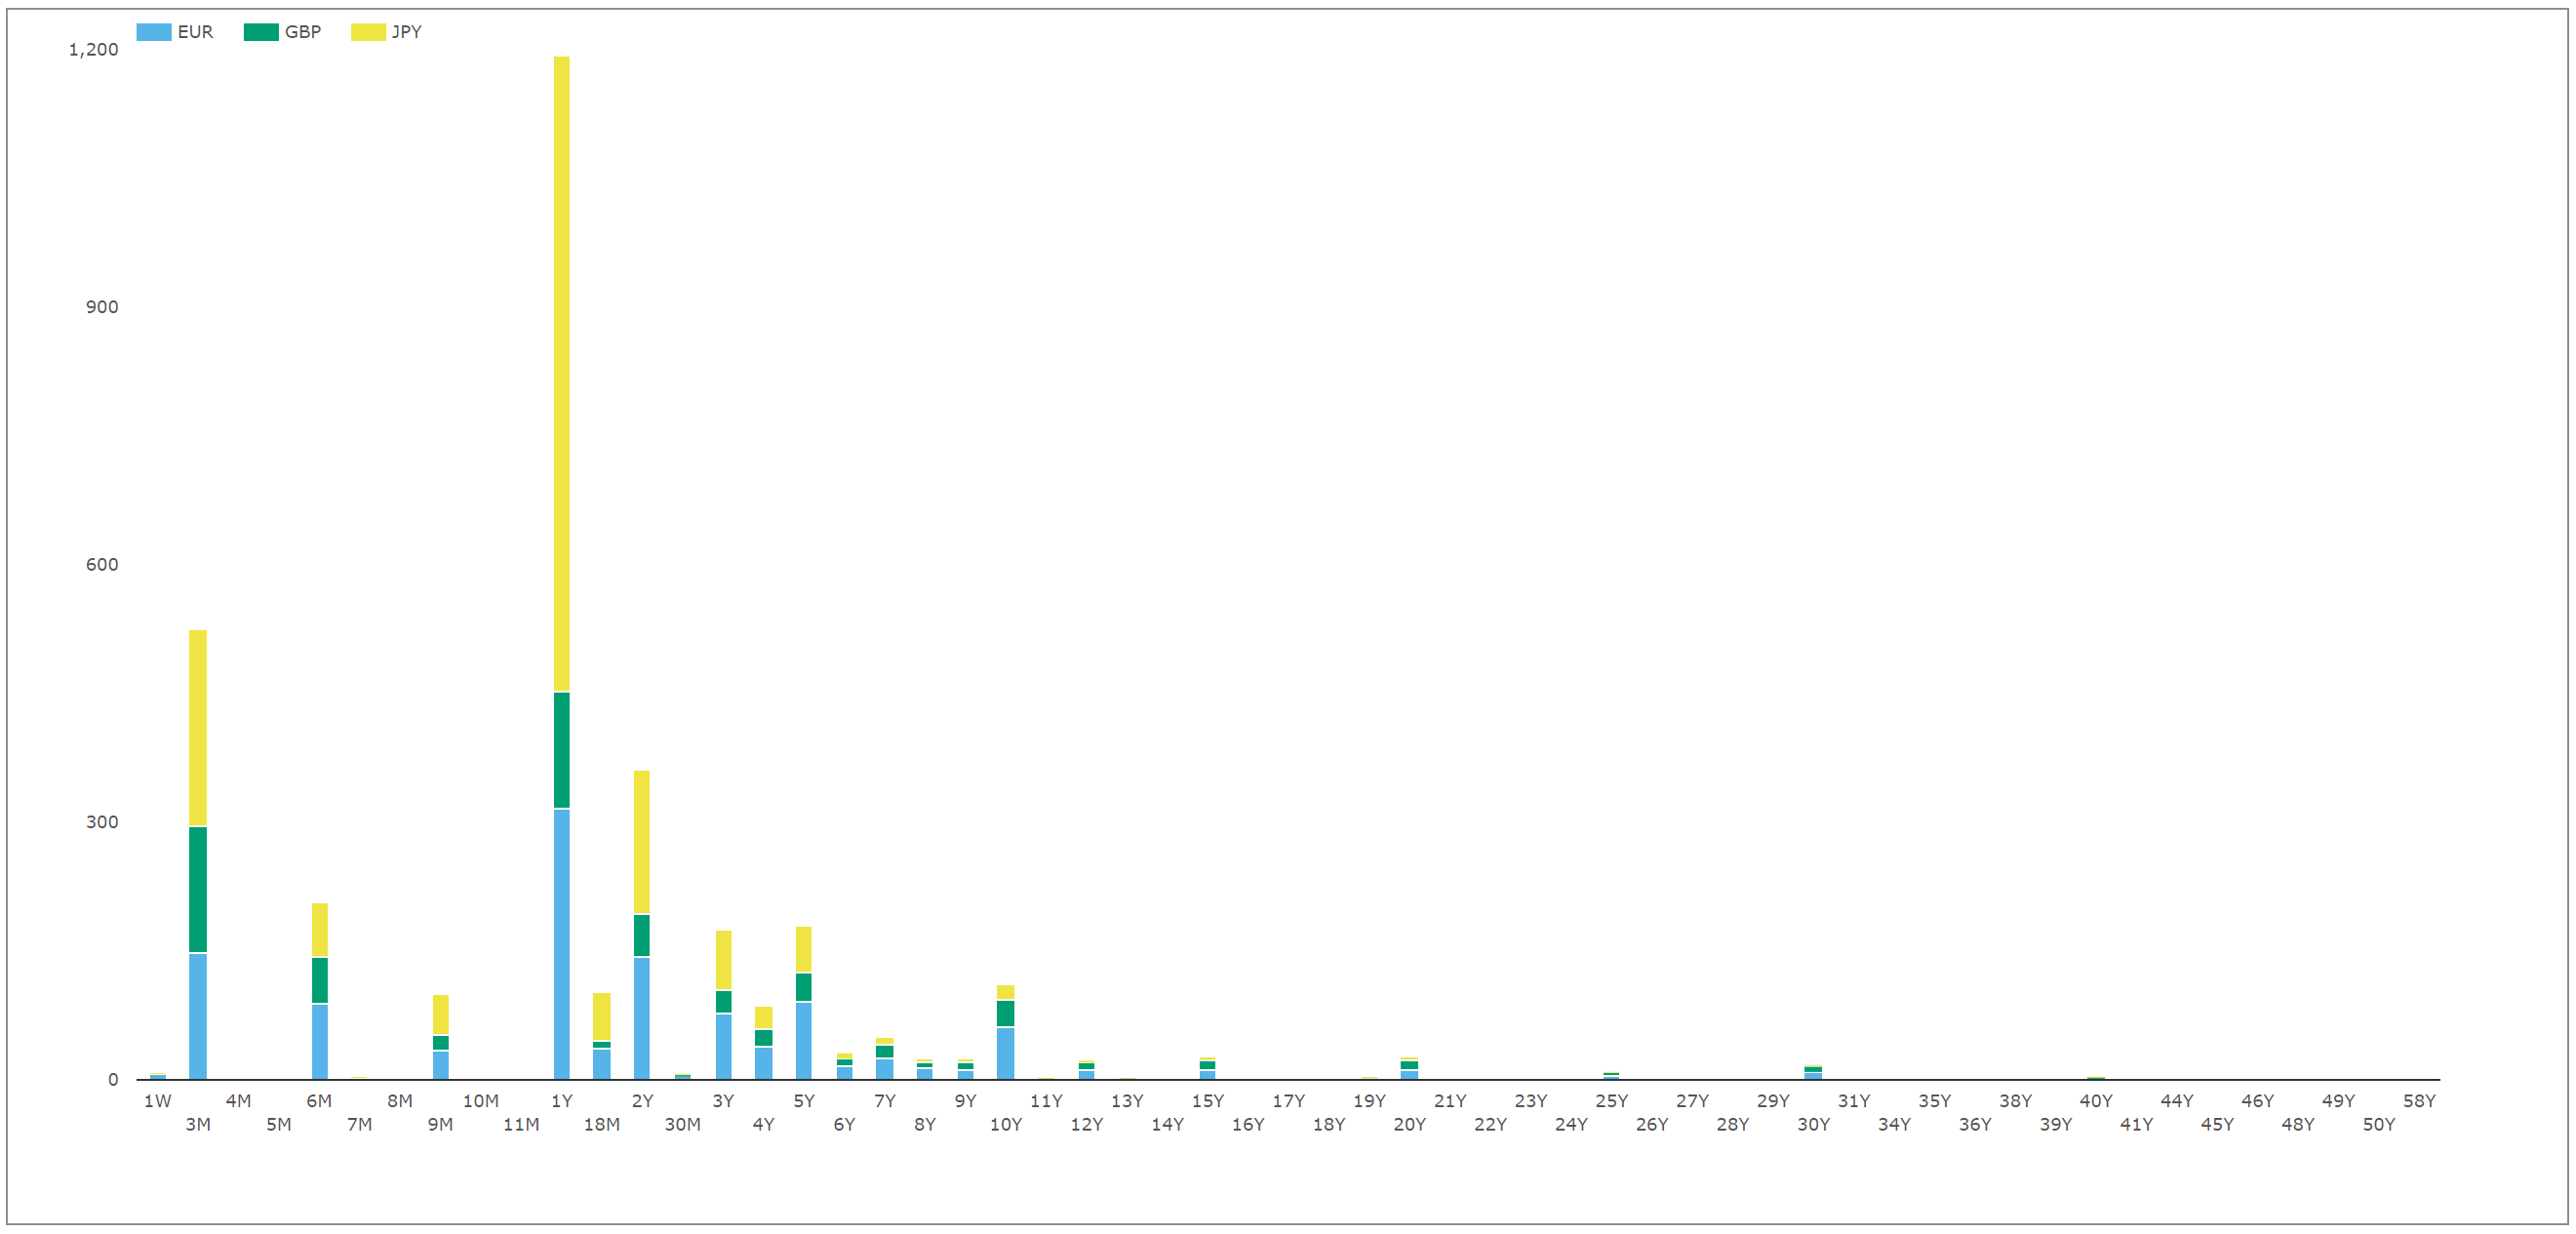
- Cross Currency notionals traded in the past 12 months, split by Tenor and Currency.
- Because this is notional based, there are peaks in shorter maturities.
- Whilst all 3 currency pairs show these short-end peaks, JPY/USD shows particularly large volumes in the 1 year tenor.
This chart piqued my interest further – what do volumes look like on a DV01 basis?
Microservices as an analytics tool
Translating the notionals to DV01 is a trivial matching exercise, assuming you have par swap DV01s at hand. Fortunately, that is exactly what our Clarus Microservices provide:
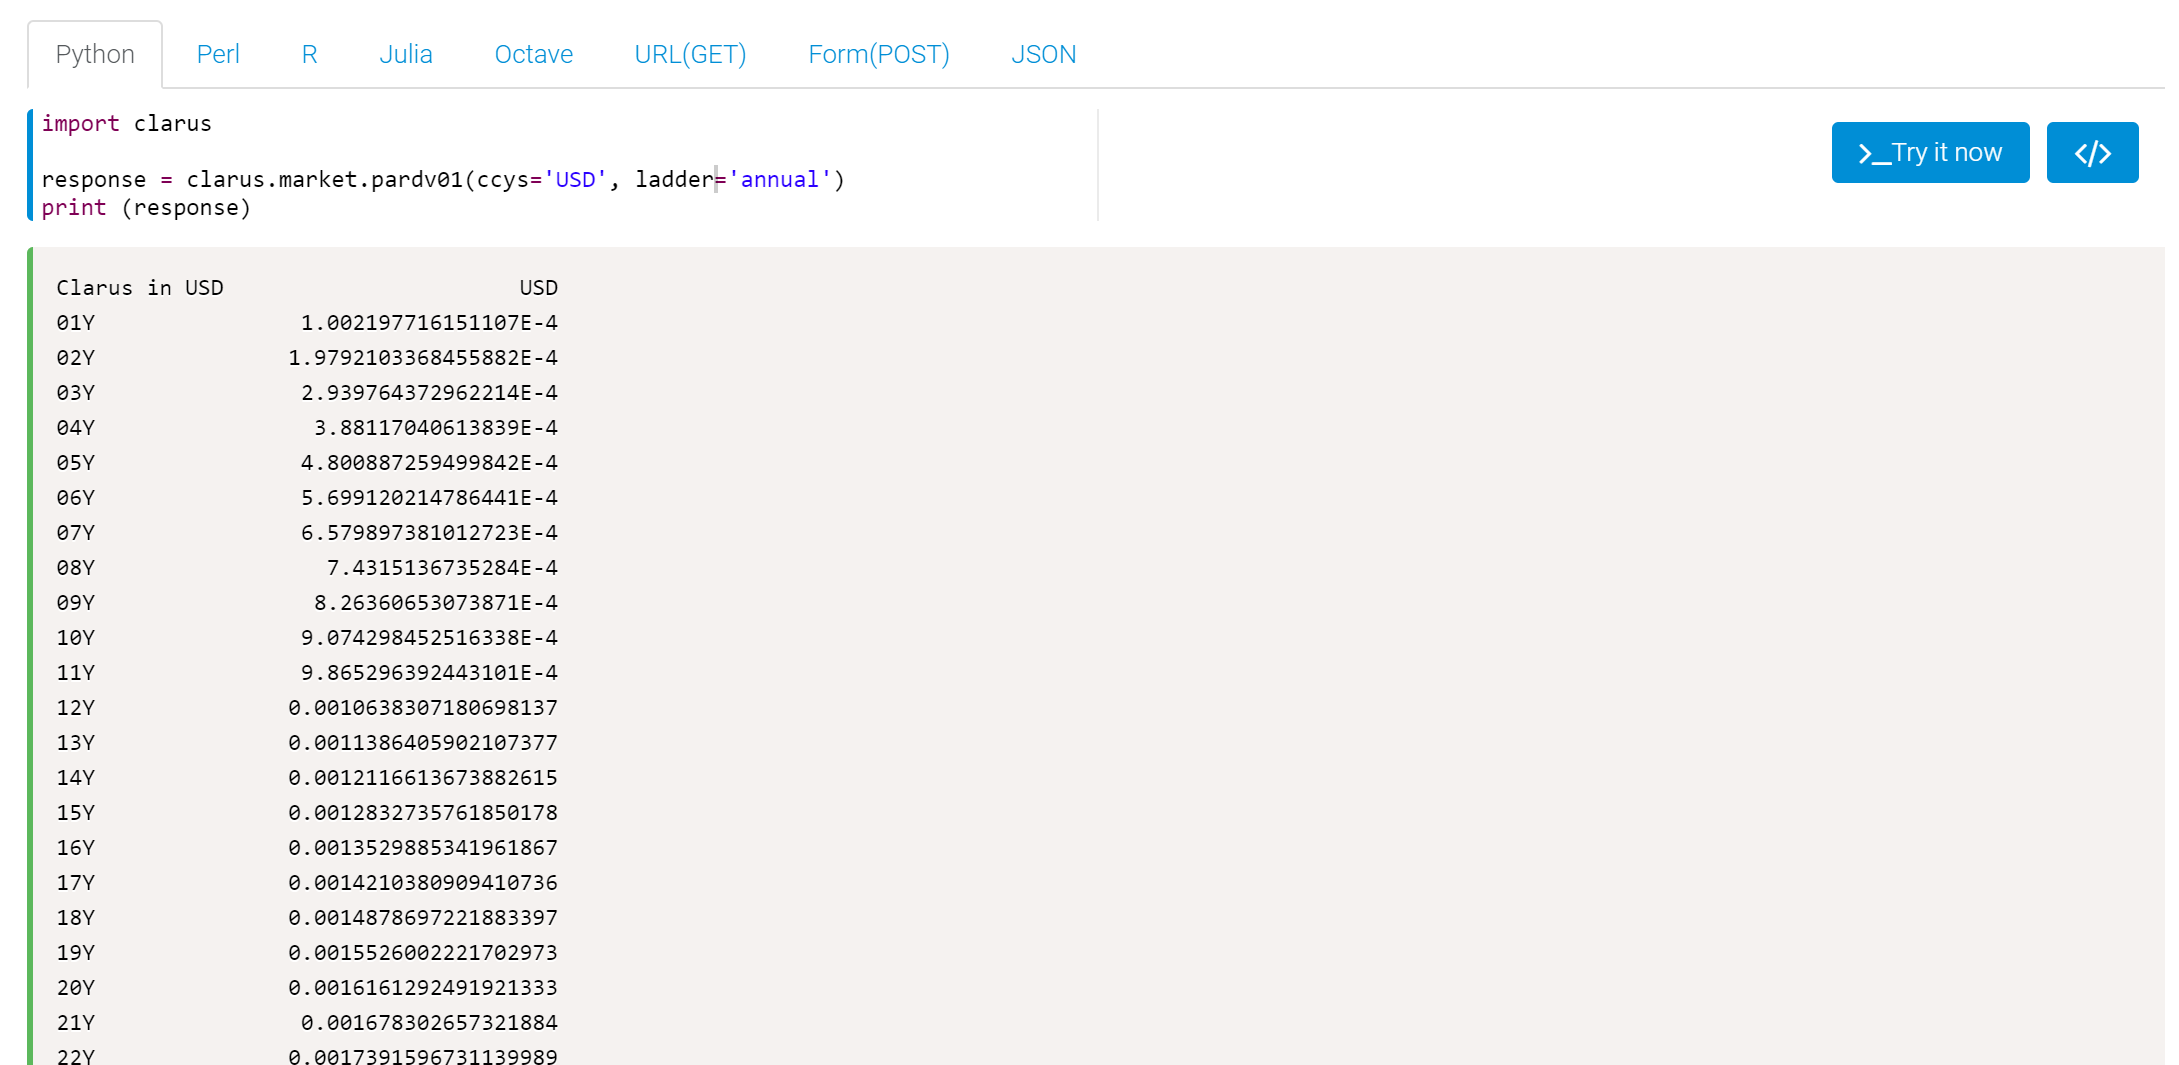
For a one-off analysis such as this, I find it even less work to simply copy and paste these results into Excel from our sandbox than to use our Clarus excel add-in directly – but both methods are possible.
This allows me to quickly translate my notional amounts of cross currency swaps into DV01s.
Onto the Charts!
Now for a chart blitz. On a DV01 basis, EUR/USD is indeed the largest market (thankfully I am not THAT out of touch with my previous trading career!).
- EUR/USD accounted for 46% of volumes.
- JPY/USD 30%.
- GBP/USD much higher at 26%.
Now on to the tenors traded:

Showing;
- Same data as previous chart, this time stated in DV01 terms.
- There are a few benchmark tenors standing out.
- EUR/USD has large peaks in the amount of risk traded in the 1y, 5y and 10y buckets. 10y is the largest amount of risk.
- JPY/USD, on the other hand, sees 1y and 2y as the largest buckets. 3y, 5y and 10y also see large volumes.
- GBP/USD risk is dispersed. 10y is the single largest bucket.
Let’s take a look at this data in more detail.
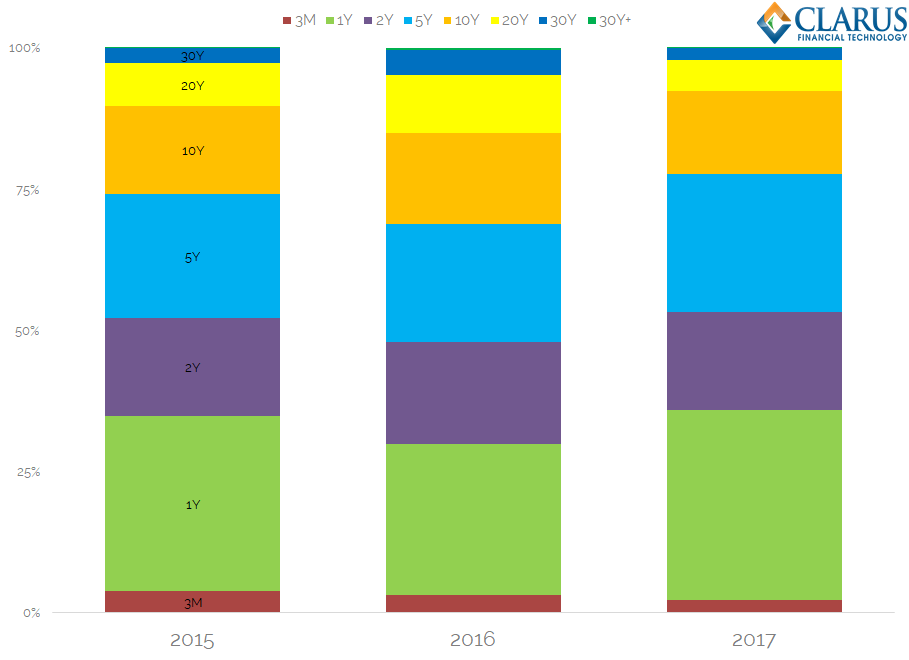
EUR/USD Tenor by DV01
We can easily pull out three years worth of history from SDRView, so I thought I would take a look a the tenor profile in EUR/USD cross currency swaps for the past three years. Has much changed?
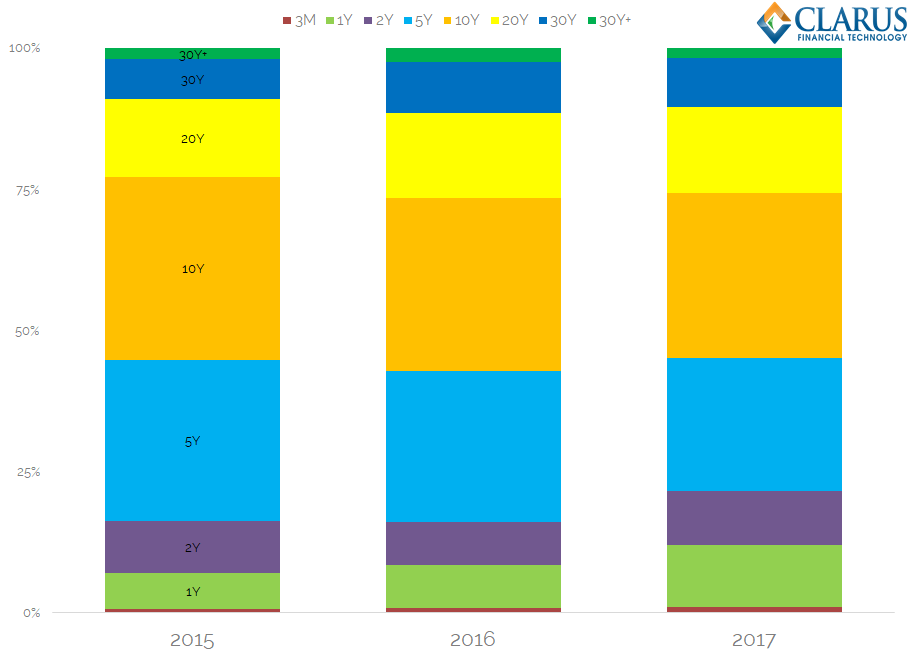
Showing;
- The percentage of risk traded each year by tenor bucket.
- Consistently, around 30% of risk is traded in the “10y” bucket. (To keep things simple, this includes all risk from 6y to 10y).
- The share of risk traded in 5 years has gradually declined from 28% to 23% (tenors included are 3y, 4y and 5y).
- A very small amount of the risk is traded at the “short-end” of the curve. 2017 has seen the most active trading in short-dated maturities, with nearly 12% of risk traded in maturities of 1y or less.
- The final 25% of risk is traded in maturities longer than 10 years.
Overall, it is noticeable that the tenor profile does not vastly change over time. We may see changes of up to 5% in the allocation, but generally speaking, most risk is traded between 5y and 10y.
How does this compare to the other markets?
JPY/USD Tenor by DV01
The second largest market is considerably (and consistently) different:
Showing;
- 36% of risk traded in USD/JPY this year has been in 1 year or shorter tenors. That is up from 30% last year.
- Over half of all risk traded is 2 year or shorter.
- There is very little risk traded out past 10 years – less than 10% this year.
- 5y and 10y still see decent activity but nowhere near the same as EUR/USD.
Again, the pattern of tenors traded have been remarkably stable over time. The difference between the EUR/USD market appears to be structural rather than a transient market theme.
GBP/USD Tenor by DV01
GBP/USD is more like EUR/USD…and yet different again!
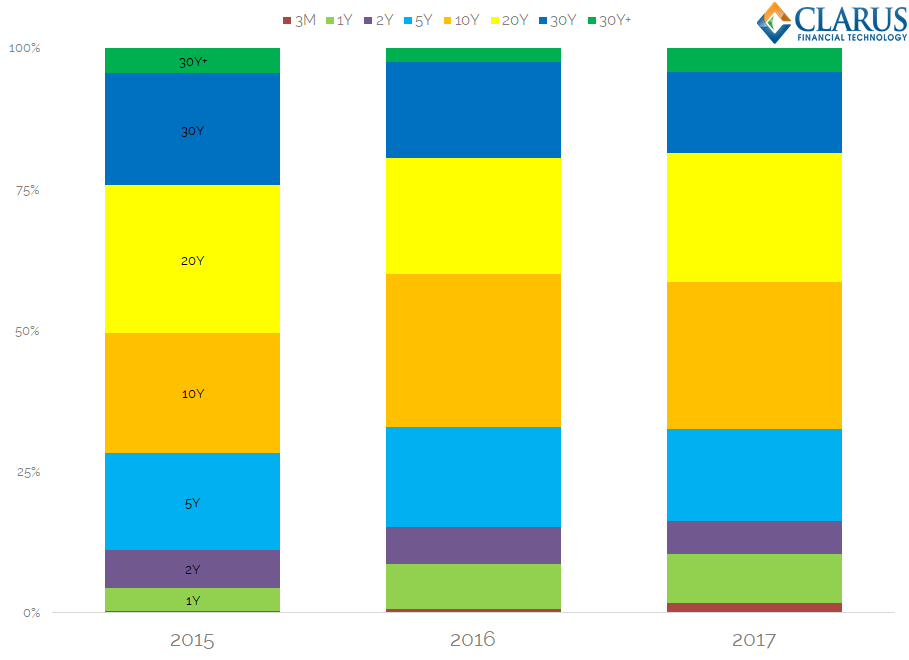
Showing;
- The long-end is the most active of any cross currency pair.
- Over 50% of risk traded during 2015 was longer than 10 years in GBP/USD!
- Having said that, 5 years is normally the single most traded bucket, accounting for around 21-25% of volumes.
- 1y activity in particular has seen increased volumes in 2017 compared to 2015.
Whilst it is tempting to discuss the cross currency swap market as a whole (particularly in terms of volumes) it is key to acknowledge the differences between the markets themselves. Our data shows that these differences persist over time.
SEF Market Share
It pays dividends to consider the currency and tenor mix when looking at SEF market share in cross currency swaps. Generally, we see over half of notional traded on-SEF. Just bear in mind that this is just for US Persons, so we expect that to change when we see Mifid II data next year.
From SEFView;
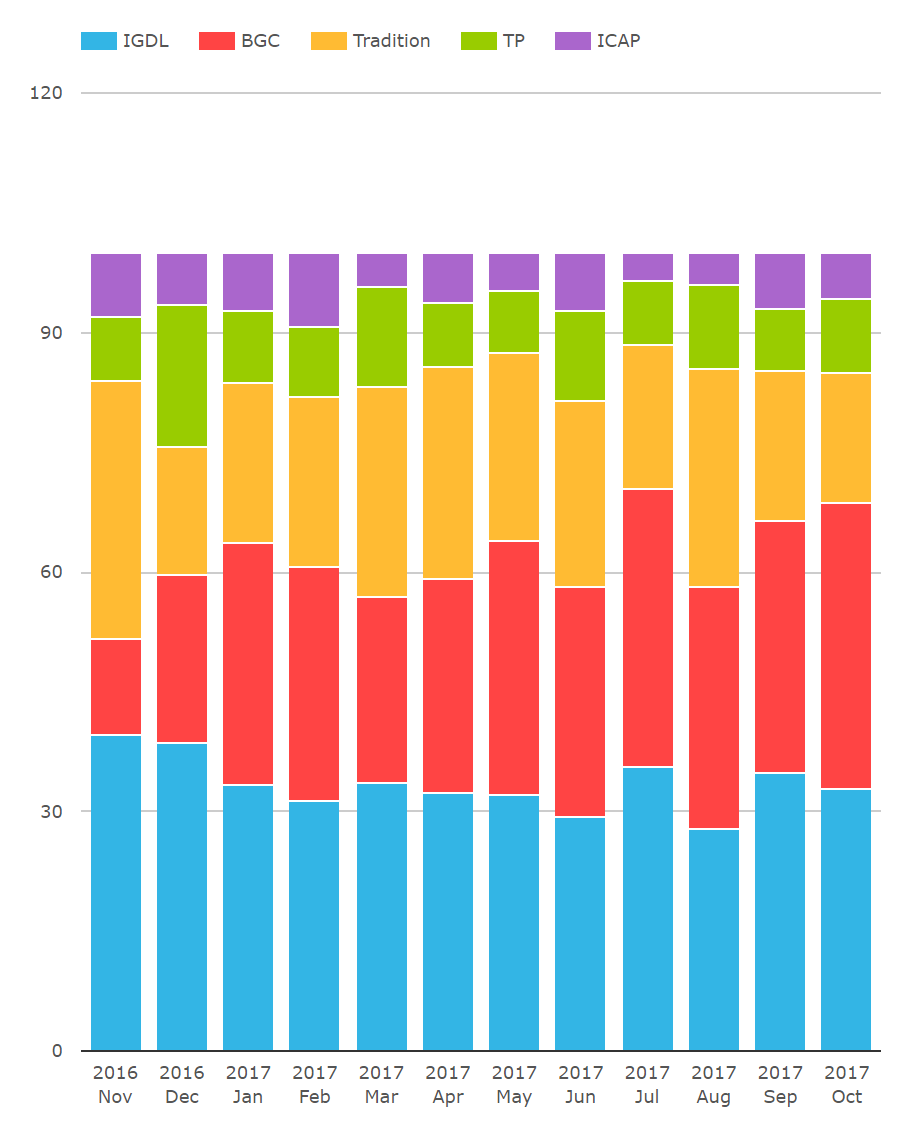 On a notional basis, the SEFView chart suggests that ICAP – whilst still dominant – have seen a fall in volumes. And that BGC have been on a huge run, from 12% market share to 36%. Wow.
However, we need to repaint this chart in DV01 terms for the true picture of market share:
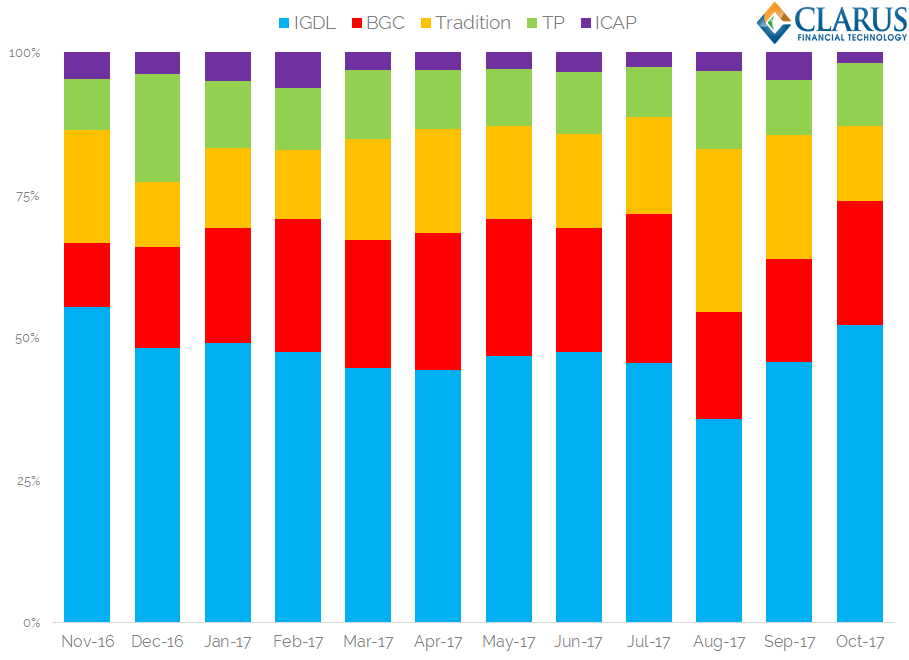
Showing;
- ICAP (IGDL plus ICAP on the above chart) have a pretty solid 52-55% market share. There was a blip in August 2017, but it has been otherwise consistent over the past 12 months.
- BGC have improved their market share. Last December they saw 18% of volumes, and this has increased to as much as 26%.
- Tulletts have had a couple of peaks, but are consistently around 11% of volumes.
- The Tradition market share is very volatile – ranging from 11% to 29% in our observation period!
As we have noted above, it probably makes more sense to look at these market share statistics on a currency-by-currency basis (i.e. who is number one in EUR/USD?). We will leave it to our SEFView users to conduct their own analysis.
In Summary
- EUR/USD is the largest cross currency swap market.
- JPY/USD is second.
- GBP/USD is a long-term market, EUR/USD a medium term market and JPY/USD a short-term market in terms of amount of risk traded.
- ICAP and BGC account for nearly 70% of all risk traded across SEF in cross currency markets.