- We look at the FX data within the BIS triennial survey
- And show the evolution of NDF clearing since the UMRs came into force in September
- 10% of the market is currently being cleared, up from just 2% in April
A background to NDF Data
This blog will tie together a couple of themes from my recent blogs covering BIS Data in Interest Rate Swaps and NDF Clearing since the Uncleared Margin Rules (UMRs) came into force back in September.
The data from the BIS is from April 2016, so it is currently a timely measure (or at least as timely as it ever will be!) regarding market activity. So let’s use it to measure how the NDF market has changed in recent months.
Before we do, it is w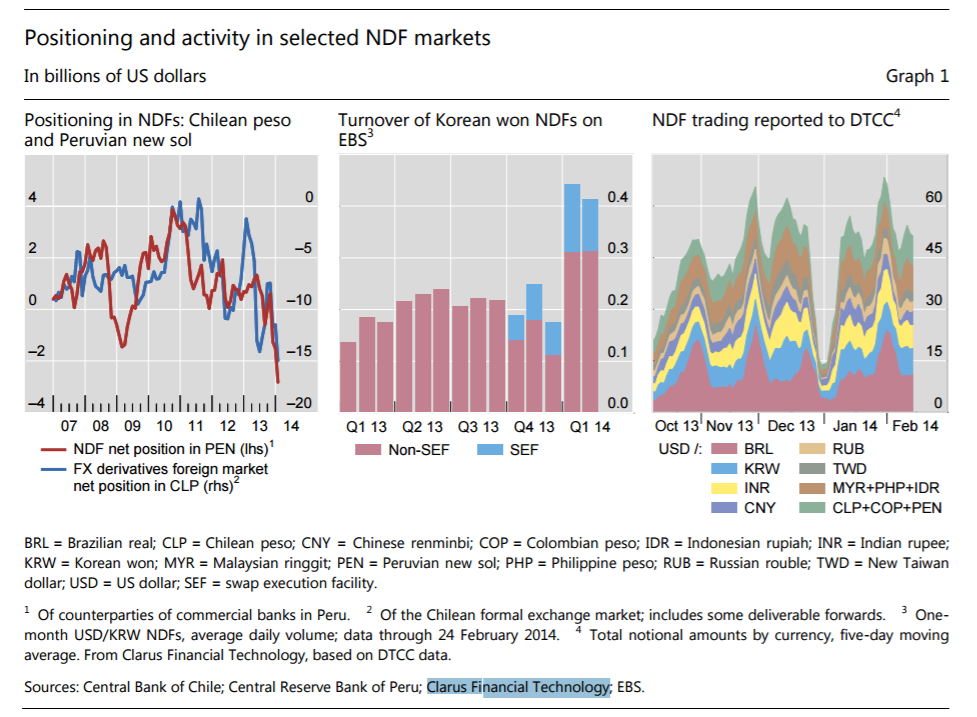
The authors were also early on the band-wagon of a little known (at the time…) data provider called Clarus….
Is there a cross-over between the data sources?
This week, we won’t be able to cover all of the bases from this BIS report, but we will present a framework for bringing the April 2016 BIS volume figures up-to-date.
This is possible because, as the BIS note, SDRView data covers between 30-50% of the overall NDF market, therefore gives us a good idea about total market activity and trends.
This week, we are interested to know how much of the NDF market is currently being Cleared. So let’s get started by getting into the weeds of the data.
The BIS survey data covers all currencies, but is only broken down into 6 NDF currency pairs, therefore it is wise to add “Other Currencies” when handling the data. We do this by implying an amount vs “Other” currency pairs using the “Total vs USD” amount. This gives us seven data points to compare against our Cleared products in CCPView.
First, let’s look at the data from CCPView:
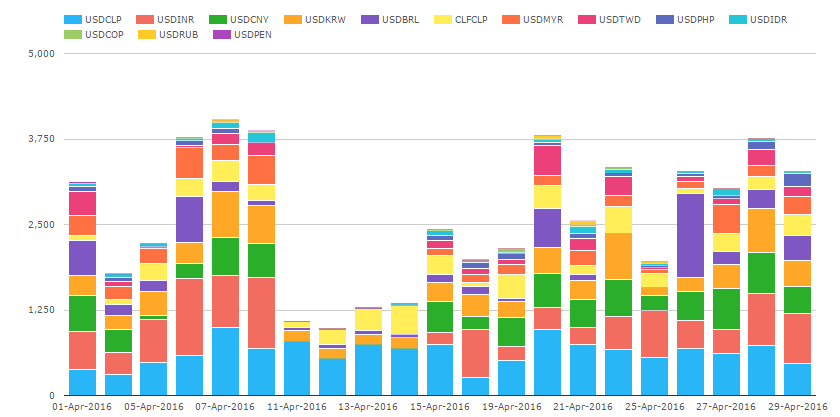
Showing;
- Cleared NDF Volumes during April 2016, broken down daily and per currency pair.
- There were 5 trading days during the month where daily volumes were above $3.75bn.
- The week of April 11th saw very low volumes with hardly anything reported in Asian currency pairs.
- Overall, we saw an Average Daily Volume of $2.6bn in Cleared NDFs during April 2016.
- Compare this with the BIS reported Average Daily Volume of $130.2bn.
What happens when we combine the two data sets?
Our CCPView data therefore shows that daily volumes can vary by quite a lot, and importantly that April 2016 had a seemingly very quiet week. Nevertheless, to compare with the BIS data, we take the $2.6bn Average Daily Volume from CCPView and split it by currency pair. This allows us to infer the size of Uncleared market activity from the BIS data set here:
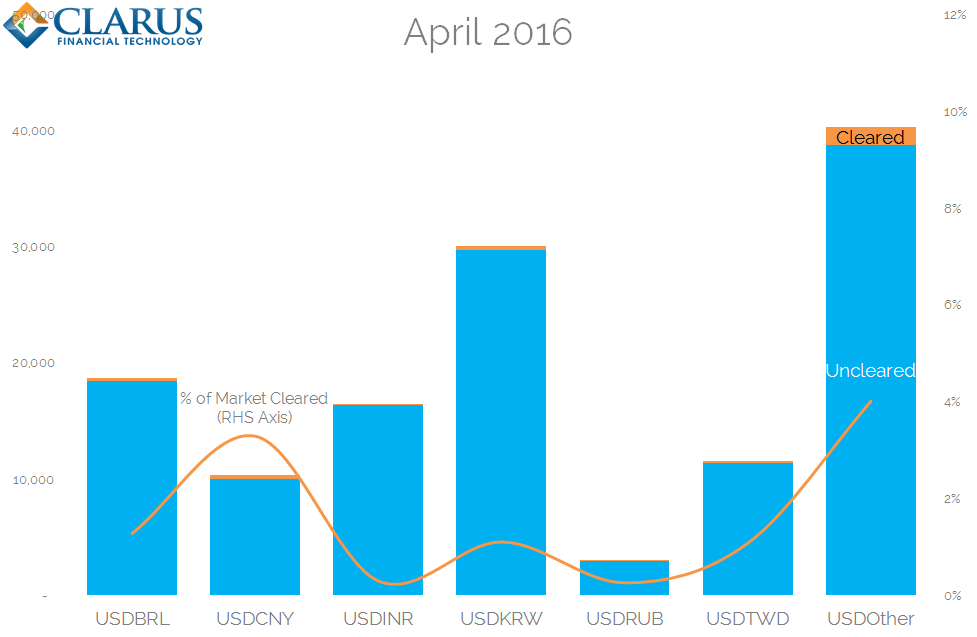
Showing;
- The Average Daily Volume of NDFs split by Currency Pair and Cleared/Uncleared during April 2016.
- The largest currency pair that is broken out by volume by the BIS was USDKRW, with an ADV of $19.6bn.
- In Clearing, the largest currency pair by volume was USDCLP, with an ADV of $626m.
- We therefore see the highest proportion of clearing in the “Other” currencies as defined by the BIS.
- Overall, Clearing accounted for just 2.1% of the market.
- Individual currency pairs saw anything from 0.3% to 3.9% of volumes being Cleared.
Can we improve the analysis by introducing further sources of data?
We have so far only looked at April 2016 data. What happens when we fast forward to the implementation of the UMRs? We now want to estimate the percentage of the market being cleared at this moment in time.
Ideally, we would compare CCPView September data with a September 2016 BIS data set. But of course we only have BIS data from April 2016. We could always assume that the overall market size is static over time. If we do so, we see that in September 2016, 6.9% of the market was cleared. On a currency-by-currency basis, USDTWD saw 9.2% of volumes cleared.
Unfortunately, we know from last week’s blog that volumes are not static – they tend to be seasonal. We saw earlier in this blog that volumes during April were also very variable week-by-week. Can we come up with a more accurate way of estimating the current penetration of clearing into the market?
I think we can. By using data from SDRView, we gain a trade-by-trade source of NDF data, giving us an insight into 30-50% of the overall market.
SDRView includes trades reported by US Persons to trade repositories and is available close-to-real-time. The downside is that we only see a portion of the market, but we can take this as a guide to overall market activity.
So let’s see what precise proportion of the NDF market was covered by SDRView in April 2016 and use this as a scaling factor to estimate overall NDF market activity during subsequent months:

Showing;
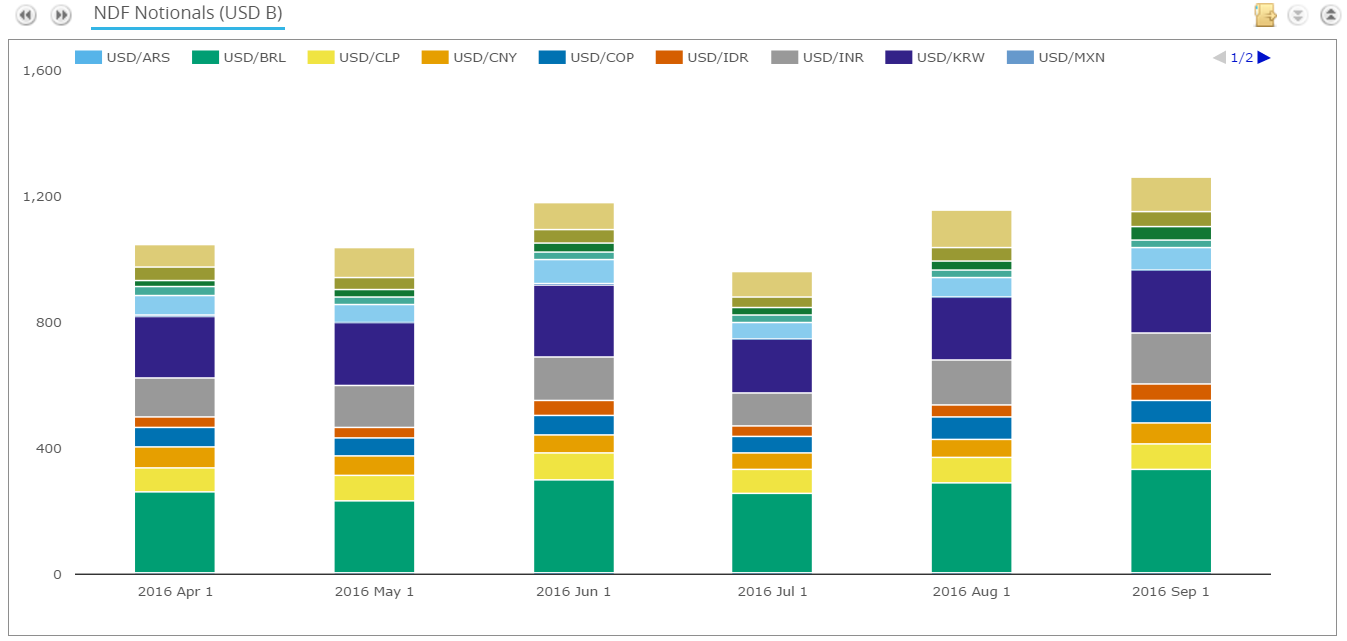
- Daily volumes of NDFs reported to SDRs since April 2016.
- This includes both trades reported as Uncleared and Cleared.
- Using this data, we can see that SDR data yields an Average Daily Volume of $49.9bn during April 2016.
- BIS data reports an NDF ADV versus USD of $130.2bn.
- This suggests that SDRView data covers 38% of the market.
We will therefore assume that SDRView consistently accounts for 38% of the overall market.
A framework for analysing NDF markets via Clarus data
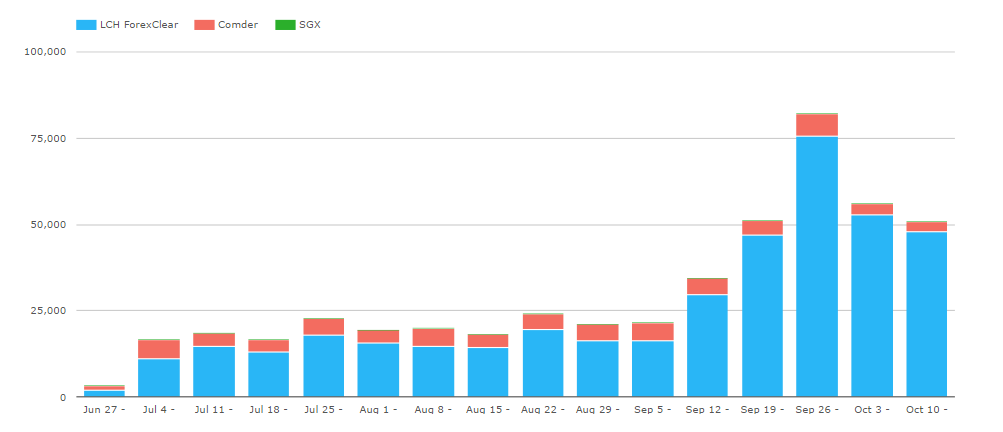
We only have to take a quick look at NDF volumes in CCPView to know something has changed in the market since the first week of September. Volumes of Cleared NDFs have continued to grow week-on-week during September – although the growth seems more steady in October (so far):
Let’s therefore use an SDRView scalar to estimate what percentage of the whole market is now being cleared:
- SDRView NDF Volumes (both Cleared and Uncleared) in April 2016 were $1,048bn, equating to an ADV of $49.9bn.
- SDRView NDF Volumes in September 2016 were $1,260bn, equating to an ADV of $57.3bn.
- SDRView NDF Volumes in October 2016 so far were $490.6bn, equating to an ADV of $44.6bn.
In each case, we will assume that SDRView consistently reports 38% of the market. We therefore see the following evolution of Clearing in NDFs during 2016:
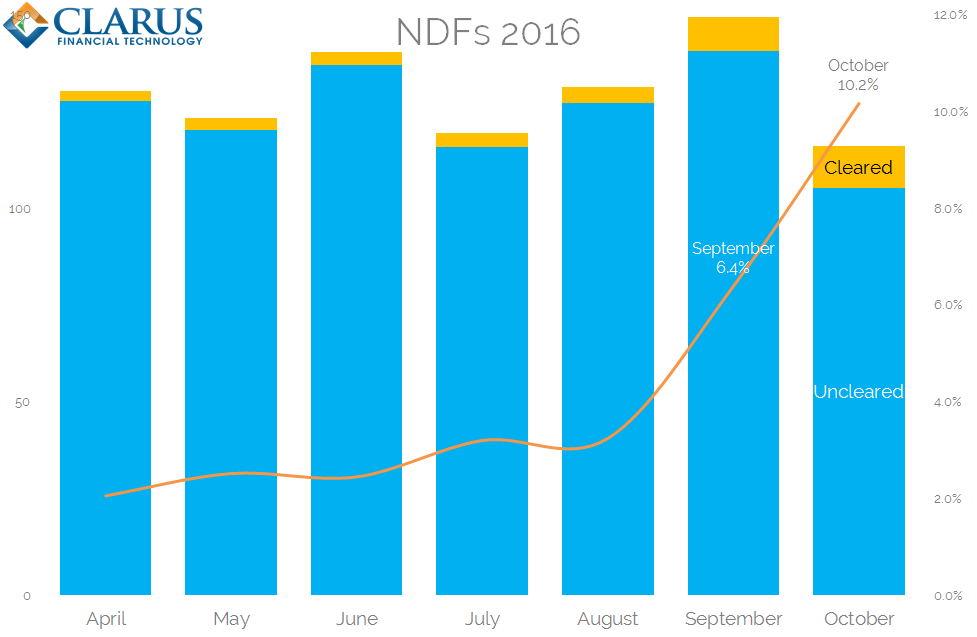
- 2.1% of the entire NDF market was cleared in April 2016, consistent with our earlier data.
- This first increased in July and August to 3.2%.
- And doubled in September to 6.4%.
- This month, over 10% of the market has been cleared in NDFs.
This framework, utilising all data sources available to us, therefore shows that Clearing has continued to grow during October. This is despite an overall drop in market activity this month.
What’s next?
- We have demonstrated that Clearing continues to grow in NDF trading.
- We combine 3 different data sources – CCPView, SDRView and the BIS triennial survey.
- We now know that SDRView covers 38% of the global NDF market.
- And we can demonstrate that over 10% of NDFs are currently being Cleared.
- Our users can even track the percentage of the market being cleared on a daily basis (the peak so far is 16.5%!).
- And interested users can further drill-down on a per-currency basis.
- Again, we have market reform to thank for increasing transparency in our markets.