- We look at the BIS Triennial Survey to calculate what percentage of global derivative markets are currently being Cleared.
- We use CCPView to look at trends in this data.
- The CFTC have recently published their Clearing Mandate for Additional Currencies, with other jurisdictions announcing clearing mandates for next year.
- We therefore look at the timelines for things to change.
- As more trades become cleared, BIS survey data will converge with Clarus data.
April 2013 vs April 2016
What can change in 3 years? With the pace of OTC Derivatives markets reforms, it would appear quite a lot. In April 2013, only Category 1 firms in the US were subject to mandatory clearing. Since then, a further seven clearing mandates have come into force across other jurisdictions – as referenced by the CFTC in their recent final rule concerning the upcoming expansion of the original clearing mandate.
It’s worth bearing this in mind when looking at the most recent BIS Triennial Central Bank Survey. Published at the beginning of September, the data from the BIS was collected during April 2016 from 52 jurisdictions and is considered the broadest measure of market activity for derivatives. It is particularly useful to market participants because it publishes turnover data rather than notional outstanding. This is great, but unfortunately it happens only once every 3 years.
A big trend identified in the 2016 BIS report was the change in trading location from London to New York. However, I want to focus on the shift in currency composition for Interest Rate Derivatives. There was a huge shift out of EUR activity and into USD swaps.
The BIS derivatives explorer shows this in a fairly stark fashion:
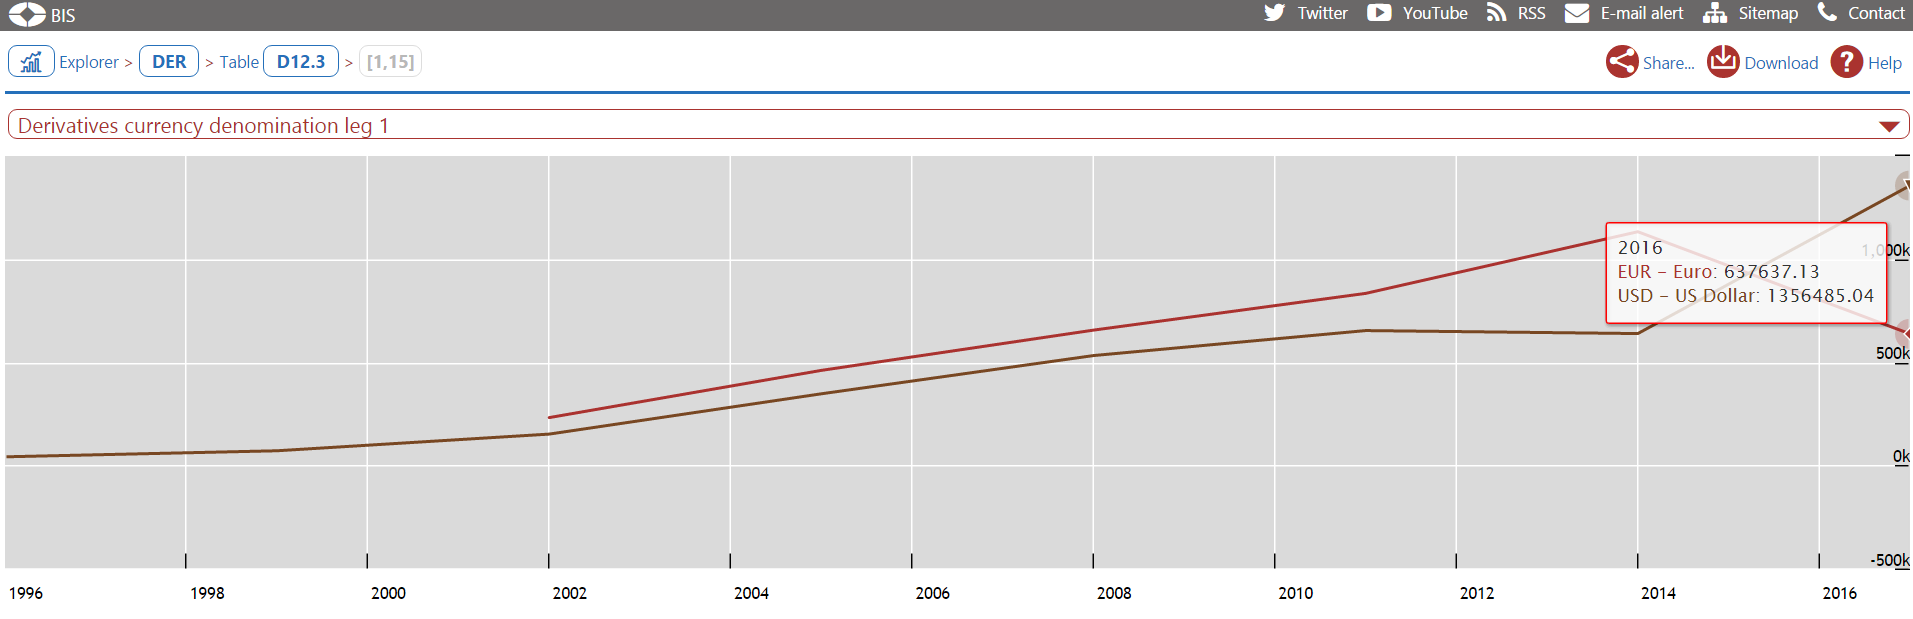
Showing;
- Average daily Turnover during April with a single data point every three years.
- In 2013, BIS reported Average Daily Turnover for:
- EUR denominated Interest Rate Derivatives at $1,133 bn per day (in USD equivalent amounts)
- USD denominated contracts at $639 bn.
- By 2016, these figures had reversed:
- EUR denominated contracts saw an activity of $638 bn per day
- USD denominated contracts were at $1,356 bn.
Definitions and Product Scope
As always, we need to understand the data behind these figures. The BIS define Interest Rate Derivatives on page 14 here:
“any interest bearing financial instrument whose cash-flows are determined by referencing interest rates or another interest rate contract.”
Interest Rate Swaps make up the majority of these volumes. The broad definition that BIS uses means that all Fixed-Float (including OIS) and Basis swaps should be reported as “Swaps”. Inflation swaps, whose notional schedule varies according to an “index-amortisation” are included under “Other products” according to my interpretation of the guidelines.
When we use the BIS data explorer to look at only Interest Rate Swaps, we see a huge shift in activity out of EUR-denominated products and into USD:
- In 2013, EUR had $684 bn per day traded vs only $444 bn in 2016, dropping by over one-third.
- In 2013, USD had just $356 bn traded per day vs a huge $898 bn in 2016, over 2.5 times larger.
CCPView as a Global Data Product
I was pretty surprised by this huge shift in trading activity, even when taking into account the big move in EUR/USD spot. I therefore wanted to try to independently verify it. How can I do that using publicly available swaps data? Clarus data products of course (I think I’m allowed one shameless plug in a blog!).
Our broadest coverage of global activity in Interest Rate Derivatives comes from CCPView. This collates data taken from CCPs themselves and as such is our broadest measure of market activity. We have data going back to September 2014 for LCH, and longer for other CCPs:
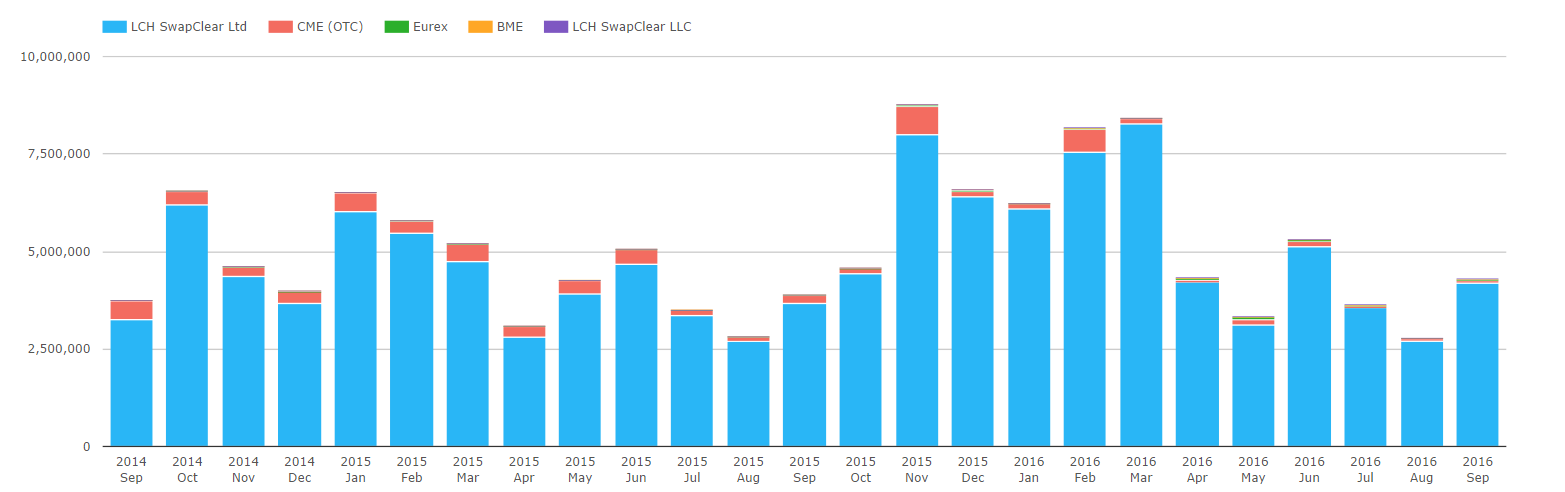
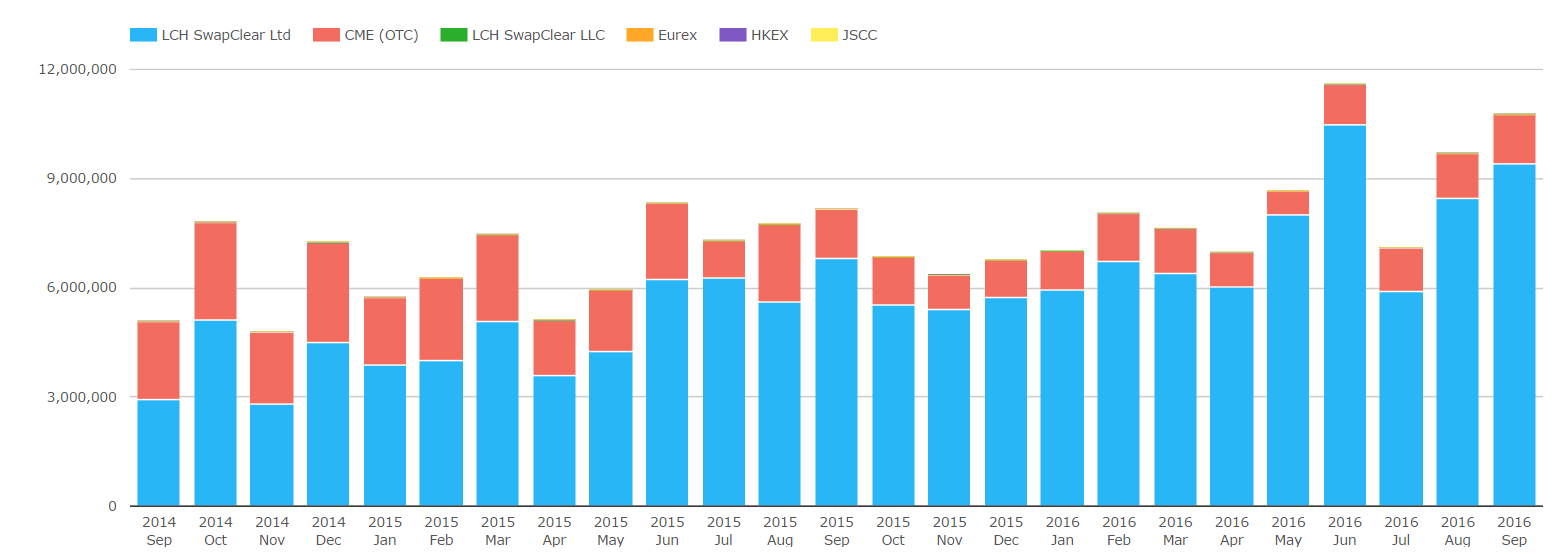
These historic charts of monthly volumes by notional show;
- In EUR IRS, an erratic time-series with no clear trend.
- In USD IRS, a steady increase in global cleared volumes.
- The changes in volumes for EUR and USD swaps in our time-series are not as pronounced as reported by the BIS. The numbers above are shown in currency, therefore removing the impact of falling EUR/USD FX during this time.
- This Clarus data does show a very healthy increase in USD IRS volumes since September 2014:
- Up to April 2016, when the BIS volumes were measured, monthly volumes had increased by 138%.
- Monthly volumes have continued to grow ever since. In September 2016, they had increased by 213% compared to September 2014.
- However, for EUR IRS the story is not one of shrinking volumes, but static volumes:
- September 2014 and September 2016 saw similar volumes traded (both at €4.3 trn).
- April 2016 also saw €4.3 trn trade during the month.
How do we compare this with the BIS figures?
It is a shame that the BIS survey is only once every 3 years. From our detailed view of the Cleared markets in CCPView, we can see that volumes can vary significantly on a monthly basis. It is also unfortunate that the BIS do not break-down the monthly turnover by cleared vs uncleared transactions as this could have been a key trend in the data between April 2013 and April 2016.
Fortunately, we can take our Clarus data and directly compare our Average Daily Volumes during April 2016 to those reported by the BIS. Because we are confident that the Clarus data gives us the whole of the cleared universe of Interest Rate Swaps, this means we can calculate the percentage of each market that is cleared.
Before we analyse those figures, it is important to note three things about the data:
- BIS reports cleared volumes on a pre-novation basis in the triennial survey – this is different to how they report notional outstanding in the semi-annual survey. As such, BIS do not double count volumes for cleared swaps, aligning their methodology with our own, as outlined in our data principles for CCPView.
- We do not include any CCP Compression volumes in our data (e.g. TriOptima). We assume that BIS turnover data relates only to new activity, but this is not made explicit in the explanatory notes.
- We are confident that we incorporate all cleared swap volumes. We therefore have to assume that the difference between our CCPView volume and the BIS volume is uncleared.
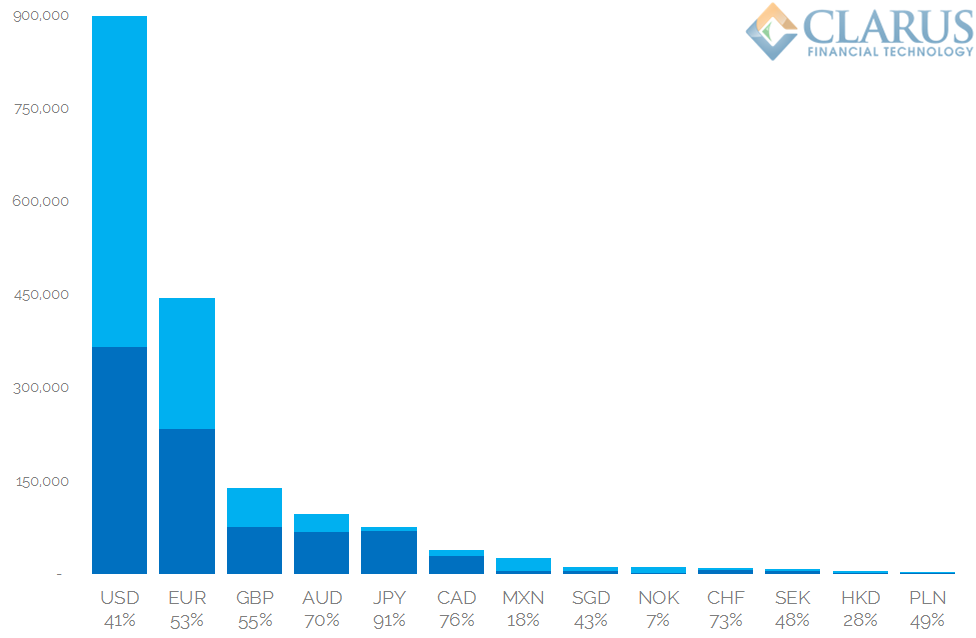
My 5 key take-aways from this data are:
- The take-up of clearing for USD IRS is surprisingly low at just 41%.
- The take-up of clearing for JPY IRS is remarkably high at 91%.
- NOK IRS is a clear anomaly, with very low cleared volumes.
- The relative sizes of the USD and EUR markets are quite different in the two data sets. USD IRS is over two times larger in the BIS survey, whilst Cleared USD swaps are 1.5 times larger than EUR in the CCPView data.
- This is a significantly different picture painted to the one offered by SDR Data. SDRView shows that US Persons cleared over 85% of reportable USD IRS trades by volume in April 2016. The figures are also different to the CFTC research on pages 121 and 122 of the final rule, which used a combination of Part 43 and Part 45 data.
Where does that leave us?
Two simple conclusions for today. With clearing mandates in force across the globe, we can reasonably expect the BIS figures to converge towards the CCPView figures over the next three years. Exactly when will depend upon the currency.
Secondly, it is fair to say that the global take-up of clearing is (generally) lower outside of the US. I assume this is due to the different states of the clearing mandates.
When will the rest of the world catch up with the US? With the publication of their most recent clearing mandate, the CFTC have helpfully given us a timeline as to when clearing mandates begin to take effect on a currency-by-currency basis:
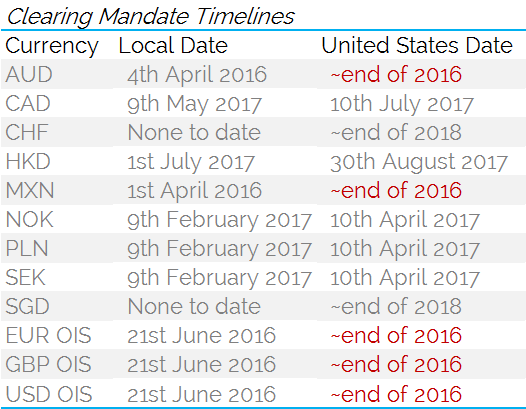
This final rule is yet to appear in the Federal Register. Once it does, market participants will have 60 days to comply. I’ve estimated that will coincide with the end of the calendar year.
In Summary
- The once-every-three-years BIS survey gives us a chance to derive uncleared volumes in Interest Rate Swaps.
- With Clearing mandates in different jurisdictions either expanding or just about to come into force, we expect the global uptake of Clearing to increase for Interest Rate Swaps.
- From a data perspective, that means more transparency of derivatives markets, with data available on a much more timely basis.
- We say amen to that, and look forward to the continuation of market reform.