- We look at the volumes being cleared in NDFs
- The growth is impressive, with nearly $200bn cleared in September
- This growth accelerated in the final weeks of September
- USDINR saw the highest volumes and USDBRL saw the largest growth
Tod took a look at NDF clearing as of the 20th September, noting that volumes were really beginning to take-off.
Having previously looked at NDF clearing, and in-particular the benefits of multilateral netting in clearing, it’s good to see the volumes finally coming through. This week, I’ll dive into the data a little more to look at the growth and which currency pairs are trading.
CCPView
We’ve got a decent amount of history in CCPView for NDFs. Looking at this history on a monthly basis since 2015 puts the recent volumes into context:
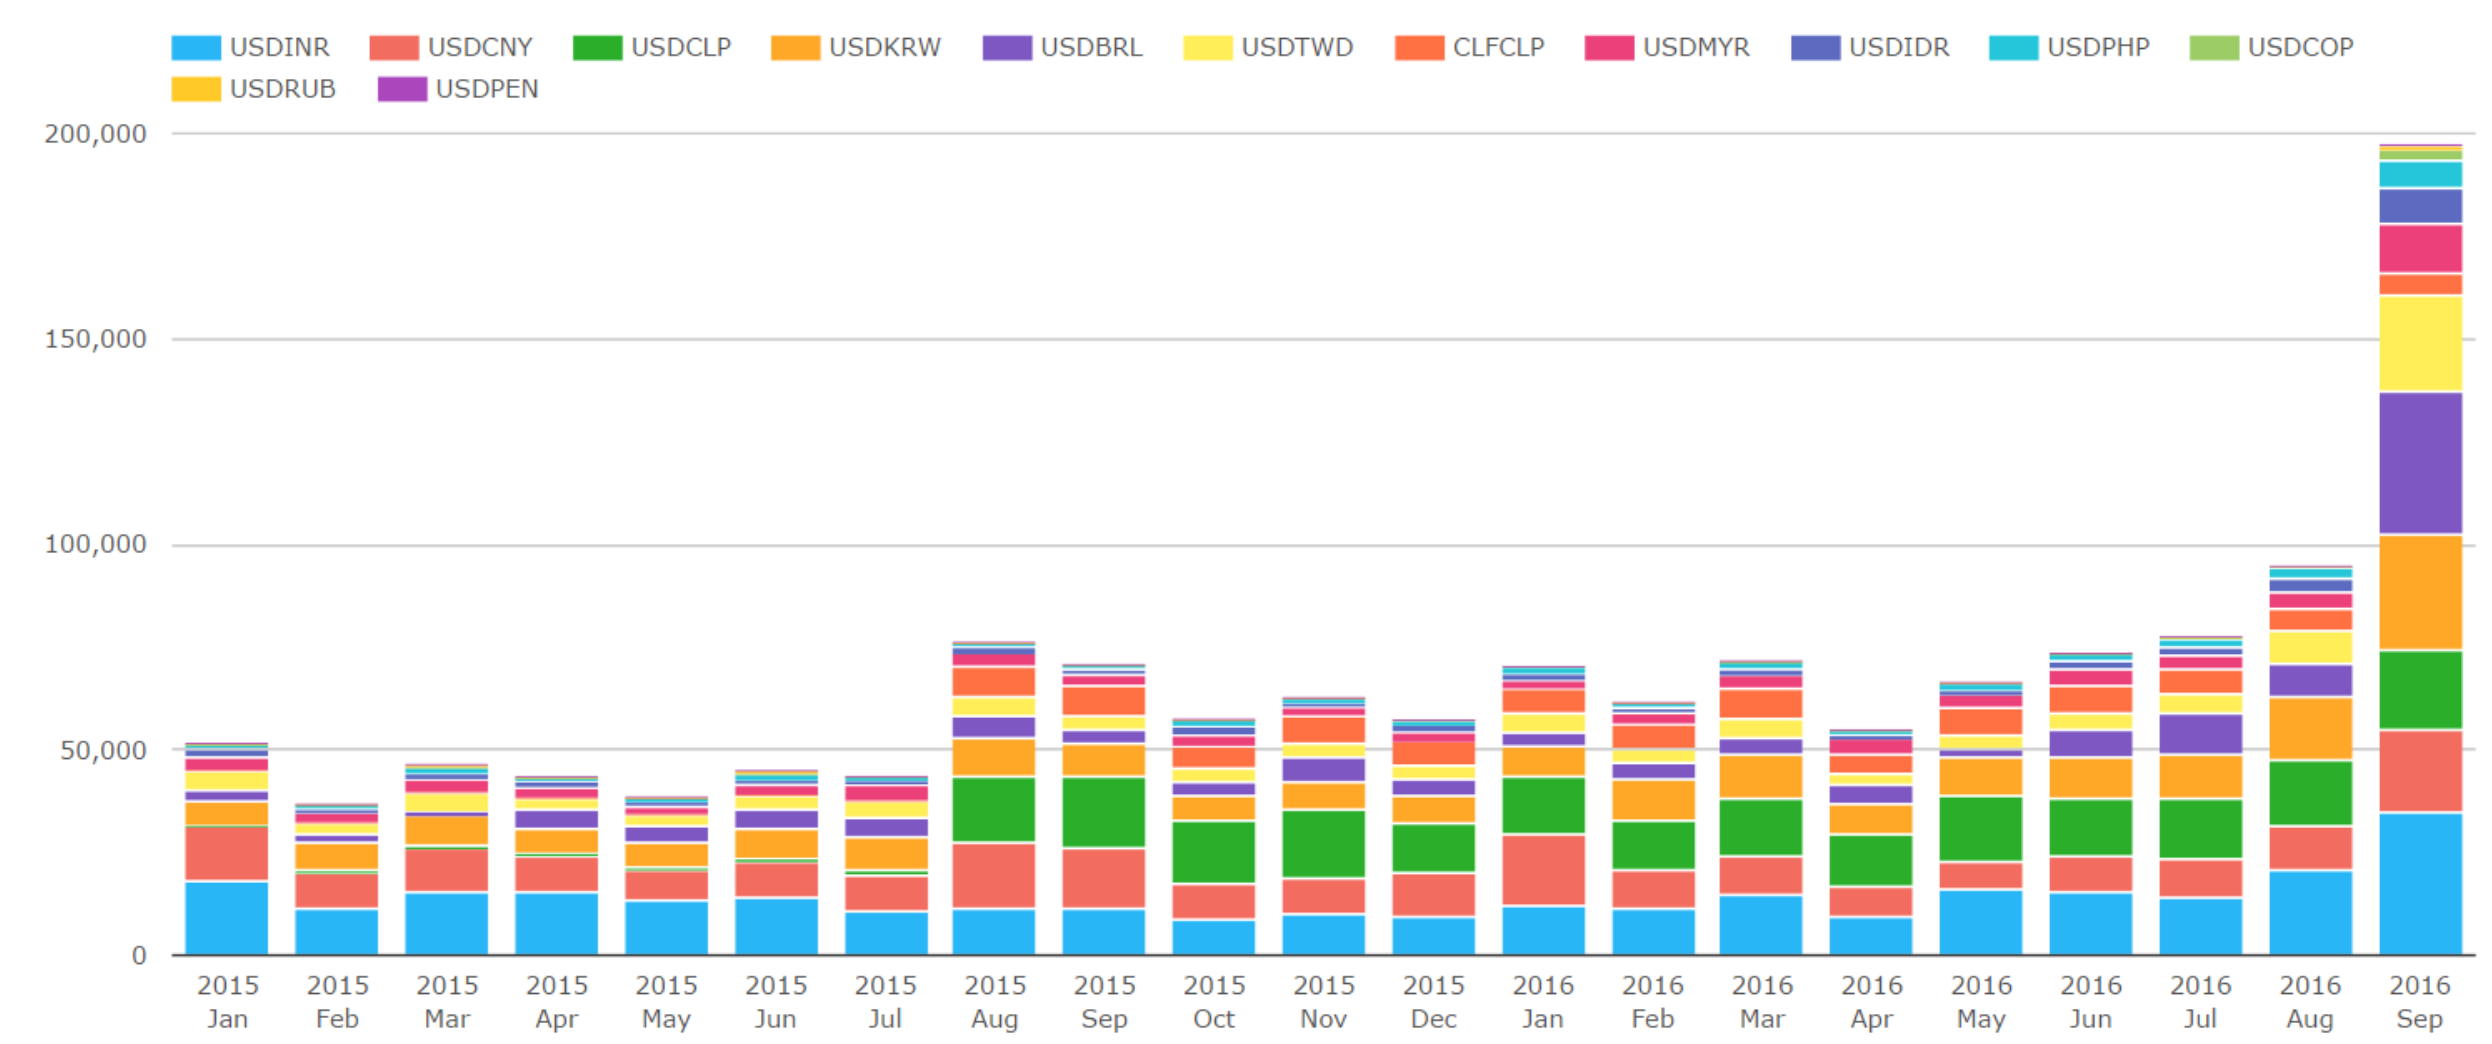
Showing;
- September 2016 saw the largest volumes in a single month, approaching $200bn. The chart shows volumes across all 3 clearing venues – LCH ForexClear (the largest), SGX and Comder.
- Last month was the first time that global cleared NDF volumes have surpassed $100bn equivalent in a single calendar month.
- Volumes were basically double in September compared to August, and this was with August 2016 as the previous record month. Impressive growth indeed.
A momentum story
When we look at the data in a little more granular manner, recent volumes on a weekly basis shows that growth is really gaining a head of steam:
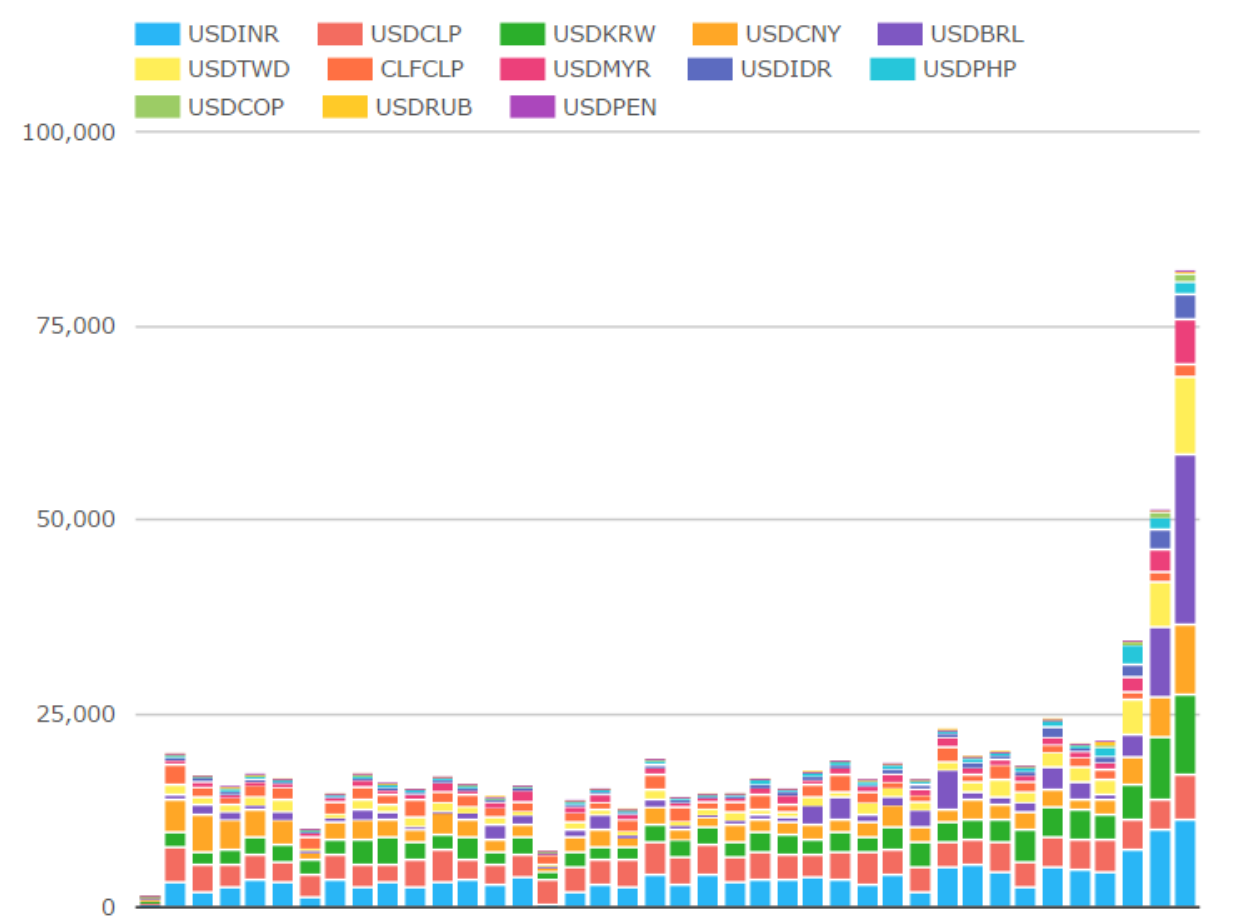
Showing;
- The last week in September saw the largest volumes, recording over $75bn in a single week.
- That last week in September therefore saw more volume trading than most months during 2015 and 2016!
- It is important to monitor this trend to see if weekly volumes continue to grow.
What Currencies are Trading?
I was naturally interested to ask what currency pairs are driving this growth – hence all of the charts above being split by currency and not by clearing venue.
We can get a rough idea from the previous charts. These show that growth has been seen across most (active) currency pairs and fairly evenly distributed. This has not been a story of a single currency pair moving to a cleared environment – the benefits of multilateral netting in the face of Uncleared Margin Rules means that it is portfolios of diverse currencies that are beginning to be cleared.
Let’s do some drill-down on the currency pairs to get a better view:
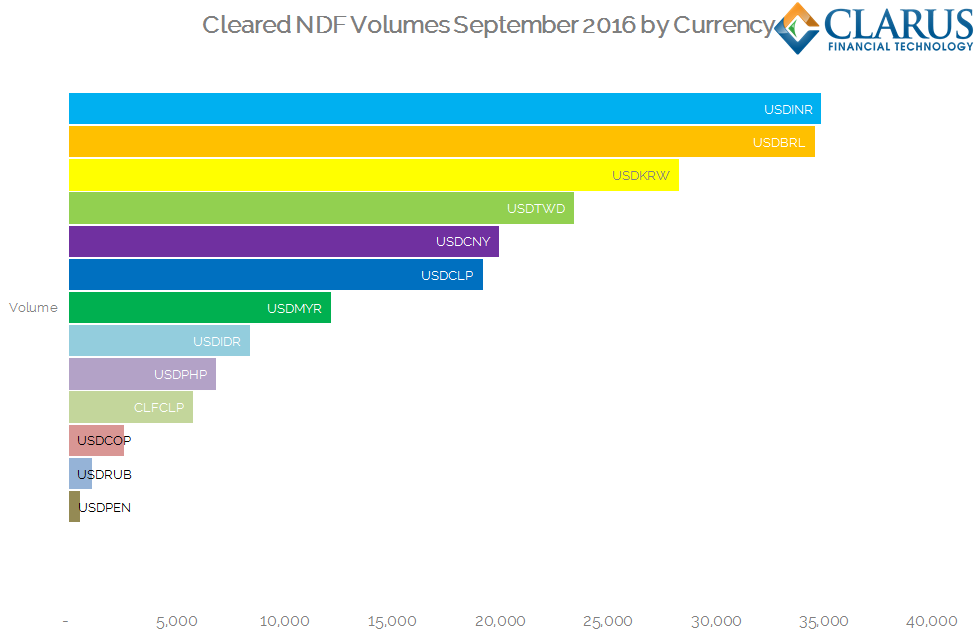
Showing;
- USDINR and USDBRL are basically tied in first place for volumes.
- Each saw volumes of nearly $35bn, accounting for 18% each of the cleared market (i.e. 36% of cleared volumes are across only two currency pairs).
- USDKRW is third, with $28bn in volume, accounting for 14% of volumes.
- There is then a group of currencies accounting for 10-12% each of volumes: USDTWD, USDCLP and USDCNY.
- The top six currencies are therefore dominated by activity in Asian NDFs.
- There is then a relatively large drop-off in volumes, with only USDMYR registering over $10bn in monthly activity.
What Happened between August and September 2016?
For a ‘newbie’ looking at these figures for the first time, it is worth putting September’s activity across the currency pairs in perspective by comparing the currency split in September with that in August. See the graphic below:
![]()
Showing;
- Currency pairs by cleared volume, ranked by size.
- The Rank Change shows the change in relative position compared to volumes during August 2016.
- USDINR has retained the number one position in terms of cleared volumes. These volumes are all at LCH ForexClear.
- USDBRL has seen a much larger growth in volumes than USDINR, with over 4 times as much trading in September as in August.
- This increase, coupled with static volumes in USDCLP, (which is cleared at Comder) sees USDCLP drop down from second place in August to sixth in September 2016.
- The currencies that have overtaken USDCLP in cleared volumes are mainly from Asia.
- It is also noteworthy that USDBRL volumes have overtaken those of USDCNY.
And Finally some Dirty Data
As we often find with newer markets, it can take time to make sense of the data coming through. In this blog, we have only used data from CCPView so far. Let’s call this a “golden source” as it comes from CCPs themselves.
When we look to both our SEFView and SDRView products, we see slightly different stories emerging. Remember these predominantly serve the “US Persons” portion of the market, therefore do tend to exhibit different biases to global data. This month, we note two things:
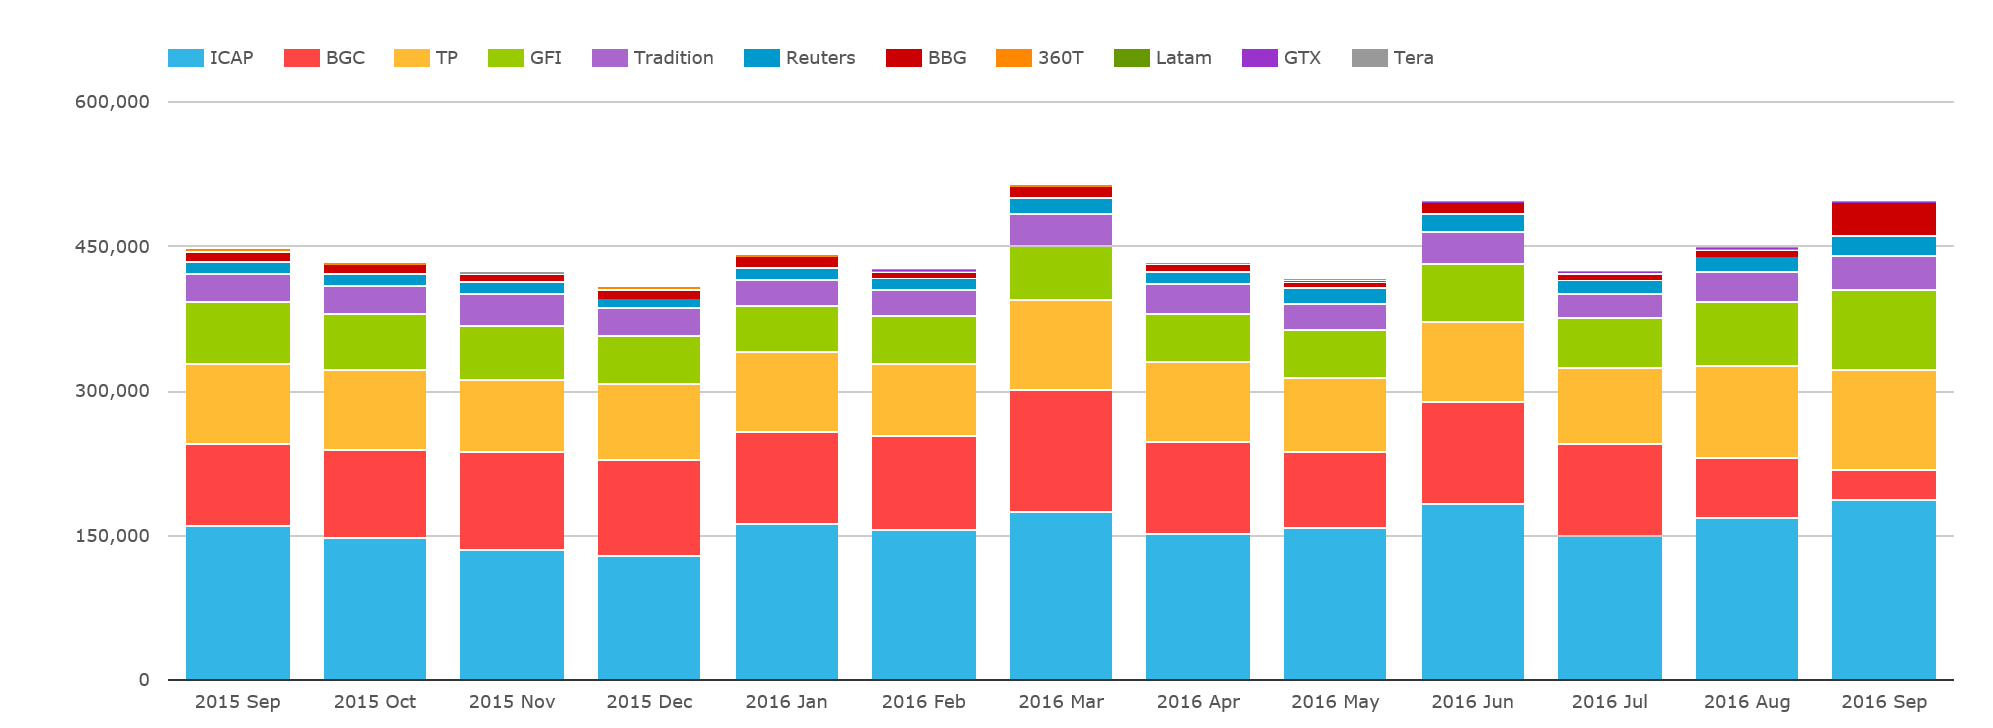
1. There hasn’t been a commensurate increase in SEF-traded volumes during this increase in Cleared volumes. It appears the move to clearing is driven by post-trade efficiency rather than a change in pre-trade execution venue (so far….). The chart below shows NDF volumes from SEFView since last year, with little change noticeable in September 2016:
2. The SDR trade reporting data still doesn’t show the same volumes being Cleared as are being reported by the Clearing Houses themselves. See Tod’s blog last week for some suggested reasons for this.
It is true that we see a growth in Clearing from SDR data. For example, the chart below shows the percentage of the market being cleared (by volume) for the top four currencies on a daily and 10-day basis….
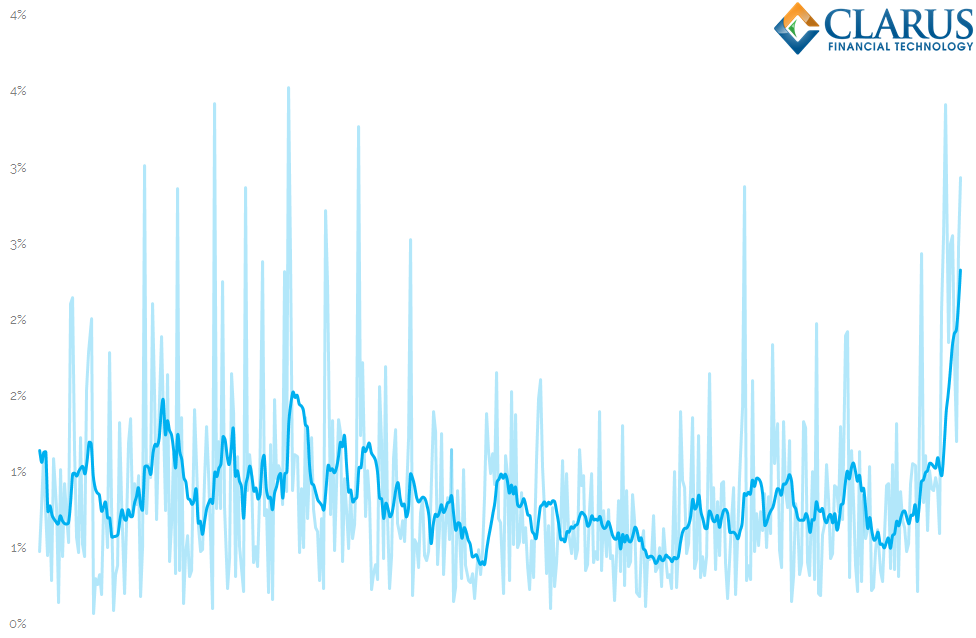
….but the size of the volumes being reported for Cleared trades to the SDR is much much smaller than we would expect. We only see about $12bn in cleared NDFs reported to the SDRs for September, compared to $200bn by the CCPs. This difference remains a bit of a conundrum to us, but we’ll keep on digging for reasons.
In Summary
- Nearly $200bn was cleared in NDFs during September 2016
- The top currency pairs being cleared are USDINR and USDBRL
- These two currencies alone account for 36% of the market by volume
- Asian currencies make up 4 of the top 6 currencies
- USDBRL saw a particularly impressive growth in volumes during September
- There is still a disconnect between the global cleared market and the percentage of the market being reported as cleared in the SDRs.
- Growth has been accelerating in recent weeks, suggesting this trend towards clearing could still have some way to run.