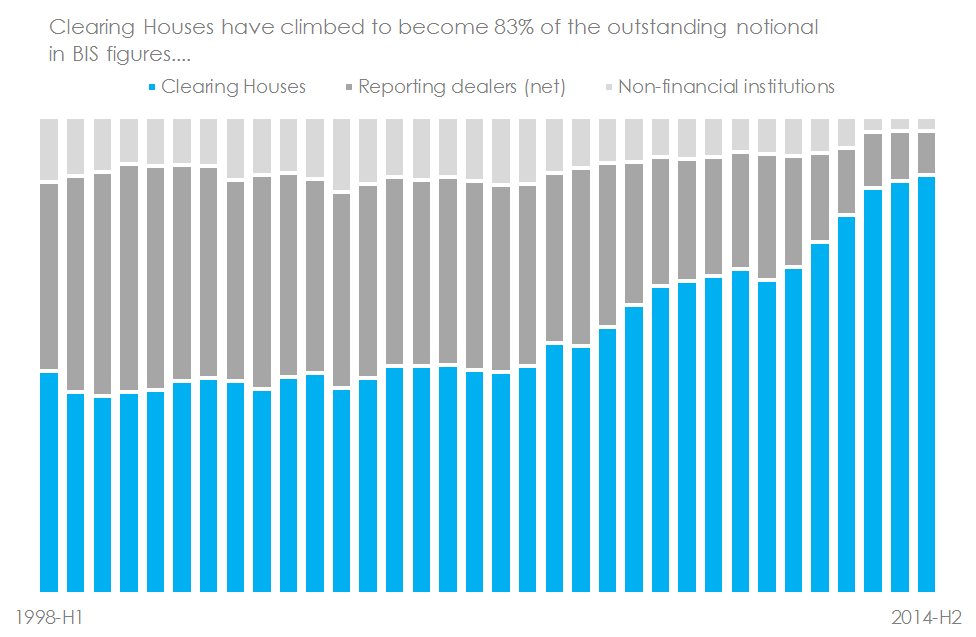
What is the relationship between Clarus data and the Bank for International Settlements (BIS) data? It is a great question to ask. On the whole, BIS data is delayed by nearly six months; Clarus data is available in close to real-time. For Cleared swaps, CCPView data is easily reconciled to the BIS and is shown to be virtually identical. This accounts for 83% of outstanding notional. For the remaining uncleared swaps, we have to look at Open Interest versus Volume data.
The BIG Numbers
Make of it what you will, but the BIS surveys are inherently associated with very large numbers. The latest report shows a decline in notional outstanding for Interest Rate products, but still reports a massive $505trn in notional outstanding. I’ve used the data files here, to show that:
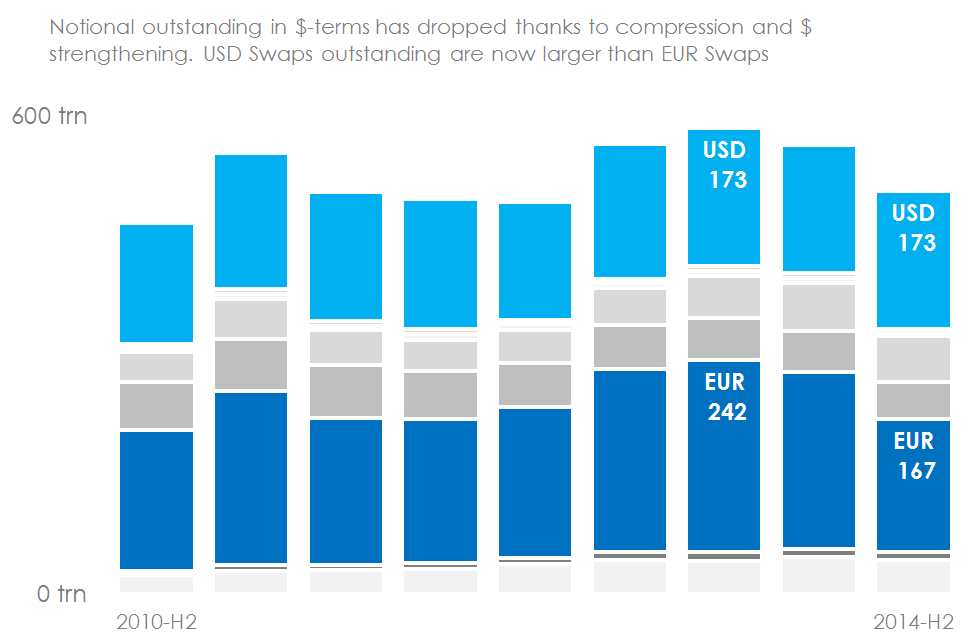
As we looked at in our recent blogs, the rate of compression in EUR swaps is a compelling story. Taking into account the FX moves, the weakening of the EUR vs the USD would only account for a drop from $242 to $210trn on the chart above. The pace of compression (plus maturing trades) in EUR swaps is therefore much greater than in USD swaps.
We know from CCPView that EUR swaps are far more concentrated at LCH than USD swaps – which are split between two CCPs, LCH and CME. Is it a case that a single node of clearing really increases “compress-ability” by such a large extent? We can (and do!) use CCPView to monitor that trend on a weekly basis.
Clarus Coverage of BIS Data
The BIS note a trend in their data that is a direct consequence of regulators desire to change the structure of OTC derivatives markets and reduce systemic risk:
Therefore, our CCPView product is the most comparable to the BIS survey. CCPView includes figures on both Open Interest (“Notional Outstanding”) and Volume (“Turnover”). We strictly adhere to our principles for good data – as such, we argue that the BIS are double counting their Cleared swaps which leads to an artificially large “Notional Outstanding” figure. We believe in single-counting cleared volumes, and as such we adjust the BIS figures accordingly.
Nonetheless, it is a very simple task to reconcile between CCPView and the latest BIS survey. Here is the Open Interest for IRS as at end December 2014 from CCPView:
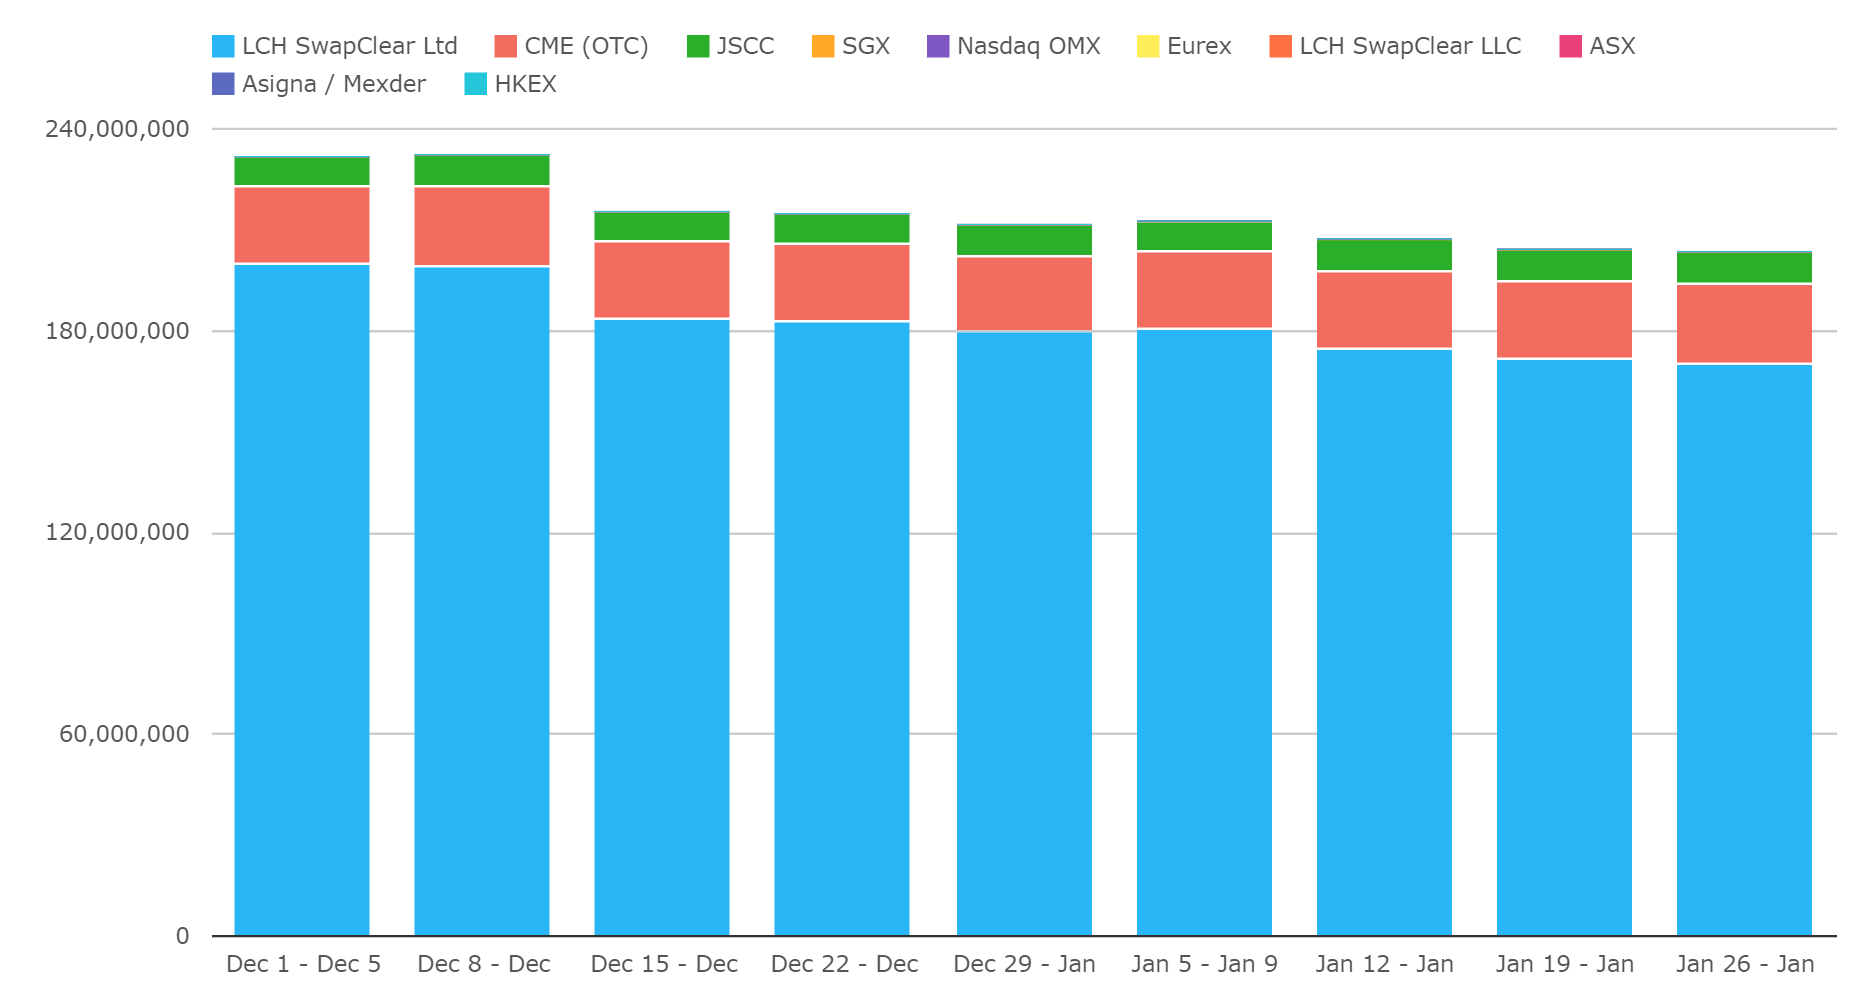
What we see is:
- CCPView shows a total Open Interest of $211.7trn as at end of December 2014.
Adjusting for the double-counting methodology of the BIS (see our core principles), for cleared trades:
- BIS shows a total Open Interest of $202.7trn as at end of December 2014.
Almost spot-on! The ~4% difference is due to FX moves within the month – CCPView using a start-of-month FX, versus BIS taking an end-of-month FX mark. CCPView also includes a couple of financial centres that are not part of the BIS survey (such as Hong Kong), but their inclusion has a marginal impact.
On the whole, CCPView provides a weekly update of the same data-set that BIS uses for its’ semi-annual reports. We can’t stress enough the difference in timeliness – I had to wait nearly five months to write this blog!
CCPView versus BIS
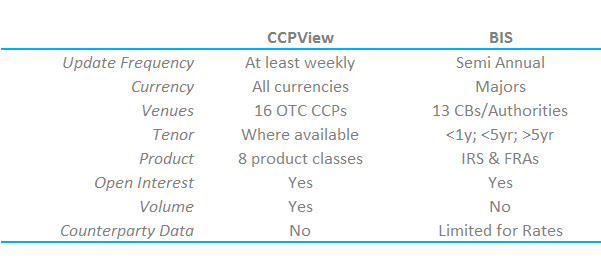
For the cleared portion, I thought it would be useful to summarise the CCPView and BIS data contents:
And in addition to this, we have shown recently that SDRView complements CCPView by providing trade-by-trade granularity in real-time for up to 67% of the CCPView data.
Uncleared Trades
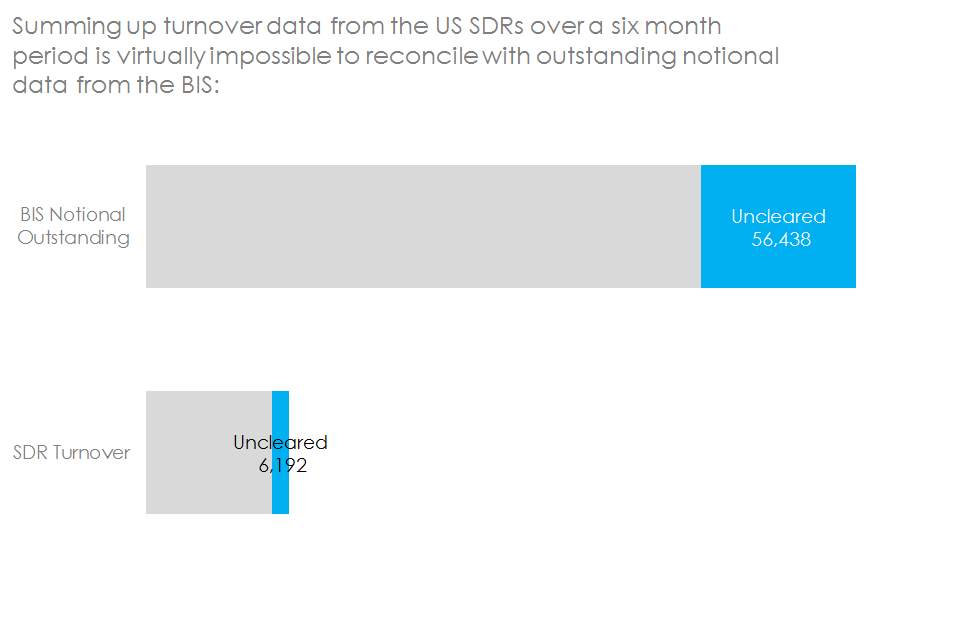
We have established that CCPView contains comparable data for the vast majority of the BIS reports. The BIS report also includes statistics on uncleared trades, specifically between “Reporting Dealers” and “Non-Financial Institutions”. We cannot use CCPView to generate a direct comparison to these figures, but we can use SDRView.
The non-cleared section of BIS data accounts for about 17% of Notional Outstanding. For uncleared swaps, Clarus collect data on a Turnover (or Volume) basis from the US SDRs using SDRView. This creates an interesting problem:
For example. we can compare the currency distribution for uncleared swaps in the BIS data with those in the US SDRs. What we see is unsurprising:
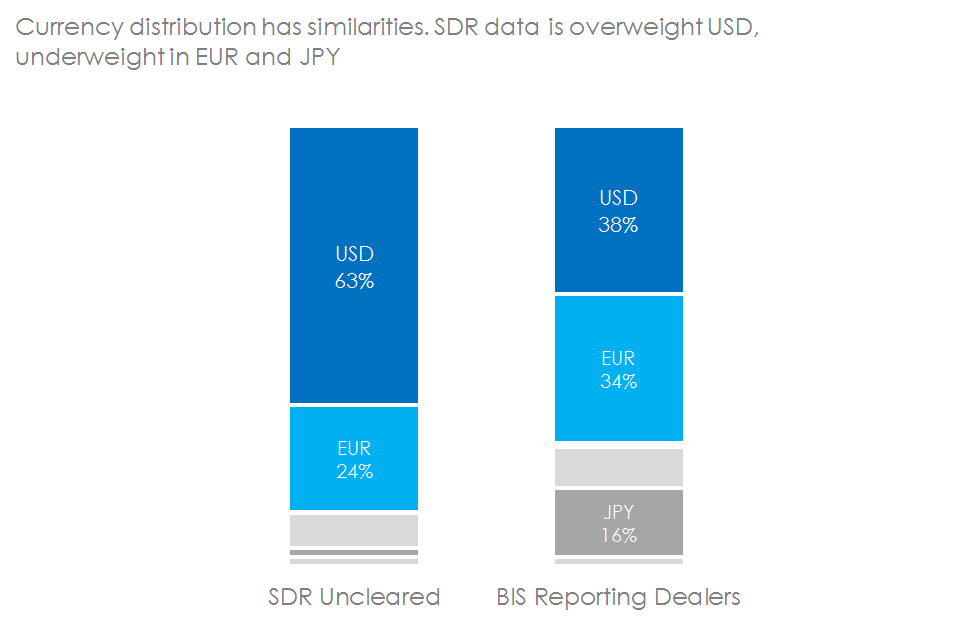
This is extremely useful information. Knowing the bias in the SDR data we are looking at allows us to draw far more meaningful conclusions. Identifying any weaknesses in our data set also allows us to hunt them down and improve them in the future!
We were already aware of the exceptional granularity of data for the USD markets in the SDR data. Just last week, we concluded that US SDRs cover over 65% of volumes on a trade-by-trade basis in real-time for USD swaps. The comparable number for EUR markets was around 25%. Lo and behold, we see a consistent story of coverage when looking at Uncleared swaps.
In Summary
- The data-sets used by Clarus and BIS have converged rapidly.
- CCPView provides a weekly update for 83% of the BIS survey data.
- SDRView complements this with a real-time insight into both cleared and uncleared swaps, with a bias towards US markets.
- Clarus provide far more granular data for Cleared markets than is possible through the high level survey data of the BIS.
- The BIS provide Notional Outstanding data for Uncleared Swaps. This makes the degree of coverage for Uncleared Swaps within SDR Volume data difficult to assess.