- 83% of Interest Rate Derivatives are now cleared according to CFTC data.
- We use the CFTC data to benchmark our Clarus cleared data and find them to be in agreement.
- We therefore assume that the CFTC data for uncleared markets is also accurate, opening up more transparency into these important markets.
- We find that there remains a surprisingly large portion of vanilla USD IRS that are yet to be cleared.
- We also take a look at Cross Currency Swaps and Swaptions, two of the largest uncleared markets.
The Swaps Report is Back!
Something strange happened this week. It may not be noteworthy for those of you that don’t write about data every week (!), but I received the following email from the CFTC:
Why is it notable that I received a circular from the CFTC? Well, it is the first time I’ve seen the CFTC’s swap report issued in over a year. I think when the DTCC “upgraded” reporting last year, something broke in the swap report and I’ve not received it since. Looking at the archive, this is the first one to be published in almost exactly a year, since December 2nd 2020.
As we are always happy when more transparency hits the market, I thought I should take a look at the data.
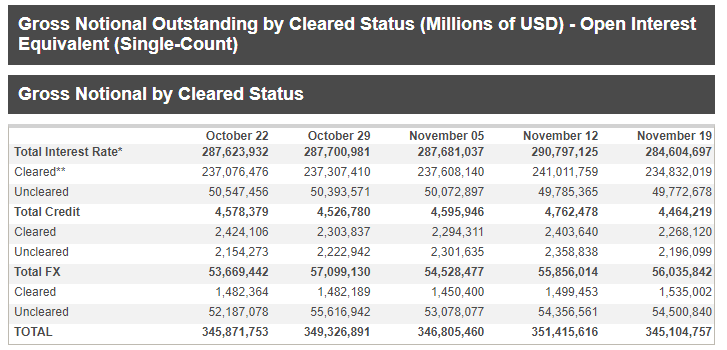
IRS Notional Outstanding in 2021
The latest CFTC Swaps Report includes data covering the past 5 weeks, showing the evolution of notional outstanding over this time across three major asset classes (Rates, Credit, FX):
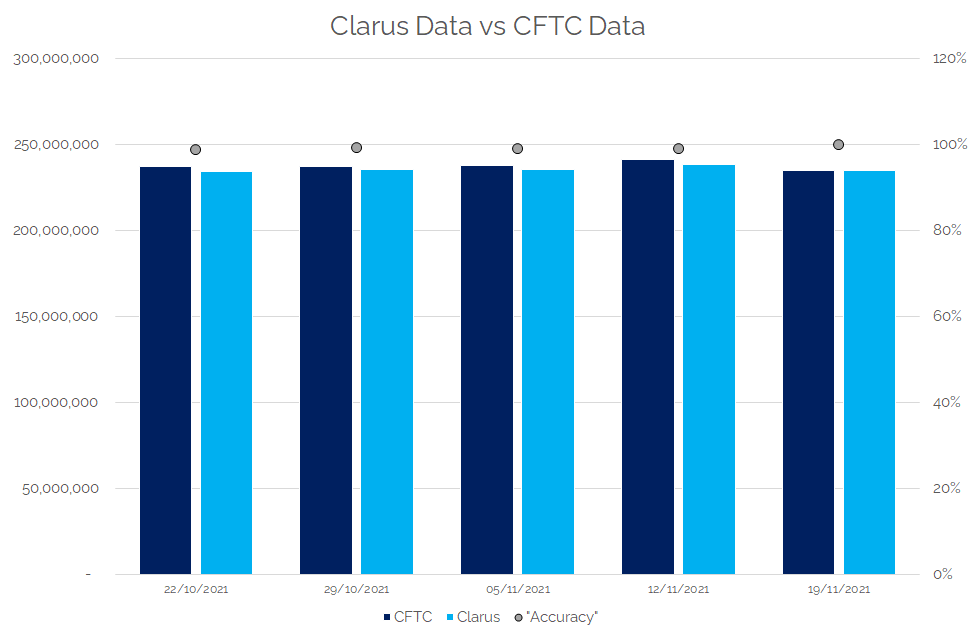
If we just focus on Interest Rate Swaps, we can compare this data with the daily data we have in CCPView:
First off, some comments;
- Amazingly, we have an almost 100% match between the Clarus data set and the CFTC data set for the past five weeks!
- This compares the Notional Outstanding on the 5 most recent dates as published by the CFTC. Wow. I’ve been writing this blog for a long time (some may say too long….!) and I can never remember two such disparate sources of data being quite so close in agreement.
- This is all the more amazing seeing as some of these amounts are reported in non-USD currencies and independently converted to USD by us, and by the CFTC.
Onto specifics, what does the chart show?
- These are snapshots of the notional amounts outstanding in Interest Rate Swaps on each of the five days.
- We normally write about notional volumes traded, so it marks somewhat of a change for Clarus to look at Notional Outstanding (akin to Open Interest in futures markets).
- It covers all types of OTC interest rate derivative – IRS, basis, FRAs, inflation and of course OIS (ahem…RFRs!).
- It covers 29 currencies (!).
- It looks only at cleared interest rate derivatives. Given CCPView only has data on Cleared swaps, this only seems fair!
Clearing Rates
Why am I pointing this out? Two reasons:
- The CFTC report also includes weekly data on uncleared volumes. This is therefore the most timely and best indication of global activity in uncleared markets that we have. If the cleared markets match so accurately, it is (probably) fair to assume the uncleared data is pretty good too!
- If any of our readers have been frustrated at the lack of drill-down data provided in the CFTC reports – well, you know where to come! CCPView will be able to help you drill-down per currency, per tenor and even dealer/client data for most cleared volumes in interest rate derivatives.
With that said, and given that Clarus also have data on Cleared volumes for the below currencies and products, I thought I would calculate the precise clearing rates by currency and product:
Remember, these are based on Notional Outstanding at a point in time. The latest data from the CFTC is as of November 19th 2021. Let’s therefore combine with CCPView cleared data as of that date and see what we’ve got.
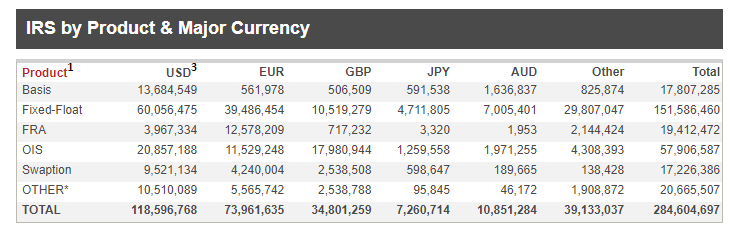
First up, USD, EUR & GBP:
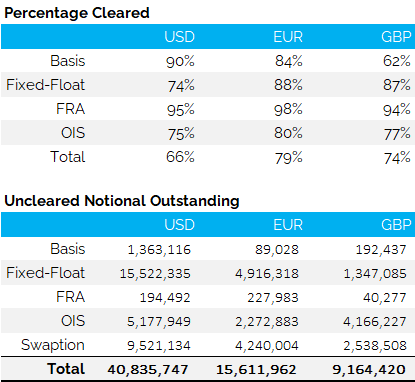
Showing;
- The percentage of each product type, per currency, that is cleared. This is calculated on a Notional Outstanding basis, as at 19th November 2021.
- The resulting uncleared notional amounts outstanding per product type and per currency.
- There are varying percentages of notional outstanding cleared by product type.
- Notably, 74-75% of USD OIS and IRS are cleared This is relatively low compared to the other major currencies and product types, that average 84%.
- Virtually all FRAs are cleared. This is good from an IBOR transition and fallback perspective, given that these products are not compatible with ISDA Fallbacks. Rather, FRAs will need to be converted to single period swaps vs RFRs. I haven’t seen the specific CCP plans for FRAs, but I assume this is what will happen during the conversion runs per currency.
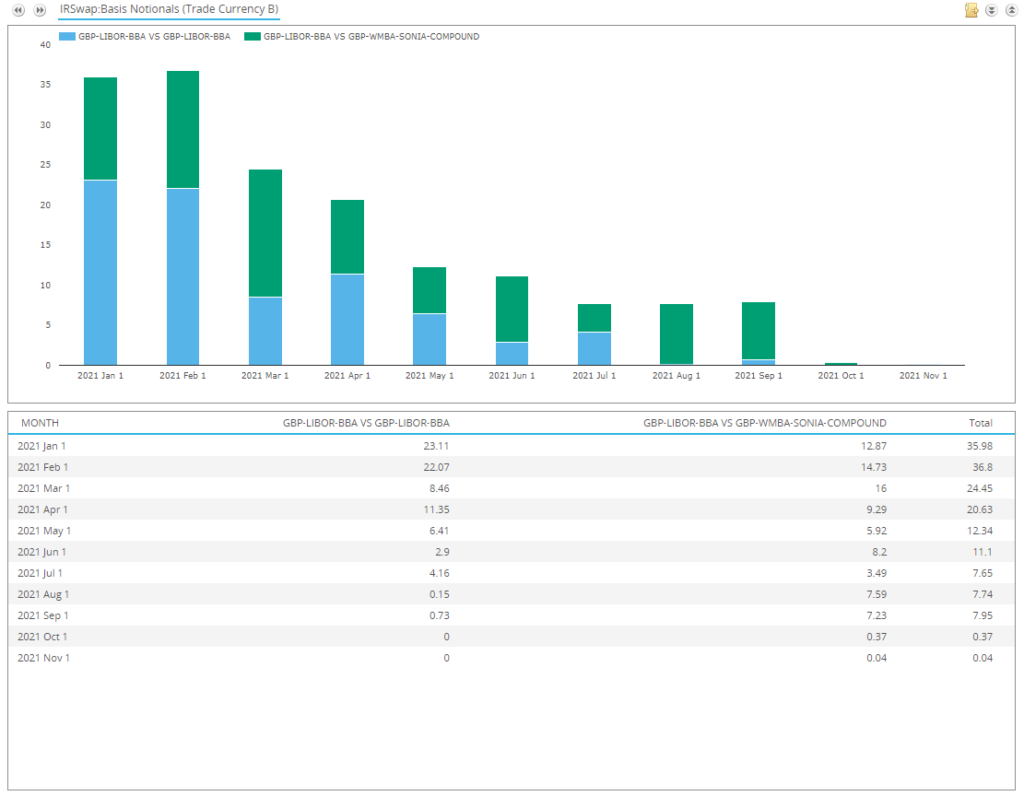
- It is notable that clearing of GBP Basis swaps is the lowest of the sample, at just 62%. This seems very strange to me and certainly sits as an outlier. Is this a reflection of continuing GBP “Base Rate” basis trading instead of SONIA? I would be surprised – the only basis swaps in GBP we have seen reported to SDRs during 2021 are LIBOR vs LIBOR and SONIA vs LIBOR – all of which are clearable:
Eagle-eyed readers will notice that the Clarus tables do not “add up” to the total. This is because I haven’t shown the corresponding clearing rates from the CFTC data for Swaptions and Others. Swaptions have a clearing rate of 0%, and “Others” unfortunately includes a mix of Inflation (clearable) and Caps/Floors (not clearable at the moment). Therefore it is worth providing some commentary on the “Totals” alone:
- 71% of Interest Rate Derivatives notional outstanding (in these three currencies) was cleared at a CCP as at November 2021.
- $65.6Trn notional was left uncleared.
- USD markets actually have the lowest overall uptake of clearing, and the largest amount of uncleared notional outstanding of the 3 major currencies. This is largely due to the large portion of vanilla USD IRS that is still not cleared, accounting for 38% of total uncleared USD notional.
- USD markets also have a much more significant swaptions market than other currencies. Swaptions account for another 23% ($9.5Trn) of the total uncleared notional outstanding in USD markets.
- Across all major currencies, Swaptions account for 25% of total uncleared notional.
That is the analysis for the 3 largest currencies in the data. I haven’t mentioned the overall picture yet because….
The Data Doesn’t Work So Well for All Currencies!
The story for JPY is a little more subtle. Certain CCPs are exempt DCOs under the CFTCs jurisdiction, such as JSCC (see here). This means that for e.g. cleared JPY swaps, the CCP is required to report only some of its cleared swap to the CFTC. This is seen in the data, which shows the total global cleared market as much larger in JPY:
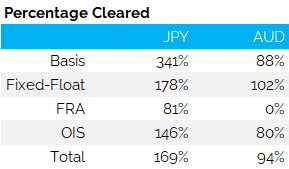
Showing;
- Clarus cleared volumes from CCPView are much larger in JPY than the total notionals reported by CFTC (which are across cleared and uncleared markets).
- This is a notably different relationship compared to all other currencies – even AUD.
- Why do I mention AUD? ASX is also an exempt DCO with the CFTC, therefore I expected to see similar for data patterns in both AUD and JPY. Maybe ASX volumes are just too small to show?
And What About Cross Currency Swaps?
The CFTC helpfully provides these same reports for IRS, CDS and FX markets. Looking at the FX markets, the cleared NDF figures very closely match our own in CCPView. Again, this suggests that almost the whole market is being captured. Whilst this may not necessarily ring true for the Uncleared data, it still suggests that it covers a significant portion of the market.
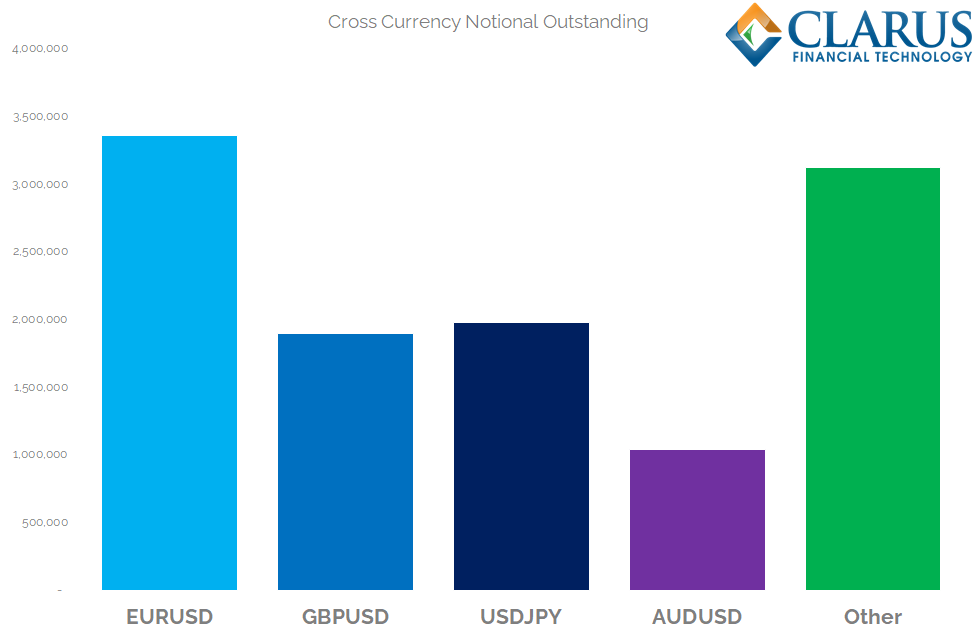
Therefore, I’ll finish this week by taking a look at both the volumes and notional outstanding in Cross Currency Swaps:
And notional volumes traded:
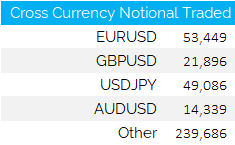
Showing;
- There are $11.4trn of Uncleared Cross Currency Swaps outstanding. For comparison, there are $17.2Trn of uncleared Swaptions outstanding.
- In terms of notional outstanding, EURUSD dominates like nothing else. The EURUSD market is larger than all “other” currencies outside of the 4 largest currency pairs.
- Only EURUSD, GBPUSD, USDJPY and AUDUSD have more than $1Trn outstanding.
- Volumes traded in any given week can obviously be very variable. We see, for example, that USDJPY was almost as active as EURUSD during the week ending 19th November. About $50bn traded in both currency pairs.
- The volumes traded suggest an average daily volume across all Cross Currency Swaps of $76bn. This is not a million miles away from the 2019 BIS Triennial survey, which suggested $108bn. The BIS also includes intra-entity and potentially even compression volumes, therefore it is reasonable to suggest that the CFTC data is representative of the overall market.
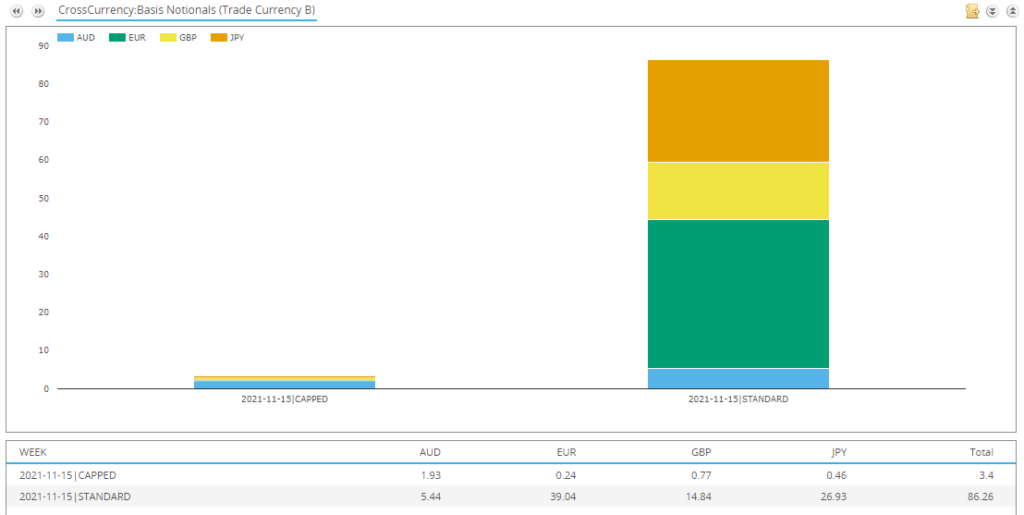
- Finally, comparing these XCCY volumes with those reported to SDRView shows that this CFTC report certainly has a broader reach than real time transaction reporting. Whilst SDRView obviously caps volumes for block trades, resulting in ~50% of total volume typically being above the block threshold, there are very few capped trades reported in XCCY swaps:
In Summary
- Overall CFTC data suggest 83% of all Interest Rate Derivatives are cleared.
- We can closely validate the cleared volumes for USD, EUR and GBP.
- 71% of notional outstanding in these three major currencies was cleared as at November 2021.
- There are a surprisingly large amount of vanilla USD IRS and OIS still left uncleared.
- We see a data discrepancy for JPY markets.
- However, the CFTC Swaps Report provides valuable and timely transparency into the uncleared volumes, such as Swaptions and Cross Currency Swaps.