- We estimate the size of uncleared derivatives markets in 2016
- We combine BIS Survey data with our own Clarus CCPView cleared data
- Vanilla Fixed-Float Interest Rate Swaps account for over $250bn in notional traded every day
- Despite Clearing Mandates in place, some portion of derivatives markets will remain uncleared
Uncleared Derivatives
A portion of the Interest Rate Derivatives market will always remain uncleared. This may result from legacy positions, exemptions from clearing mandates or from the trading of products that are not made available for clearing. It is also pretty likely that this area of the market will be more opaque in terms of volumes and price discovery than the cleared markets.
Combining Clarus data and the recent BIS Derivatives surveys, we can shed more light on volumes traded in Uncleared derivatives.
Understanding the Data
I recently explained the intricacies of the Trienniel and Semi-Annual survey data in a blog post. These are a natural resource for clients of ours to explore – they are wide-ranging surveys whose results are made freely available. There are even custom queries and an explorer tool to use.
We also first took a look at uncleared markets back in October. This resulted in a surprisingly large uncleared swap market in USD.
Today, we are going to refine that original estimate.
Key Concepts
Combining those two blogs leads us to the following key concepts:
- There is not a 100% overlap between SwapClear members (banks that are commonly considered as “dealers” in the Interest Rate Derivatives market) and those banks termed “Reporting Dealers” in the BIS surveys.
- The BIS survey “double counts” all Reporting Dealer cleared volumes vs a CCP when calculating Notional Outstanding.
- The Triennial Survey measures Turnover including inter-affiliate trades.
- The BIS use results of the Triennial Survey to scale-up the Semi-Annual surveys to better reflect the whole market.
Calibration Process
Of the 104 SwapClear members listed on their website, we can locate 84% of them in the list of BIS Reporting Dealers for the Semi-Annual surveys. On the whole, this means that if you were to double the “Dealer” Notional Outstanding amounts from our CCPView product, you would end up with a slightly smaller double-counted number than is necessary to exactly reconcile with the BIS. This is good news for two reasons:
- We can exactly calculate uncleared notional outstanding
- We can create an accurate single counted number for the entire market. This perfectly aligns with the Clarus data principles so suits us down to the ground.
It seems counter-intuitive, but in a single-counted world, this tells us that the first thing we need to do is throw-away the BIS data that is marked “vs Central Counterparties” – instead, we use our CCPView data.
Uncleared Volumes
We know that the BIS use the Triennial survey to calibrate results of the Semi-Annual survey. This gives us more confidence to go ahead and calibrate our own OTC Cleared data (CCPView) with the Uncleared data from the BIS. This allows us to produce a time-series of volumes since June 2016 for global uncleared derivatives activity according to the key principles above.
Let’s just look at Interest Rate Swaps from June 2016 on-wards. Our data shows the following Average Daily Volumes of Uncleared swaps by currency:
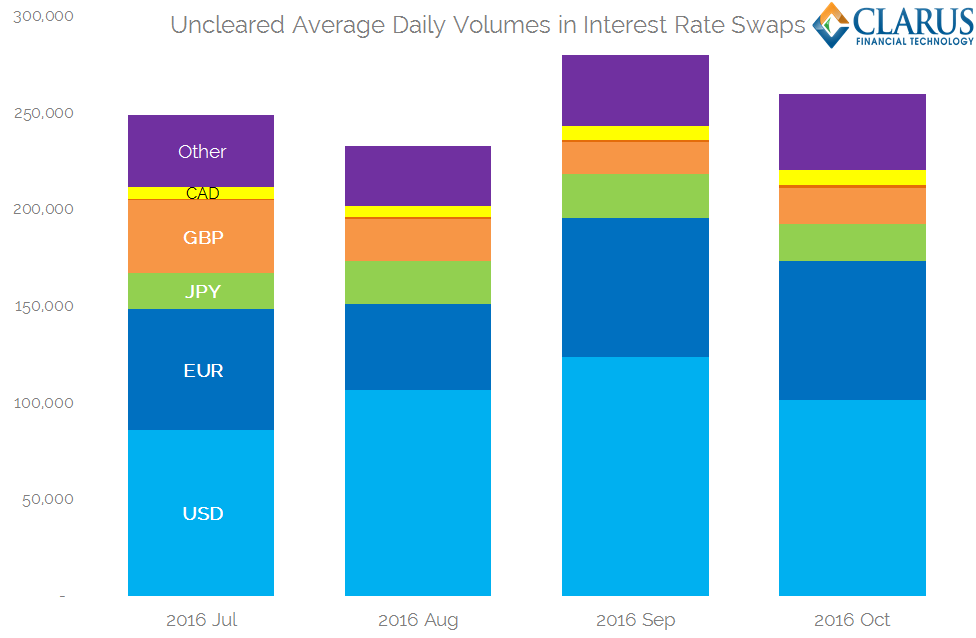
Showing;
- ADVs in Uncleared swaps have ranged from $246bn per day to $290bn per day in the past 4 months.
- USD is the largest uncleared market, despite a wide-ranging clearing mandate in place for the domestic market. Volumes have been as high as $123bn per day.
- EUR accounts for the second largest volumes, seeing an average daily volume of over $70bn in recent months.
- There is a sharp drop in activity after these two “major” currencies.
- “Other” currencies account for the next largest portion of volumes, between $30 and $40bn per day.
- GBP and JPY see similar uncleared volumes at around $20bn each per day.
These volume figures incorporate all Fixed-Float single currency vanilla interest rate swaps (including OIS and Basis, but excluding Inflation).
To put these figures into perspective, the Average Daily Volume of cleared USD swaps during the same time period was $412bn. This means that all uncleared interest rate swaps do not even make up the same notional as USD cleared swaps alone.
Tweaking the Calibration
These volume figures are calibrated using data from the semi-annual BIS derivatives survey. This is not ideal because even uncleared swaps will mature and (maybe) be compressed between surveys. However, we can re-calibrate once every six months, offering a fairly timely read on uncleared markets in parallel with cleared ones.
In Summary
- Despite new clearing mandates, some derivatives will remain uncleared.
- Our detailed analysis of BIS volumes allows us to calibrate a model to estimate uncleared derivative volumes on an on-going basis.
- We find that uncleared IRS trades over $250bn of notional per day.
- USD swaps make up the largest portion of uncleared trades.
- Remember to subscribe to get more updates on uncleared markets.