- SBSDRView from Clarus takes transaction level transparency data and makes it simple to use, aggregate and monitor.
- We look at the most active corporate names in single name CDS trading since records began.
- We find that a significant portion of activity in concentrated in the Top 10 names, with close to half of all volumes transacted versus the Top 50.
- The same names tend to consistently attract the most volumes.
- Contact us to find out more about SBSDR.
Regular readers will know that Amir and I are continuing to work on the SBSDR data, making the new data on single-name CDS and TRS as accessible and transparent as possible.
Most Actives
Amir developed the idea of monitoring the most active names in CDS in last week’s blog. Today, I want to put some perspective on that and look at three things:
- History – it is hard to look at new, novel data for the first time without some history.
- Trends – volume data is extremely useful for monitoring changes over time.
- Context – similar to above, volume data tends to need some context.
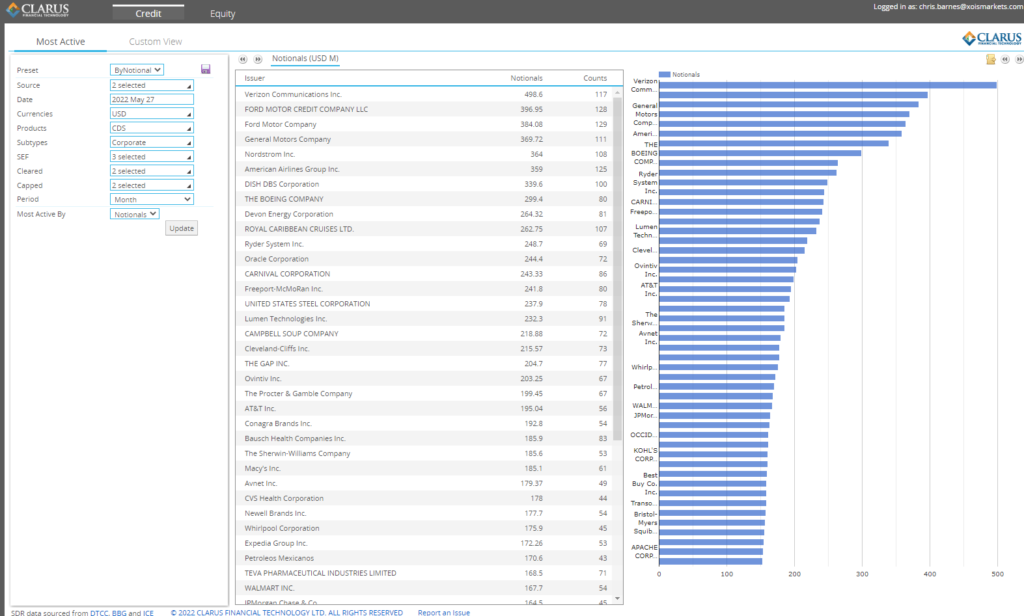
As a reminder, our newest data product, SBSDRView, now includes Most Active dashboards for CDS across both Sovereign and Corporate names:
History
First up, I want to monitor how Amir’s table of single name corporates has changed over time. I can run the same table on a monthly basis since SBSDR data was first published on February 14th, 2022 and track the changes.
For example:
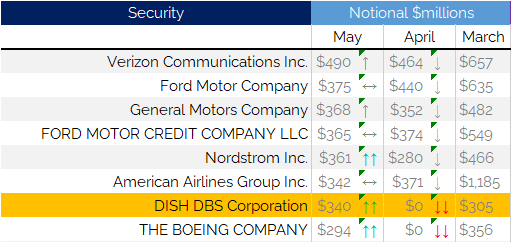
Looking at just the top 10 names shows that:
- Both DISH DBS and Boeing inexplicably dropped out of the top 50 names in April, despite both being significant volume contributors during March and May.
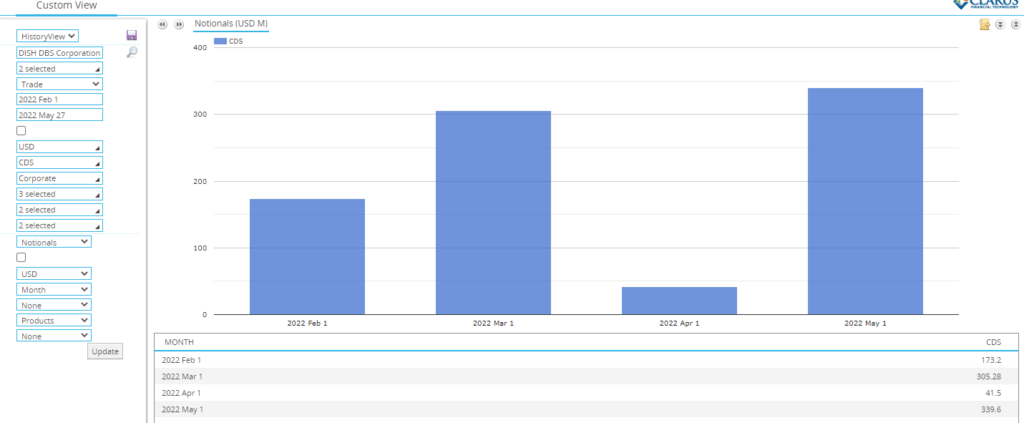
- Looking at DISH volumes, nothing obvious jumps out as to why this might be:
But almost the same pattern in volumes is repeated for Boeing, where volumes reported in April were down by about 90% compared to the surrounding months:
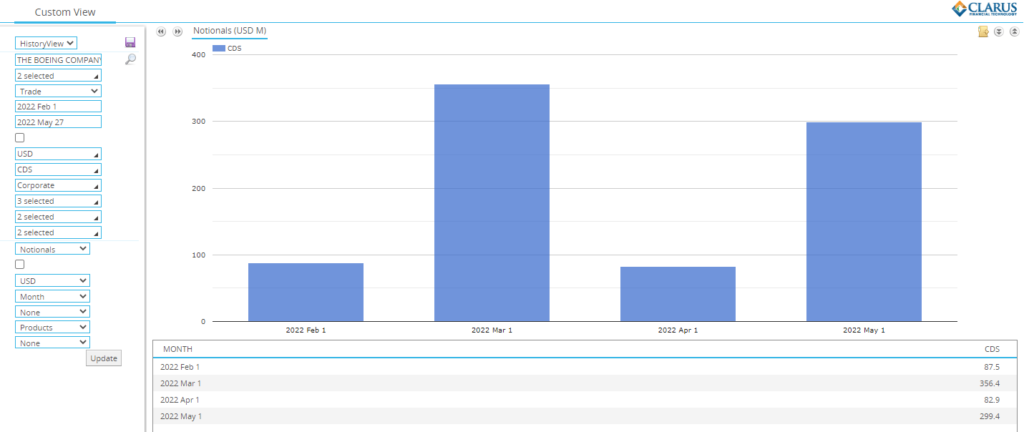
The same pattern is seen whether we look at trade count or notional amounts for both of these names. What would cause such a dip in volumes for a particular month? An interesting one to monitor to see if this behaviour repeats itself.
Trends
I also wanted to know how often the most active names change. Do they change every month? This isn’t easy to see, so I added a simple “Rank” to my table. This way, I can quickly identify which names have consistently been in the top 20 over the past 3 months:
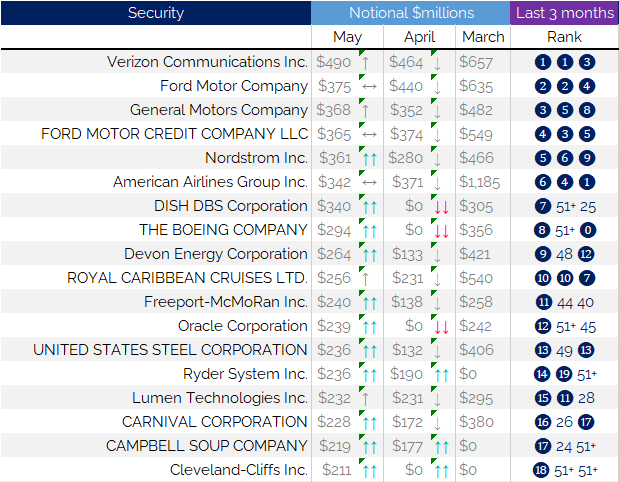
Showing;
- I think we can agree that the top 8 names tend to always be there!
- Verizon has ranked in the top 3 names since our records began.
- Ford has two entries – one for the manufacturer and one for the finance arm. I am a bit surprised we don’t see any other finance arms of the auto manufacturers in there?
- In fact, there are no other financial names at all, which also stands out to me.
As I have highlighted previously, March is a roll month for standardised CDS contracts. So we expect to see a spike in volumes each March (and September). Interesting to note that some names were not particularly active in this roll period, such as Ryder Systems or Lumen Tech. The aforementioned Dish has only recently become a top 20 name. Whilst the top 8 did not see a big change in their relative rankings during the roll, it was far more variable further down the list.
Context
Using a single call from our API I can calculate the total CDS volume traded each month. This monitors the percentage of overall volumes traded per name.
import clarus

response = clarus.sbsdr.volume(assetclass='CR', startdate='2022-03-01', enddate='2022-05-30', productType='CDS', productsubtype='Corporate', Currency='USD', display='NotionalUSD,count' )
print (response)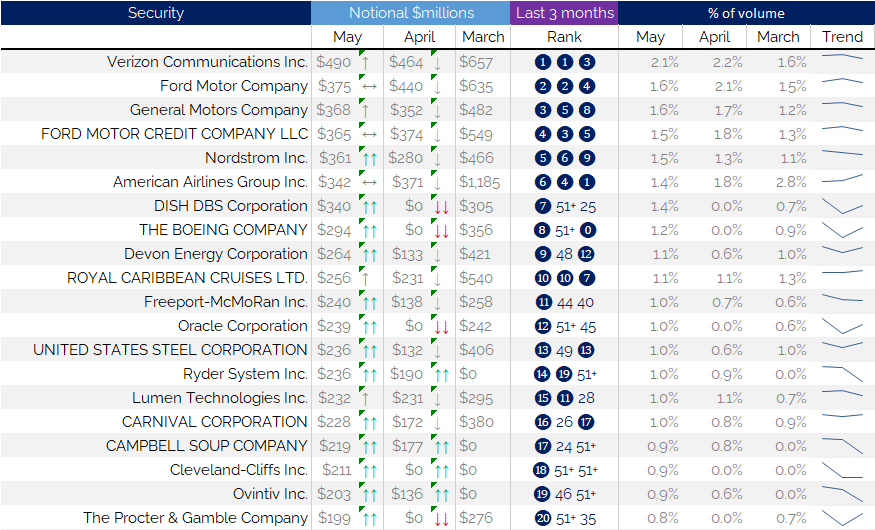
Rounding out the overall picture of activity:
- 2.1% of all volumes were transacted versus Verizon in May 2022.
- This is remarkably similar to April, when Verizon was also the most traded name.
- The largest slice of the market we have seen was during March, when American Airlines accounted for 2.8% of all trading activity. Easy to see why that reached a number 1 ranking in March. Volumes have since subsided.
- In fact, American Airlines is the only name to see more than $1bn in notional trade within a single month.
- The top 10 names in May have accounted for 14.6% of overall activity in single name, USD corporate CDS.
- The top 50 accounted for 44.6% of total activity in May.
Sovereigns
This analysis can also be repeated for sovereigns, which is likely to be even more concentrated. I toyed with the idea of also checking the HHI (Herfindahl–Hirschman index) to monitor the degree of concentration in the top names, but let’s leave that for another time.
In Summary
- This blog analyses the most active names in single name CDS trading using SBSDRView.
- The eight most active Corporate names have been relatively stable since reporting began.
- Activity is concentrated in the Top 10, accounting for ~15% of total volumes.
- The Top 50 names account for ~45% of activity.