In our latest data app, SBSDRView, we continue to interrogate the newly available transparency data from the SEC.
In my blog last week, I took a first look at Total Return Swaps.
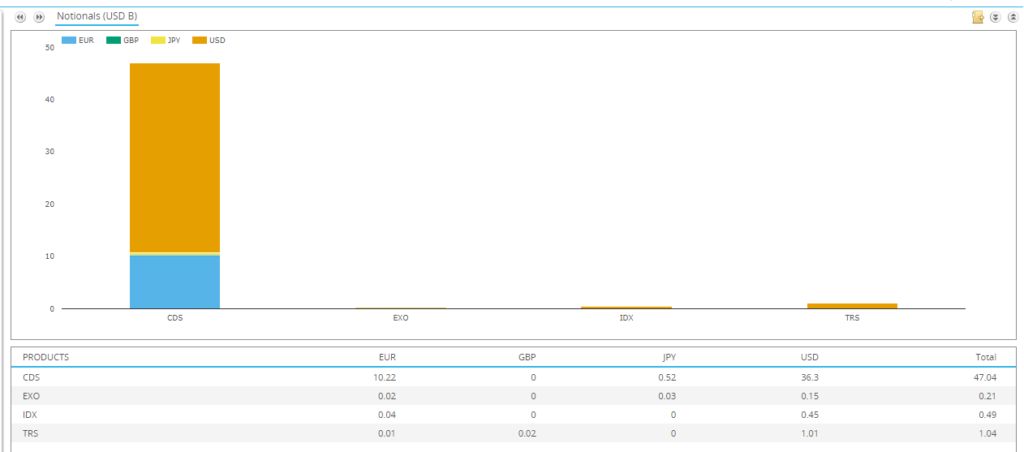
Now, let’s take a look at Credit – and specifically single name CDS. What are the most active securities being traded?
Using Our API
Why did I choose CDS? Pretty simple really – it is by far the largest portion of the new credit data, with nearly USD50bn traded in April 2022, across ~16,000 trades.
How does this compare to SDR data from the CFTC? In April 2022, for the 3 largest CDS Indices in USD (CDXIG, CDXHY and CDXEM) SDRView reports:
- $560bn in notional across the 3 major CDS indices.
- Across ~16,300 trades.
So we are dealing with a similar number of trades in SBSDRView, but spread across a lot more than 3 underlyings (like in SDRView). The vastly different notional cap thresholds also make a fair comparison of market sizing a bit tricky here. 36% of trades are reported at the capped notional amount in the new SEC data, compared to just 19% in the more mature CFTC data.
I can also use a single line of python to query where these CDS trades are being reported to:
import clarus

response = clarus.sbsdr.volume(assetclass='CR', producttype='CDS', group='source', display='Count, NotionalUSD',source='DTCC_SEC, ICE_SEC', startdate='2022-04-01',enddate='2022-04-30')
print (response)
And we see that the vast majority of single-name CDS are reported to the new SEC-registered DTCC SBSDR:
Source       Count          NotionalUSD
DTCC_SEC     14242    43664652474.24197
ICE_SEC       1484     3387903440.00325
Credit Data
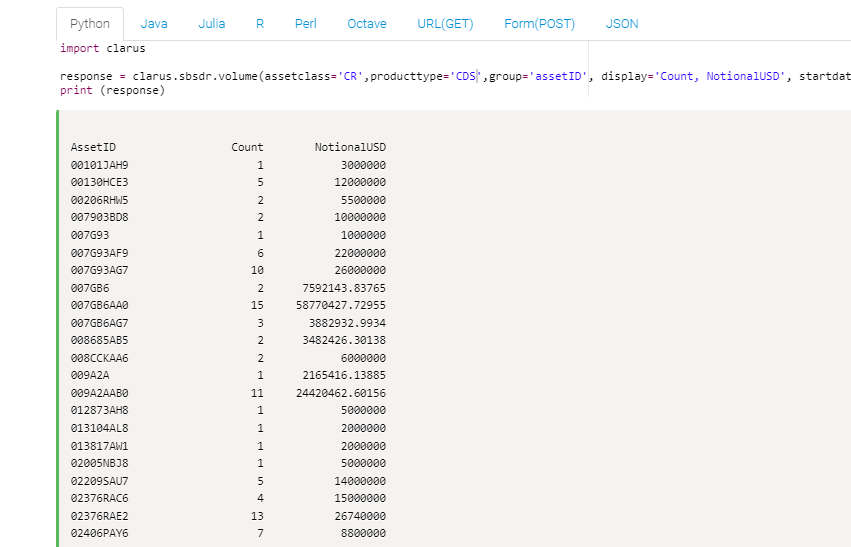
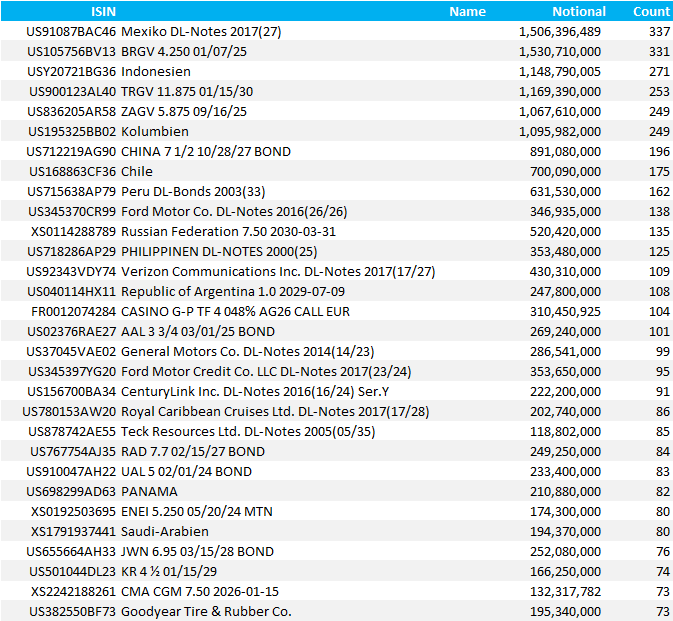
Turning to more trade-based analysis, if we run the analysis by AssetID, we see a whole host of underlying reference entities/securities:
For the purposes of understanding the CDS activity, there is now a bit of mapping work to do. As per the excellent Markit CDS Primer, all we really care about are the “Standard Reference Obligations” for a CDS:
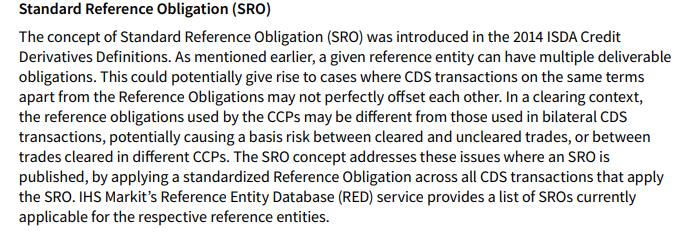
I believe this means that CDS, irrespective of tenor, will all tend to trade versus the same standardised ISIN. For this reason, we see CDS on tenors as long as 5 year or 10 year written against ISINs that otherwise reference bonds maturing before the CDS does. For example, looking at one of the most traded CDS reference entities, the Republic of Brazil, almost all contracts reference the ISIN “US105756BV13“:
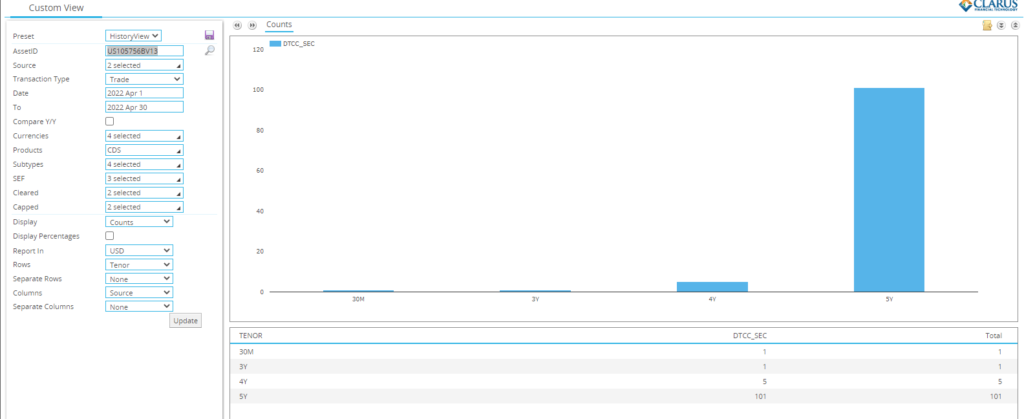
And despite this particular ISIN being related to a bond that matures on 7th January 2025 (i.e. in 3 years time), there are still CDS written as long as 5 years against it.
There is quite a bit of wood to chop to therefore map underlying ISINs (and REDs, CLIPs and maybe other identifiers) to an underlying Reference Entity to make sense of single name CDS data.
ISIN Data
With that stated, we do find that most CDS records are referencing the preferred “SRO”. Which is good. If we just take the raw ISIN data, it is therefore worth considering what the data is telling us:
- There were 2,416 unique AssetIDs reported in April 2022 as the underlying reference security on a single name CDS.
- This accounted for 14,663 CDS trades.
- However, there were not 2,416 unique securities, as some trade reports reference ISINs, others REDs, some CLIPs…you get the idea.
- I believe there were 1,464 unique ISINs referenced during April 2022 (using a simple cleansing/ISIN matching process).
- Many of these reference ISINs were traded only once during the month.
- In fact, 36% of the ISINs reported were traded only once!
- 13% of the ISINs reported were traded only twice.
As noted above, the ISIN tells only part of the story. The ISIN needs to be mapped to the underlying reference entity to get a proper sense of CDS activity. However, I am pretty confident that many of the single ISINs traded are also the only activity versus the underlying reference entity within the month as well. We will confirm this once the mapping work is complete.
Names, Names, Names
The data therefore lends itself to a “most active” summary, whereby all of the volume is concentrated in a small number of names. For example, there were only two ISINs that saw more than 300 trades in the month. And only 17 ISINs with more than 100 trades (in the DTCC data).
Showing;
- The United Mexican States was the most traded reference ISIN with 337 trades in April.
- This activity was closely match by the Government of Brazil with 331 trades.
Both of these names are clearable at ICE Clear Credit, therefore I can sanity check this new SBSDR data versus our CCPView data for ICE. From CCPView, for April 2022 we saw the following cleared activity at ICE:
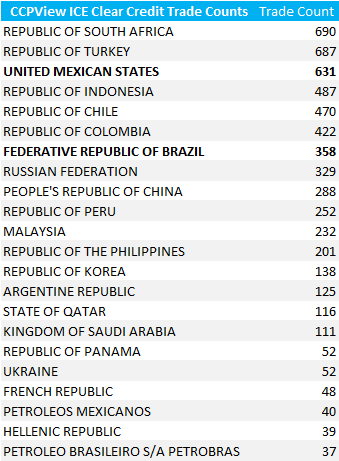
This cross-check against the global cleared market therefore shows:
- SEC data is only from US persons, very similar to CFTC data. We therefore do not see the whole of the global market.
- At this first pass, European names appear to be under-represented in the SEC data set compared to the ICE clearing activity.
- We saw 331 trades versus Brazil in the SEC data. ICE saw 358 trades cleared versus the same reference entity. The SEC data includes both Cleared and Uncleared trades, therefore let’s take a look at the Clearing status of these Brazil trades….
Security Look-Ups
We can now interrogate our SBSDR data using almost any security identifier. Looking at the ISIN-specific analysis for the Brazil data…
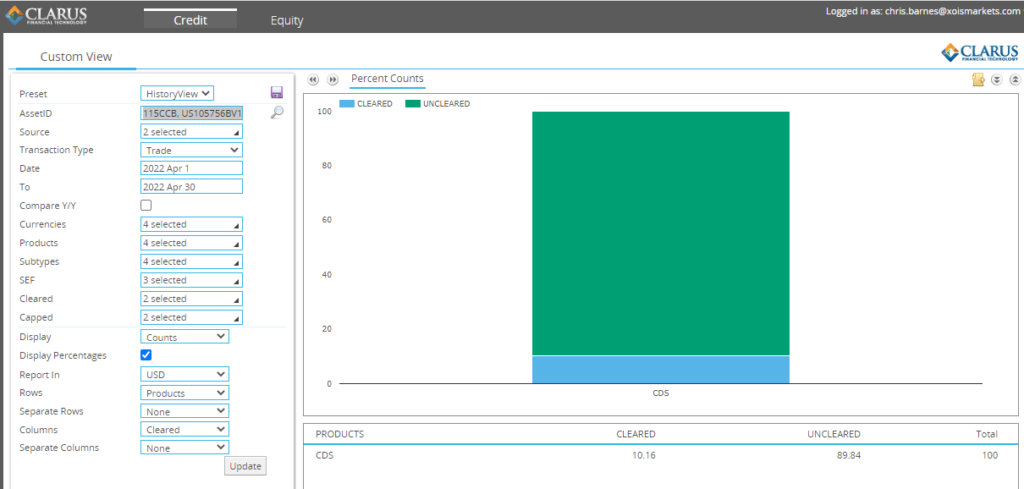
…we see that only ~10% of all trades versus Brazil are being reported as Cleared. This is very unlikely and suggests we still have teething problems on the reporting side of trades. Something that we are sure will be followed up on very quickly.
Most Actives
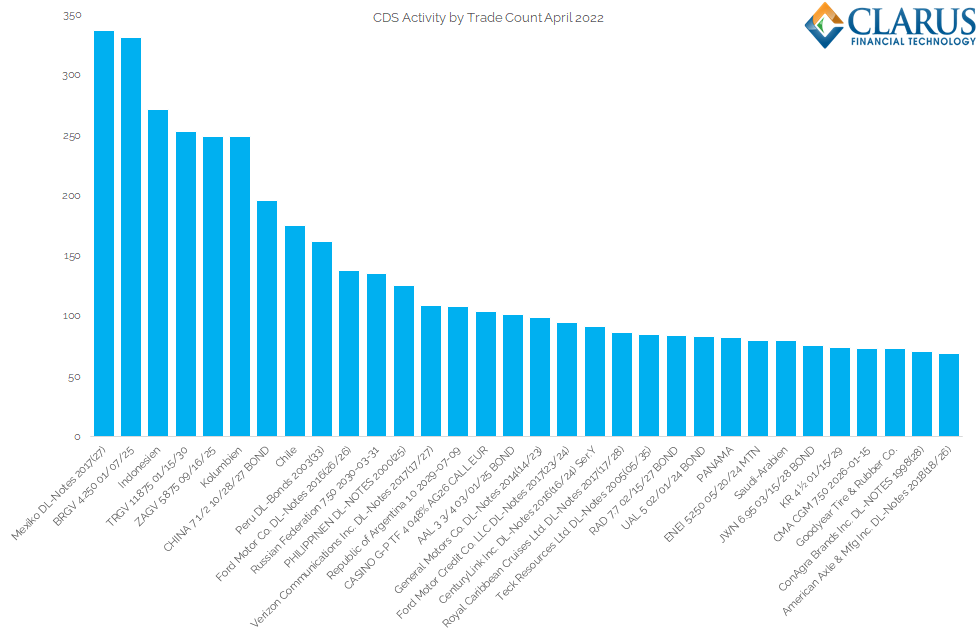
That brings me to the final analysis – what were the most active CDS names in the month of April 2022?
Showing;
- A list of most active “SROs” in April 2022 as reported to SBSDRs.
- There is only one corporate single name CDS in the top 10 most active by trade count. The rest are all single name sovereign CDS.
- Some of the human readable names need work. If I point out that “BRGV” is the Brazilian Republic, and that “ZAGV” is the Republic of South Africa, hopefully the naming convention for others is pretty self-evident.
- It is interesting that two entities of Ford show up here – one I guess related to the motor company, and one to the finance company? Something to investigate further, but then we are really into the weeds of Reference Entity mapping – a little outside of the scope for this blog.
The main reason I wanted to arrive at this table is to put a marker in the sand. When we come to repeat this analysis at the end of May 2022, I am willing to bet that this table of most actives will be pretty stable. The interesting part will be picking out the names that appear for the first time, and those that have dropped off etc.
Something well worth monitoring in our latest data tool, SBSDRView. Contact us for trial access now.
In Summary
- Single name CDS transaction data is now available, adding much needed transparency to OTC derivative markets.
- This is a rich data set that needs to be standardised and curated to help make sense of it.
- We provide a first pass of the most active names in CDS.
- Single-name sovereigns tend to be the most active single name CDS contracts, with trading related to corporate entities relatively less active.
- We expect market participants to regularly monitor this list of most active names, tracking the data.
- This will further enhance transparency in CDS markets.