We take a look at Eonia invoice swaps, which match the dates for German bond futures traded at Eurex:
- From volume data, we see an increase in Eonia swap activity post-QE.
- The price action in Schatz appears closely related to short-end Eonia swaps, whilst in Bobls and Bunds it is harder to pin-down.
- The appearance of trades with upfront fees suggests that Invoice Spreads are increasingly popular with end-users, probably to hedge financing costs for bond positions.
- We ask whether the Invoice Spread is now therefore a better proxy for true financing costs than the post-GFC fixation with Libor-OIS spreads.
I find this hard to believe, but it’s been over a year since we last took a glance at EUR OIS (EONIA) volumes and price action in the SDR data. A lot has happened in that year – namely, the introduction of QE by the ECB. How has this affected the market?
To start, it’s worth getting an idea of which structures actually trade in the Eonia markets. Therefore, please take a quick look at a previous blog.
In a nutshell, we see most Eonia trades occurring in Eurex-dated invoice spreads. Our conclusion last year was that dealers like to trade their Schatz, Bobl and Bund futures positions versus the Eonia curve. It seemed a little esoteric, driven more by market structure than anything meaningful in terms of economics or flow, but such are our modern-day markets.
When we look at the data today, we see less evidence that these Invoice Spreads are solely the purview of the dealer-to-dealer markets. There are more structures now that look like end-user swaps.
A year’s worth of data to play with
Last time we looked at the data, we focussed on data within the month, to look at market perceptions heading into a pivotal ECB meeting. Nowadays, we have a much longer time-series of data that is much easier to interrogate. And, arguably, less interesting ECB meetings now that policy is to be maintained until September 2016.
But our ever-increasing amount of data helps us to answer the big questions over a period of time – namely, what has been the impact of ECB QE on markets?
Volumes
First of all, let’s take a look at what has traded in Eonia invoice spreads:
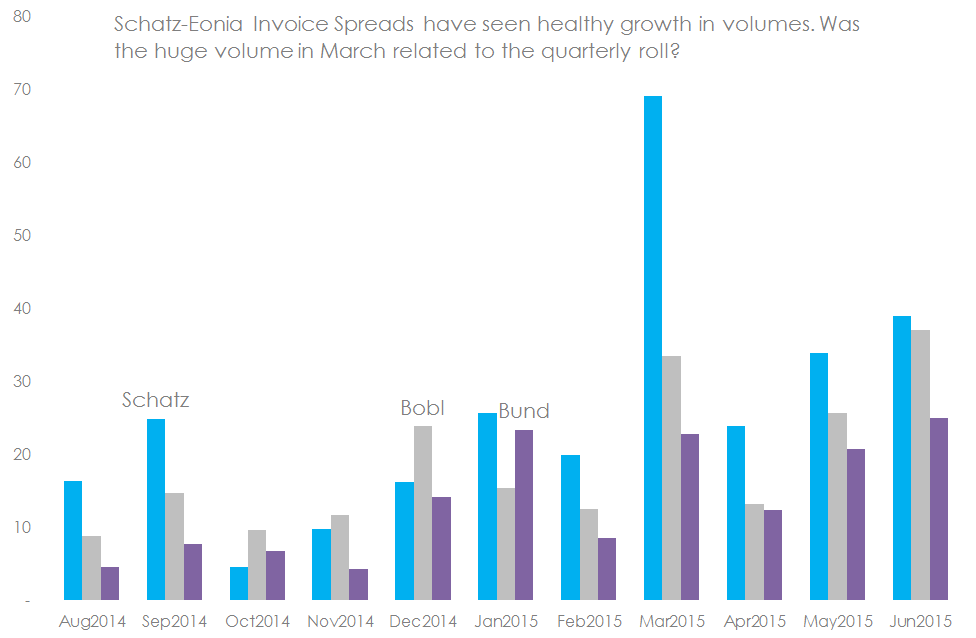
The chart shows that:
- In notional terms, Schatz volumes dominate – hardly surprising, given their short-dated nature.
- Volumes have generally been on the rise, most notably in Schatz and Bobl.
- Remember that these are swaps related to the Eurex quarterly German bond futures, therefore the quarterly spikes in volume are expected, due to contract rolls. Nonetheless, the amount of activity in Schatz during March was (nearly) off-the-charts, and was not replicated in June during the latest contract roll.
- If we were to look at the same chart in DV01 terms, we would see that the largest amount of risk each month tends to trade in the Bund contract.
And what of price activity? Let’s drill down into this a little more.
VWAPs
Given that these contracts are for fixed dates, it makes a lot of sense to compare the evolution of the monthly volume weighted average prices (VWAP) over the past year. We take the average of all contracts traded during each month in order to minimise roll effects.
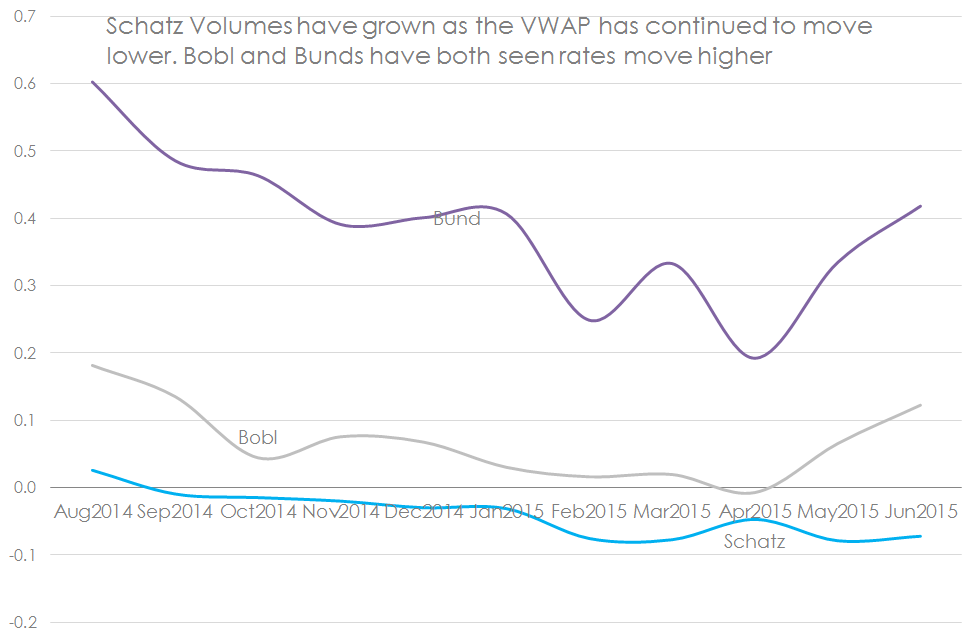
Showing:
- A big move lower in Bund rates, as we are well aware from general QE-related moves. This has since rebounded.
- Schatz yields have followed a very different path, with a steady trend towards lower (more negative) yields.
And what has been the big driver in the fall in Schatz yields? Let’s look at the short-end of the curve for some hints.
ECB-dated Eonia
One of the more precise ways of trading monetary policy changes is to trade the exact maintenance period between ECB meeting dates. We can look at the data over the past year and see how volumes and price changes have evolved for a generic 1st ECB contract – i.e. a rolling time-series for the next ECB meeting. We’ll use a candle chart as per our previous blog on price indicators.
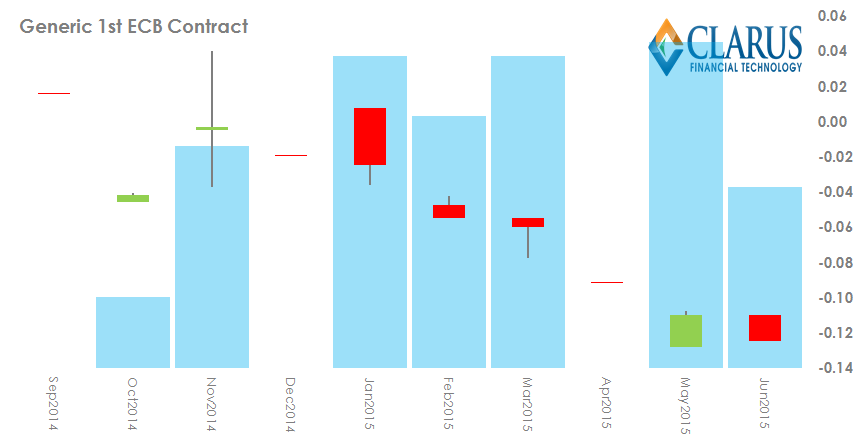
Showing:
- A consistent fall in prices during 2015, apart from during May (which also saw the largest volumes).
- Liquidity constraints are apparent, with no trades recorded during some months.
- Generally disappointing volumes, averaging €17bn per month versus €25bn for Schatz. Remember that these ECB dated contracts have a maturity of just six weeks, therefore are much smaller in duration than the Schatz contract.
- The reduction in yields is significant in such a low yield environment. The peak to trough is approximately 14bp.
Short-End Rates & Schatz
The 14bp move in ECB-dated Eonia is almost exactly mirrored by the generic 1st Schatz contract as well. But the timing was completely different. If we take the generic front Schatz, it has seen a 13.25bp reduction in yield over our observation window:
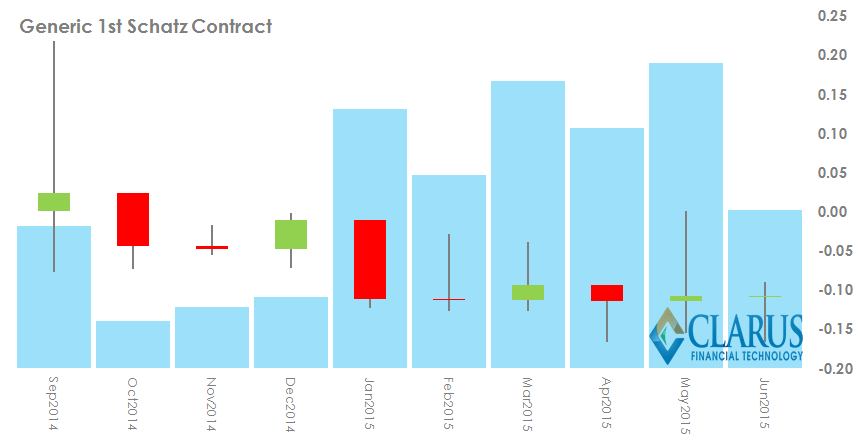
Showing:
- A sharp increase in volumes post QE announcement in January.
- A downward trend since January, although price levels do seem pretty stable since January’s big move.
- A limited impact (post January) from the big move lower in the front ECB contract.
This last point might sound surprising after the sustained move lower in the front ECB contract. We need to consider that the Schatz is a forward starting contract, up to 3 months in some cases. Therefore the move lower in the ECB contract from January to March would all have been captured in the March Schatz contract during January. Prices in Schatz have been more stable recently and this is also reflected in prices for ECB contracts, which flat-lined between -12.5 and -13bp as at end of June closing levels.
In Summary
- The data shows that the QE announcement by the ECB led to an increase in OIS volumes being traded during 2015.
- There was exceptionally large activity in the Schatz dated contract during March 2015.
- Volumes in ECB-dated Eonia swaps have been generally disappointing, but were markedly higher in 1H15 than Q314.
- Short-dated Eonia swaps have consistently moved lower in yield throughout 2015.
- Schatz-dated Eonia swaps are also at or approaching all-time lows as at end of June 2015.
- The price-action in Bund and Bobl-dated swaps is far harder to pin down. So we will leave their respective candle charts below for our users to mull over themselves. Feel free to leave us any comments below.
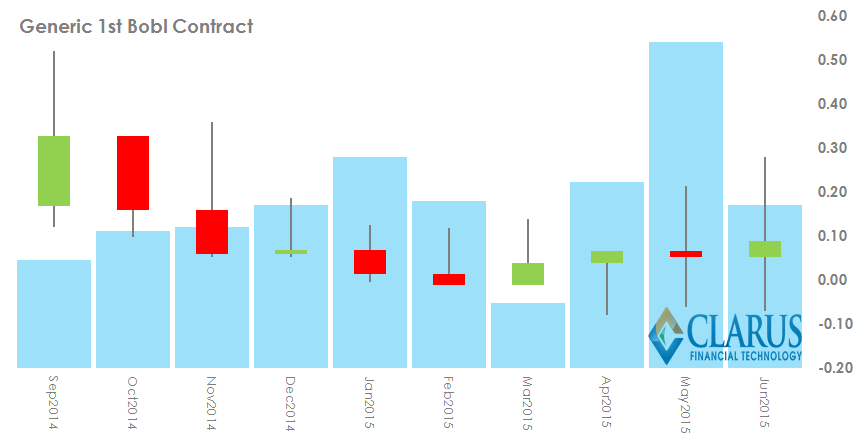
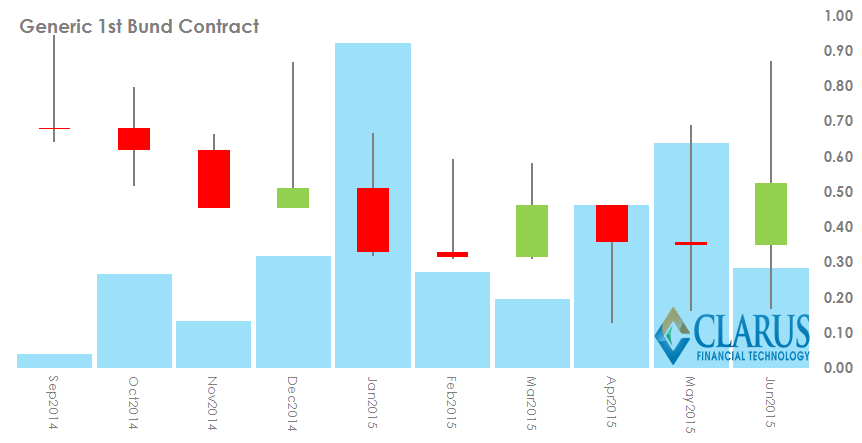
Whilst the price action for Bobls and Bunds is difficult to ascertain from those charts, they did yield a couple of observations regarding market structure:
- The long wicks are, unfortunately, down to poor data reporting rather than real price action. Some trades are clearly missing upfront fees.
- However, the high number of trades that do include upfront fees suggest that these type of trades are not simply limited to the dealer-to-dealer market.
- The Eurex versus Eonia invoice spreads therefore appear popular packages for end-users to trade – either as a straight hedge or, more likely, a proxy hedge to the financing of bond positions.
This last point can be seen when we analyse trade counts of invoice spreads. Trades with upfront fees are becoming more and more common in the data:
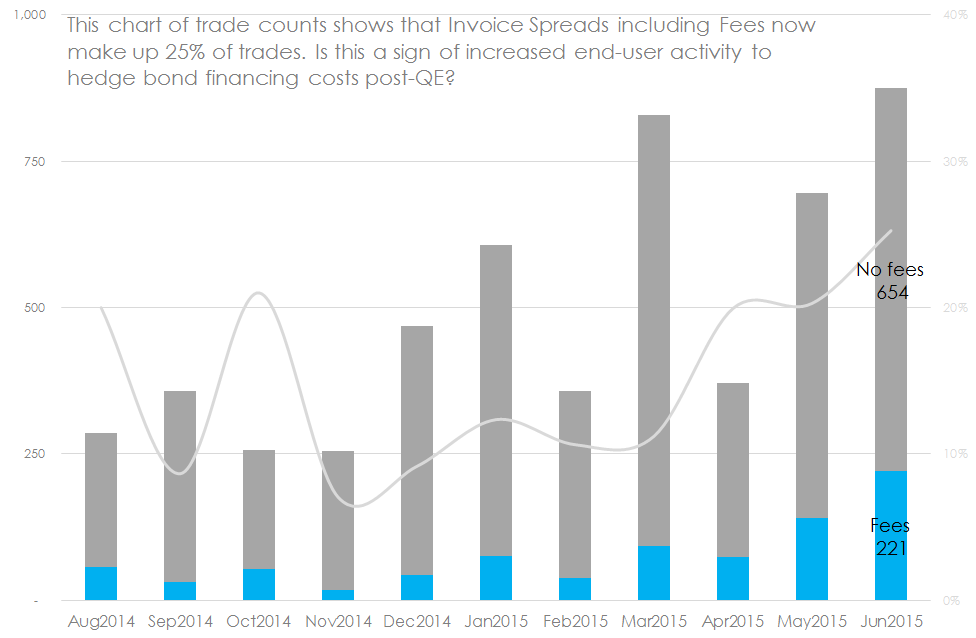
As the chart says, invoice spreads with fees now make-up over 25% of all invoice spreads versus Eonia. It’s a fair bet that this represents increased end-user demand for these types of swap. Equally, it’s a fair bet that these end-users are using these swaps to hedge their bond-financing costs.
This raises two questions that I will leave unanswered. Comments freely welcomed!
- Does this suggest that the Invoice Spreads versus OIS are a more relevant guide to true financing costs (in Europe) than the Libor-OIS spread that we have spent so much time focussing on since the GFC?
- Why has the advent of QE in Europe led to an increase in end-user demand for these types of swap? From this limited analysis we cannot say that the correlation implies causation. That seems like a question for another day…