- We look at trade count data in the SDRs for Interest Rate Swaps in the major currencies
- There is evidence of reduced customer activity in large notional trades
- And a decrease in average trade size
- This is offset with an increase in Compression activity
- Those market trends are not very friendly towards traders trying to make money out of flow business
- With that kind of market backdrop, we can expect more focus on MVA and FVA.
After a long weekend, what better way to ease yourself back into the working week than a fresh look at SDR data?
Swap Market Trade Counts
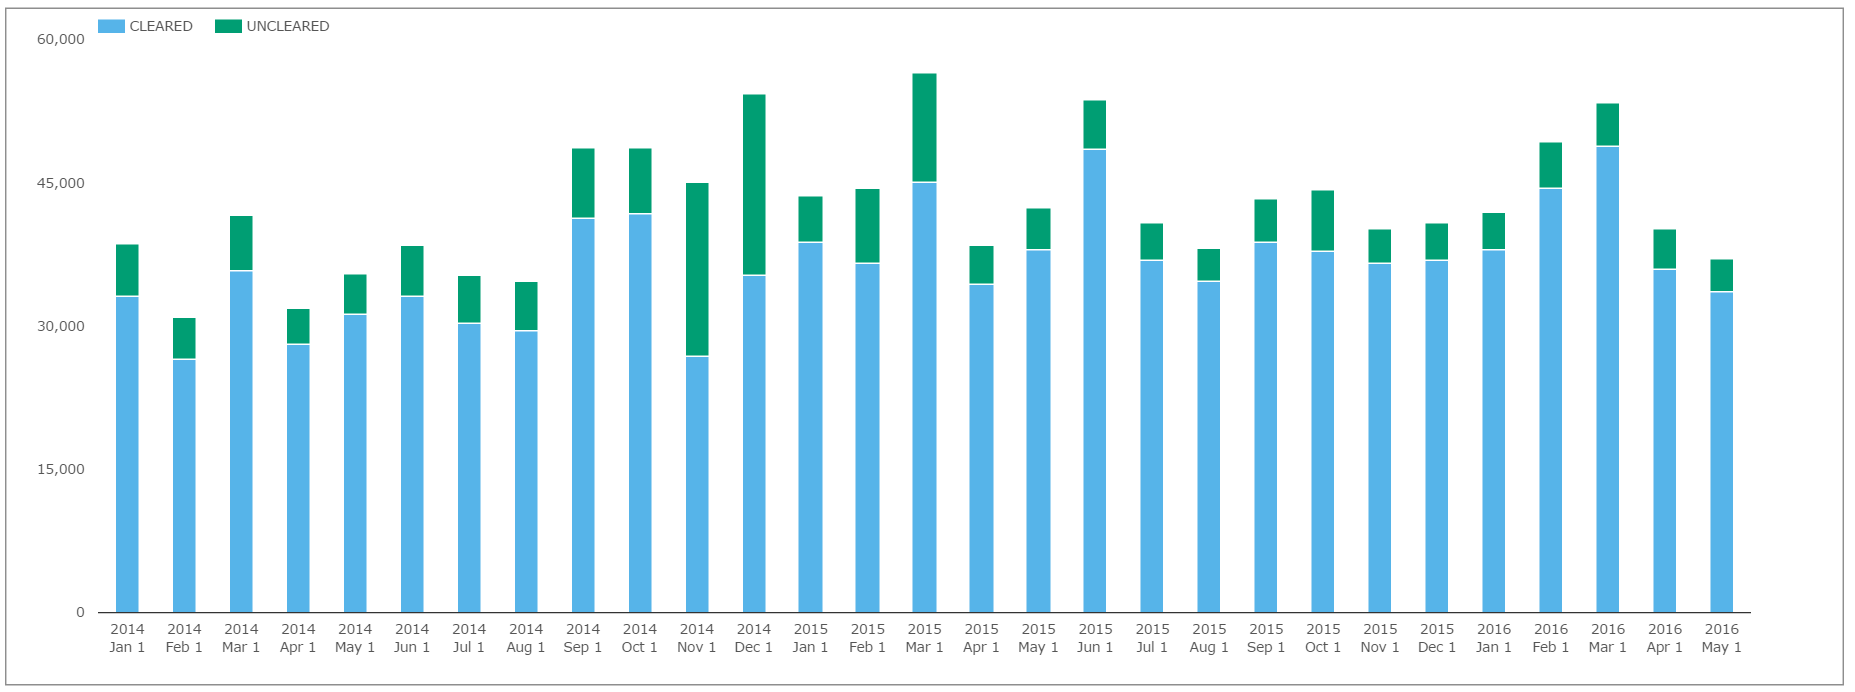
As the chart shows, the vast majority (over 90% in 2016) are cleared trades.
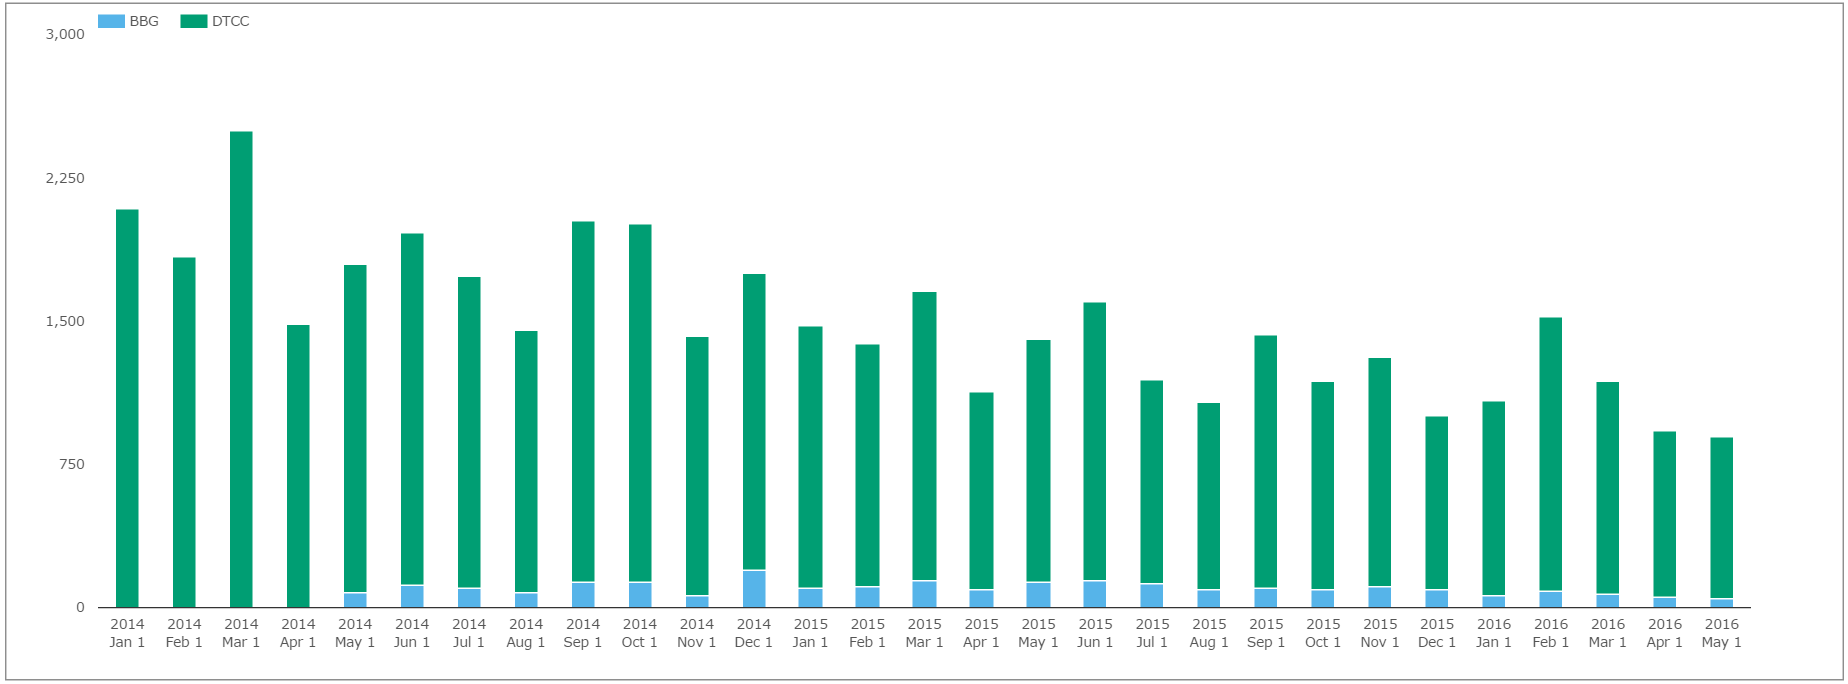
We can also see a recent move towards fewer trades each month, rather than more. This decrease in the number of trades is most noticeable in large notional “block” trades that are transacted across D2C SEFs:
(For a reminder about why we know that these are transacted on the D2C SEFs, please check my blog for all the gory details on No-Action Relief Letter (14-118) and RFQ vs CLOB execution).
In summary, the chart shows:
- Block trades transacted on BSEF in blue. In May 2016, there have only been 44 of these trades across all USD, EUR, GBP and JPY IRS.
- The Tradeweb SEF sees a lot more of this activity (assuming that all of the Block trades reported to the DTCC SDR are done on TW, which seems fair).
- Both venues have seen a significant fall in the number of these trades. This probably represents reduced demand from end-users for large-size transactions.
Now, maybe this isn’t such bad news for BSEF in particular. They charge a flat fee per trade (with no minimum trade size), much as Tod explained with their SDR pricing model. They are therefore motivated to simply trade more tickets, not necessarily more size. This strategy seemed to be working well for them. Recently, however, their overall trade numbers are also in decline:
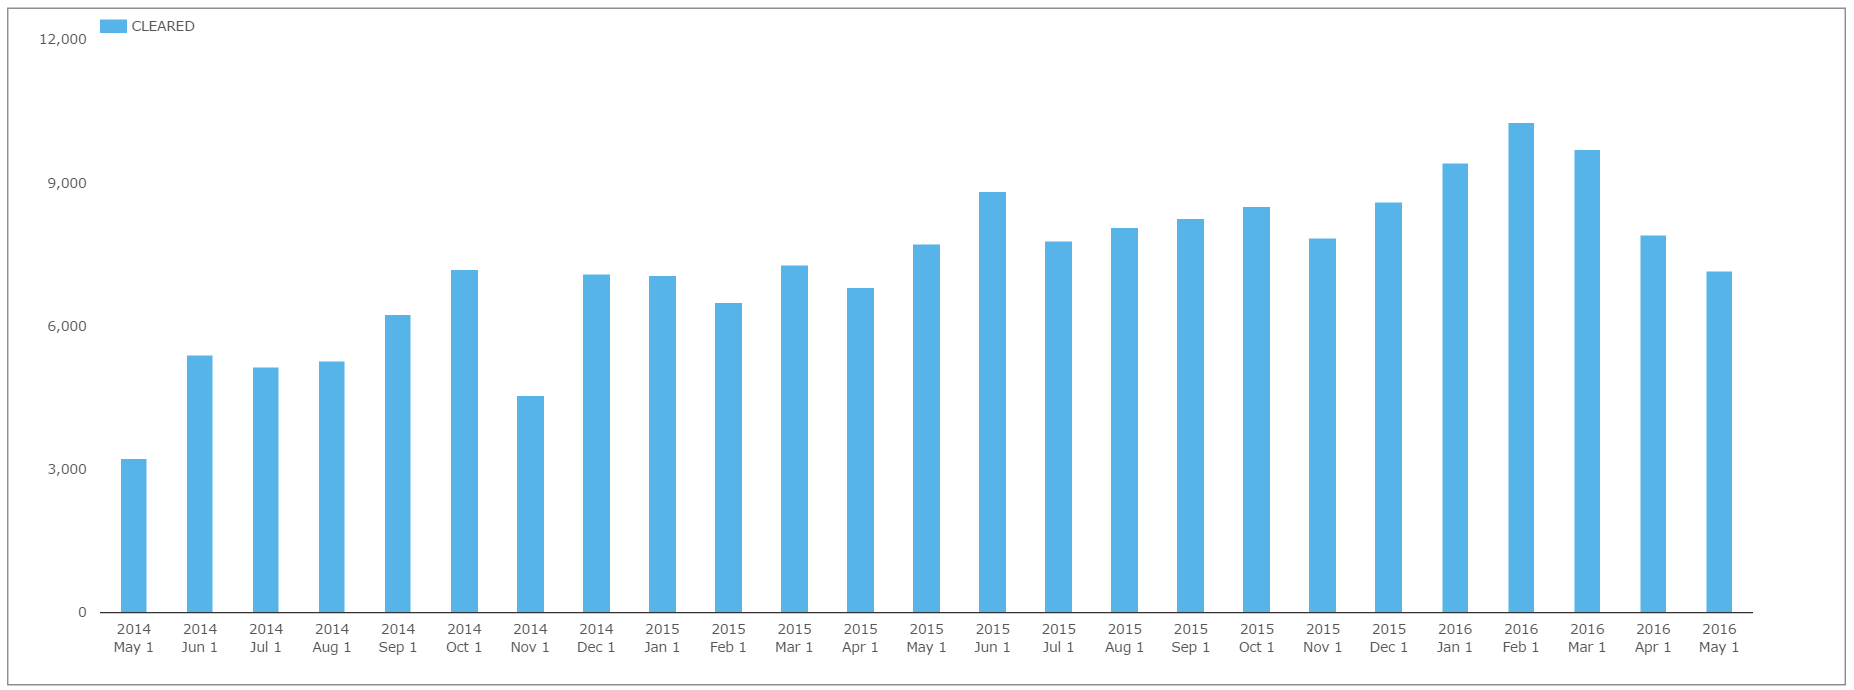
Showing;
- The number of trades in a single month on BSEF (in IRS) peaked in February this year – at over 10,000.
- This has tailed-off since.
- Nonetheless, with many IDB SEFs employing some sort of minimum trade size, Bloomberg is a convenient platform for market participants to tidy up smaller positions.
Are trade numbers increasing anywhere?
Regular readers will not be surprised to learn that it is Riskless transactions that are seeing growth in their trade numbers, even as the overall number of trades decreases. To recap, we count Riskless transactions as:
- Compression (trading equal and opposite cleared trades to offset existing positions, often in a risk-neutral package)
- List (unwinding uncleared trades, often in a risk-neutral package)
- Roll (moving positions from one IMM date to another)
The chart below shows their impressive growth:
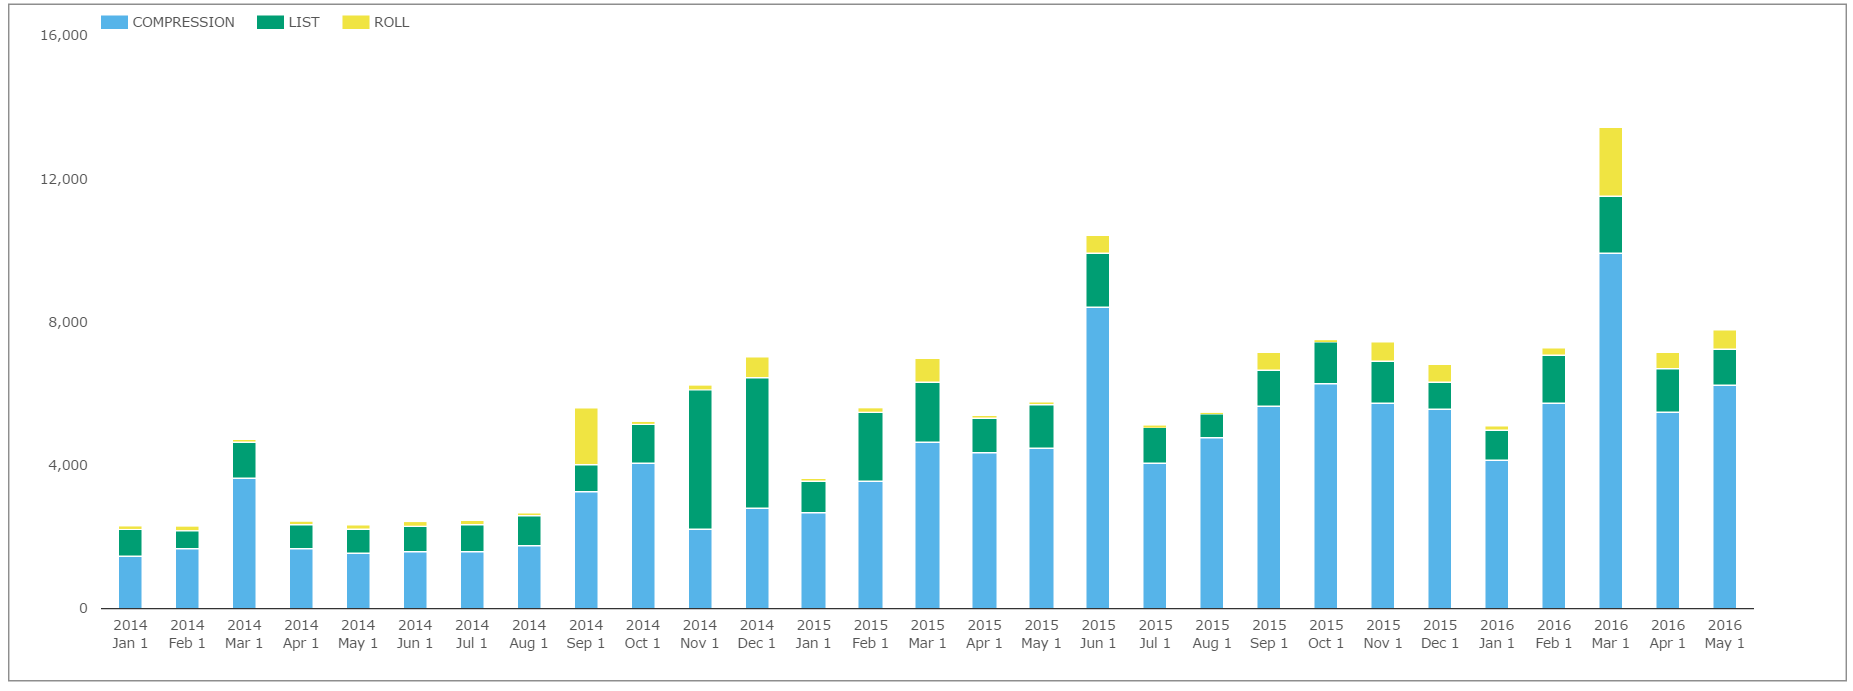
Showing;
- Over 6,500 riskless trades consistently take place each month
- May 2016 (so far…) has seen the highest number yet of these trades outside of an IMM month (7,371)
- This growth in riskless transactions far offsets any decrease we’ve seen in block trading D2C activity. So the outlook for the D2C SEFs remains pretty rosy.
It’s tempting to think that some of the reduction in block activity on D2C SEFs has been captured by these new Compression services – are customers simply unwinding large trades in a different manner? To test this, I ran a query across the Clarus data for all types of Package (see below) and filtered out just the Block activity. However, this query showed a sustained drop in all types of Block activity, Compression included.
The data therefore strongly suggests that customer activity in large-size trades has reduced since 2014.
Winners and Losers
From analysing trade numbers alone, we are therefore seeing a small decrease in the number of tickets traded each month, with a more noticeable drop in the number of large-sized trades by end users. On the flip-side, there has been a marked increase in Compression activity.
That fits nicely with current Swaps market narratives:
- Liquidity is hard-to-come-by, particularly for big trades. This appears to be the case even if you are a customer.
- There is a focus on trimming costs. Compression typically reduces the Clearing costs across the life-cycle of a cleared transaction.
Below, I continue to analyse the trade count data, this time by trade type.
Trades by Package Type
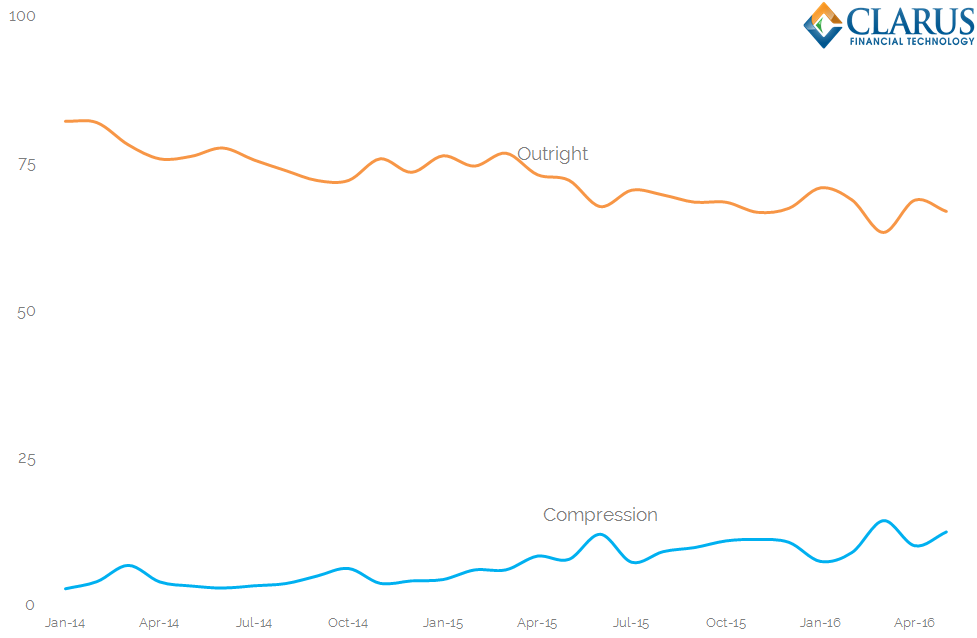
Showing;
- As a reminder, we split the SDR trades into Outrights, Spreadovers, Curve, Butterfly, Compression, List and Roll Package types.
- Outright trades and Compression trades are the only package types to see a change in their frequency of trading.
- Back in 2014, Outrights made up 82% of all trading. This was their high watermark.
- In comparison, Compression had not caught on.
- Fast forward to today, and the trend has been consistent.
- Outright trading now makes up only 67% of trading (close to the lows).
- Whilst Compression activity makes up 12.5% (close to the highs).
- The remaining 20% of the market is made up of (in decreasing size order) Curve, Spreadovers, Butterfly, List and Roll package trades.
The data suggests that not as much risky trading is happening nowadays. With the advent of a clearing mandate, managing a cleared portfolio and keeping a handle on the costs is becoming more and more important.
Trades by Subtype
Let’s also check to see if the market is changing the mix between Spot-starting, forward- and backward-starting swaps.
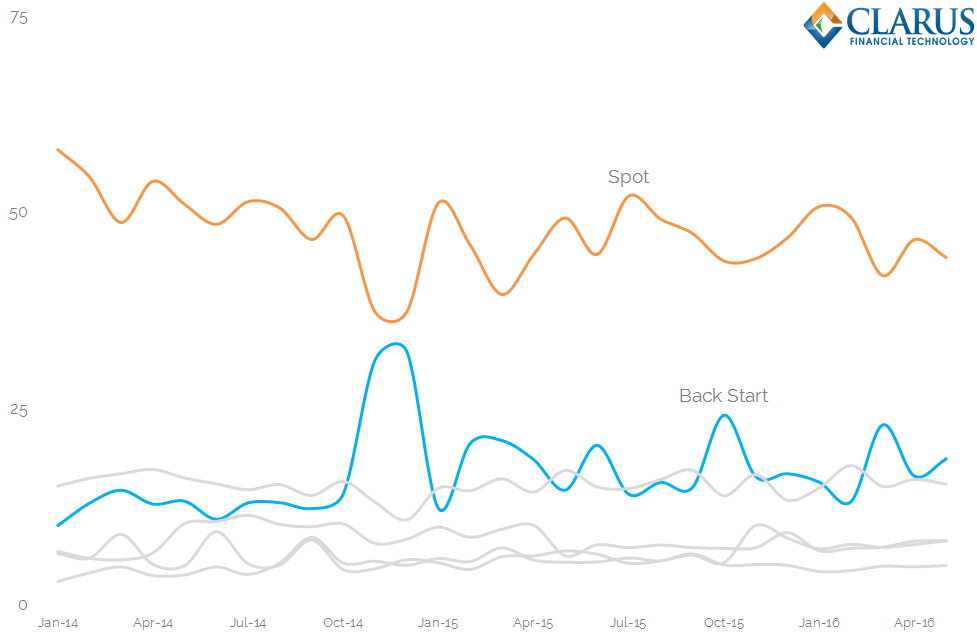
Showing;
- Monthly trade counts split by percentage of trade type – Spot Starting, Forward Starting, IMM, MAC, Non Standard and Back Starting.
- The graph largely corroborates our previous findings.
- Spot starting swaps used to represent over 55% of all trades reported to SDRs.
- This has now dropped to just 44%. This is consistent with a drop in outright trading.
- (It is important to note that this hasn’t negatively impacted the uptake of SEF trading. Across the same period, the percentage of trades occurring on-SEF has still increased. On-SEF trading now stands at 55% across the whole market).
- Back starting trades have nearly doubled from 10% to 19%. This is consistent with an uptick in Compression activity, as these will (typically) be old trades. 31% of these back-starting trades occurred on-SEF during May 2016.
- Other trade types have been fairly consistent.
Average Trade Sizes over time
To tie-in with my last blog on average trade sizes, I also ran the above charts by Trade Notional and Trade DV01. The charts looked pretty similar, hence I expected to see stable average trade sizes over time. That would tie-in with another blog, when I looked at average trade sizes for USD benchmark swap maturities, which we found remarkably stable. But is that fair to say for the markets as a whole? Probably not.


Showing;
- Outright trades had an average size of $40,000 DV01 back in January 2014
- This has slowly shrunk to stand at $33,000 today – 18% smaller.
- The average trade size across all package types has not shrunk by so much – only 12% smaller.
- It is difficult to detect any clear trends in the other data series. Have a click on the graph yourself to play around with the data.
In Summary
- The data suggests there are fewer large notional trades being transacted by end users
- There has also been a decrease in average trade size since 2014….
- …but a sharp increase in Compression activity.
- This paints a picture of a Swaps market focused on trimming costs associated with legacy positions.
- That makes it much harder for a Swaps dealer to make money.
- In that kind of market, expect traders to more accurately assess the MVA and FVA impacts across their portfolios.