While it all began many years ago with Credit Valuation Adjustment (CVA), a number of new XVAs have risen to prominence in the last few years such as DVA, FVA, MVA, KVA. Chris wrote about Funding Valuation Adjustment (FVA) last week, so today I will look at Margin Valuation Adjustment (MVA).
Background
MVA arises when Initial Margin (IM) is required on a Derivatives trade, the prime example being Cleared Swaps and is an adjustment for the funding cost of IM. From September 2016, IM for Bilateral (UnCleared) OTC Derivatives will also be required for new trades between some firms and these will also need MVA.
IM is charged on a portfolio and a new trades impact on IM is not as simple as calculating its IM in isolation and adding to the portfolios IM; instead it requires the portfolio to be re-assessed with the new trade included. Further we are not just interested in the IM today but the impact on IM over the life of the trade; meaning we have to age the trade and project value forward in time; resulting in a computationally expensive process. (For those of you familiar with Potential Future Exposure or CVA, this will sound familiar).
Theory and Maths
There are a number of good papers with the theory, a few that I would recommend are Andrew Green and Chris Kenyon, KVA and MVA by Andrew Green and Andersen, Duffie and Song. Even if like me, your maths and calculus is a dim and distant memory, it is worth scanning these for some very interesting insights.
There are also a couple of Wiley books, XVA:Credit, Funding and Capital Adjustments by Andrew Green and Margin and Capital Value Adjustments by John Gregory, which while I have not read them, I expect they provide good depth and coverage.
For the remainder of this article I will concentrate on the numbers and a user’s view.
MVA – USD IRS 10Y
Lets start with an example trade, a USD Swap 10Y 100m Rec Fixed at par (1.7%) and assume a Funding Spread of 50 bps over the risk free OIS rate.
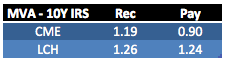
Using CHARM we can calculate the MVA assuming CME or LCH Cleared.
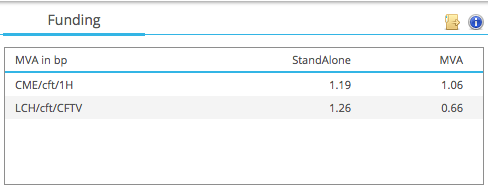
Showing that:
- CME Cleared, the Standalone MVA is 1.19 bps
- LCH Cleared, the Standalone MVA is 1.26 bps
- The MVA column shows the impact on the portfolio (more on these later).
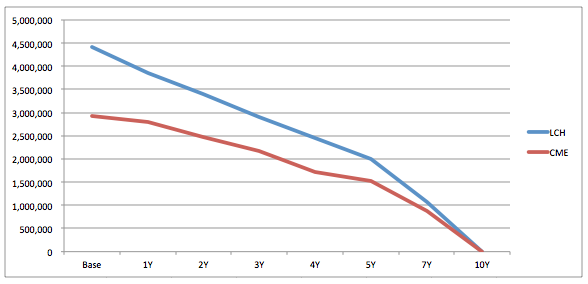
If we graph the IM over time for each of these, we get the following:
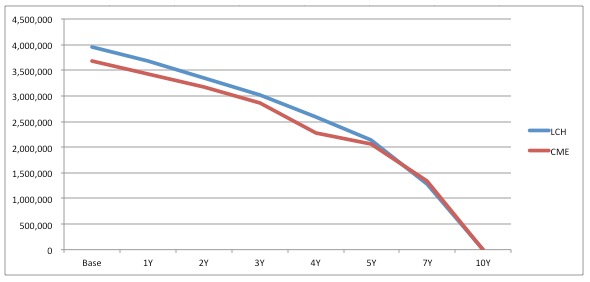
Showing the Base IM of the trade, $4m for LCH and $3.7m for CME and this IM re-calculated at annual tenors out to the 10Y maturity. So as we age the trade forward in time, it becomes a 9Y, 8Y, 7Y etc. and has less future cashflows and so lower MTM variance, resulting in less risk and lower IM.
Lets now switch our Rec Fixed to a Pay Fixed trade and use the CHARM API.
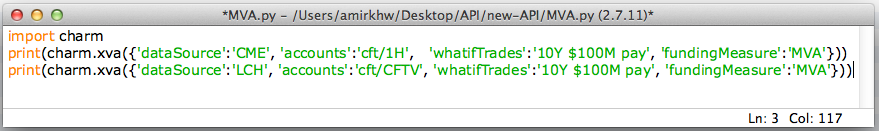
Three lines of Python, thats all you need for all those computationally expensive simulations.
Even I can write that code!
And quicker than the blink of an eye, in 90 milli-seconds, we have our new numbers.
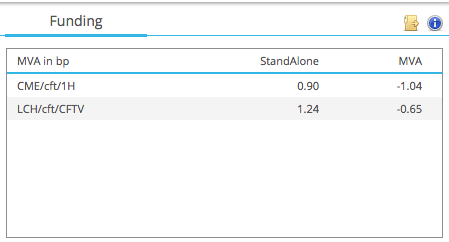
Showing that:
- CME Cleared, the Standalone MVA is now 0.90 bps (was 1.19 for Rec)
- LCH Cleared, the Standalone MVA is now 1.24 bps (was 1.26 for Rec)
A chart of IM , shows why the MVA is lower.
Base IM for LCH is $4.4m and for CME it is $3m and then decay down to zero.
Summarising our results.
Showing the MVA in basis points on a standalone 10Y USD IRS, which at 1.2 bps is significant and certainly larger than a standard bid-offer of 0.25 bps.
The size of this MVA, is similar or greater than FVA for a Cleared Swap, while CVA and DVA are not applied to a CCP Cleared trade and Capital Valuation Adjustment (KVA) is a topic for another day.
Portfolio Effects
Lets now move on from looking at our 10Y Swap as a standalone trade and consider the impact of this trade on our cleared portfolio. What is important here is not the IM profile of our 10Y IRS, but how the whole portfolios IM is changed by our trade and the funding cost of that change.
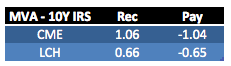
In this case the numbers depend on the existing risk position of our cleared accounts at CME and LCH, so the numbers that follow are hypothetical. Again from CHARM for our Rec Fixed 10y IRS:
Showing that the MVA impact of a this CME trade on our portfolio is 1.06 bps and not 1.19bps, while for the LCH trade it is 0.66 bps not 1.26 bps.
A Chart of IM shows why.
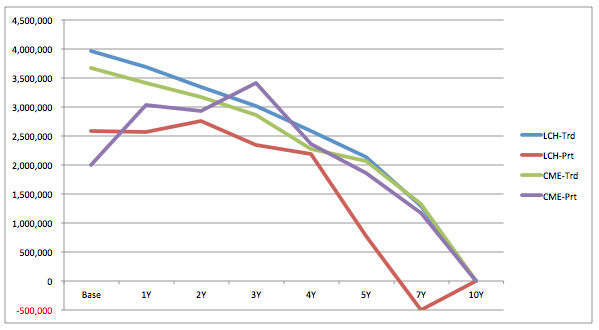
Our nice smooth stand-alone curves (LCH-Trd and CME-Trd) now have real-life complexity of a portfolio with lots of Swaps maturing at different dates, changing the risk profile in a non-linear manner (LCH-Prt, CME-Prt).
We see that the impact on each of LCH and CME is that the base IM is lower but that as we move forward in time this impact changes the IM very differently. For both the IM increases for the first 2-3Y and then drops off, in the case of the LCH portfolio the trade actually reduces IM from 6Y on.
Funding this change in IM gives a very different MVA for our trades.
And also tells us that for the Pay Fixed versions of these trades, we would expect negative MVA.
Lets re-create our summary table.
Showing lower MVA than before.
While for Pay Fixed Swaps, based on our hypothetical cleared portfolios we should be willing to improve our rate by 1bps for CME and 0.65 bps for LCH. Much wider than the bid-offer spread and making it likely that we would win such trades; assuming other firms did not have larger MVAs.
MVA in Practice
The common example we see quoted is where a Swaps Dealer enters into a Bilateral trade with a customer and hedges with a Cleared Swap. As well as the usual CVA on the Bilateral trade, it is interesting to calculate the MVA on the cleared hedge. In cases where this MVA is negative, this generates a a profit for the dealer, some of which could be given to the customer to achieve a better price and so win the trade. Of-course the converse is also trade, resulting in losing the trade if other dealers are not charging MVA or do not have the same position.
There is another situation, the CCP Basis and the CCP Switch trade.
The CME-LCH basis on USD IRS 10Y is currently 2.45 bps. We can get some insight into this by building the components of this as two gross IMs that need to be funded by a Dealer, Rec Fixed at CME on the dealer to customer trade and Pay Fixed at LCH on the dealer to dealer hedge.
From our first summary table these are 1.19bps and 1.24 bps or a 2.43 bps.
So almost exactly the same as the 2.45 bps Basis. I would have expected ball-park close, so some sampling luck here, as checking on a few other tenors shows more variance between the theoretical and observed, as we would expect given supply and demand.
However in our hypothetical portfolio case, we would calculate this as 1.06 and -0.65 or 0.41bps!
Meaning that as the CME-LCH Basis is much wider, we may want to trade this using CCP Switch trades, either as Outrights or Curve trades.
There is another situation, the fact that most USD Swaps between financial firms are MAT and so required to be Cleared. Meaning that for this both sides, even non-Swap Dealers should be cognizant of the MVA, when negotiating prices.
Summary
MVA is an important new XVA.
With the move to Clearing and Bilateral Margin its importance is increasing.
We expect MVA to become as well known as CVA.
Real world examples for a 10Y USD IRS show how it functions in practice.
CCP Basis Spreads can be explained by MVA components.
We expect MVA to be widely used in pricing and profitability.