- We answer a simple question – what is the average size of a swap trade?
- We find that average size varies by maturity and currency
- Average trade size is also different between Dealer to Dealer and Dealer to Customer execution platforms.
- Overall, we find that USD swaps have the largest average trade size, at $45,000 in DV01
We’ve talked previously about Average Daily Volumes and we’ve looked at some characteristics of swap markets a long time ago in DV01 terms. But there is a simple question we have not explicitly answered before that is likely to be of interest to newcomers in the markets. So here goes.
Average Trade Sizes in the SDR Data
Average trade sizes across Swap markets vary significantly by currency, tenor and trading platform. These are the three variables we will focus on this week when slicing and dicing our data.
First up, let’s take a look at average notional sizes, in currency, for the G4 currencies reported to the DTCC SDR. It’s best to split these by maturity:
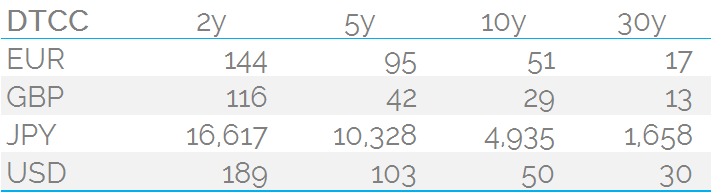
Showing;
- For the month of April 2016, average trade sizes in Millions of local currency reported to the DTCC SDR.
- We look at trade types including Outright, Spreadover, Curve and Butterfly trades. These are the trade types that we consider price-forming.
- We take the market standard trade types – i.e. spot starting, vanilla trades. These are flagged with the matching Bloomberg tickers in the Clarus data – e.g. EUSA10, BPSW10, JYSW10 and USSW10.
- We calculate these averages using the mean measure – i.e. by summing the total reported notional and dividing by the number of trades. Because the notional of some trades will be capped at the reporting threshold, the averages will be skewed lower than reality.
- Overall, we can see that USD swaps have the highest notional amounts. This may be skewed by the population reporting the data, as it is dominated by US Persons.
- We could summarise the above in USD equivalent terms for all currencies:
- An average 2 year swap is traded in $150-200m
- 5 years in $100m (apart from GBP which is much lower)
- 10 years in $50m
- 30 years in $20m (with USD much higher)
Median Notional Sizes
As any high-school maths whizz can tell you, there are averages and there are averages. So let’s double-check the above numbers by calculating the Median as well.
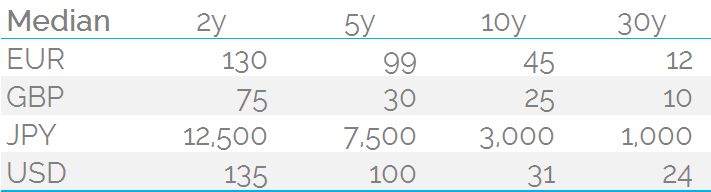
Showing;
- The median averages for the same data set as previously
- Nice round numbers as we would expect
- The numbers are marginally lower, but are not so skewed by the capped reporting of block trades
- In USD equivalent terms, the summary looks only marginally different to the mean averages:
- 2 years in $130m
- 5 years in $100m (GBP lower)
- 10 years in $30m (EUR higher)
- 30 years in $15m (USD higher)
If we also calculate the Mode averages, we see those pesky block trading thresholds coming into play again, as their frequency is high enough to skew the calculations. So in EUR and USD and for 2 year maturities, the block thresholds end up being the “most common” trade size. I’ll leave our subscribers to have a look at these numbers if they really need them – I would suggest excluding all block trades from the trade universe to get cleaner numbers.
Notional Sizes by Platform
The great thing about our data is that we can also analyse at the platform level. We intuitively expect Dealer to Dealer platforms to see higher average trade sizes than the Dealer to Customer platforms. We can test this in our data because:
- Some of the IDB SEFs, such as Tradition, publish a daily trade count along with the total uncapped size that trades. This allows us to calculate the “real” average trade size on their platform using SEFView.
- Any trades done on Bloomberg’s SEF are reported to their own SDR. Therefore we can analyse this SDR data-feed independently to calculate average trade sizes on BSEF.
Here’s the data;
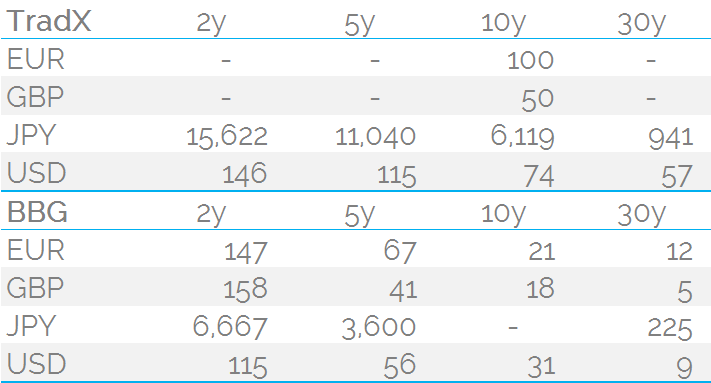
Showing;
- Mean trade sizes in millions of local currency on the TradX SEF and the Bloomberg SEF. All trade types are included.
- TradX numbers are uncapped as they are reported by the SEF each day, whilst the Bloomberg numbers are capped as they are reported to an SDR.
- We do not see enough trades on TradX in EUR and GBP swaps outside of the key 10 year tenor to calculate an average during April 2016.
- Nonetheless, it is clear that TradX average trade sizes are significantly larger than BSEF.
- In USD and JPY swaps, average trade sizes are larger on TradX for every single maturity.
- The multiples are even larger than I expected.
- Of particular note, 30y swaps in USD and JPY are much larger on TradX.
- I assume that the same differences occur when comparing any Dealer-to-Customer platform to any IDB SEF. Isn’t that the whole reason we have a segmented market place?
Average Trade Size by DV01
I was also motivated enough to recalculate all of the above numbers in risk-terms. As regular readers know, we calculate the DV01 of all of the trades in the SDRs (and SEFView), giving us a maturity-independent measure of risk. This allows us to quickly assess the amount of risk trading across maturities. We can therefore look at the different average trade sizes that are transacted on TradX, Bloomberg SEF and the broader DTCC SDR market.
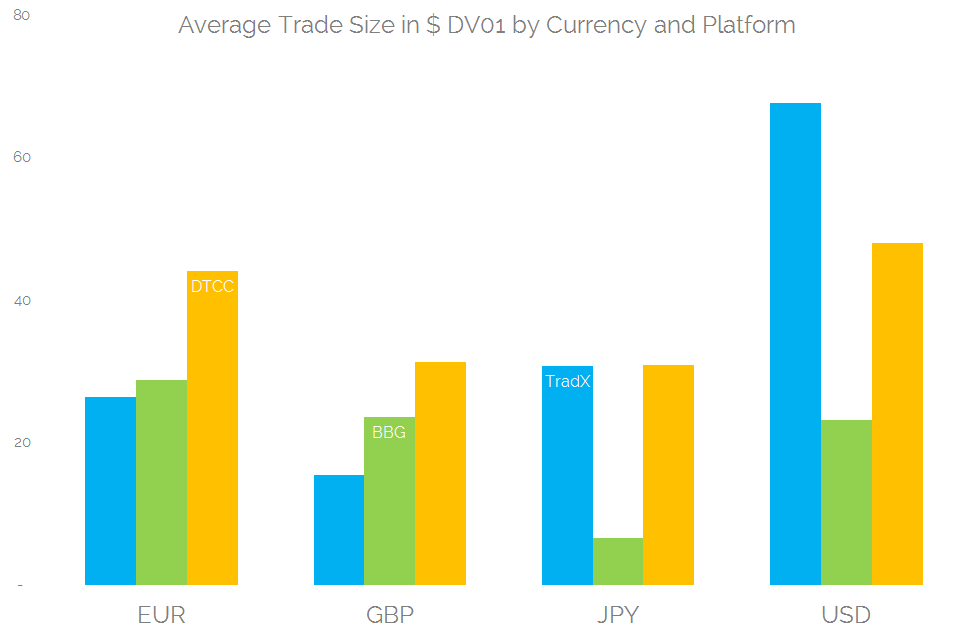
Showing;
- Average trade size by DV01 for TradX in blue, Bloomberg SEF in green and the DTCC SDR in orange.
- All figures are calculated in USD.
- We can see that TradX has larger average trade sizes than both Bloomberg and the broader DTCC SDR market in USD and JPY swaps.
- Generally, the Bloomberg SEF has a lower average trade size than other segments of the market.
- In EUR and GBP, there is limited uptake of SEF trading. We therefore see smaller average sizes on the TradX SEF and the Bloomberg SEF, than for the market overall. This is because our DTCC SDR figures also include off-SEF trades, which are a significant portion of these markets.
Summary
- We calculate average trade sizes across different SEFs, different currencies and different maturities
- In notional terms, the average trade size varies significantly with maturity.
- Average size also varies with currency (bearing in mind the data set is skewed towards US Persons).
- We find that Dealer to Dealer SEFs have higher average trade sizes than Dealer to Customer SEFs
- Across all platforms, we find that average trade sizes are highest in USD at around $45k DV01….
- EUR swaps have the second highest average trade size at $33k in DV01….
- ….with GBP and JPY tied at $23k DV01 each.
Hmm – interesting work, thx. I’d also be interested in assessing volume from a purely data perspective – how many trades of what instruments over what time period? As people continue to evolve their systems and processes in response to regulations and market changes, understanding the volume of data involved in operating in specific markets becomes increasingly important. Just a thought. Thx.