- We use Linear Regression on price time-series to identify discontinuities in price
- These discontinuities represent jumps in price
- We use these jumps to identify which USD IRS trades are cleared at CME
- This allows us to extract yet further information from the publicly reported data
- The methodology is dynamic, and therefore is suitable across a range of products and maturities
Forecasting Swap Prices
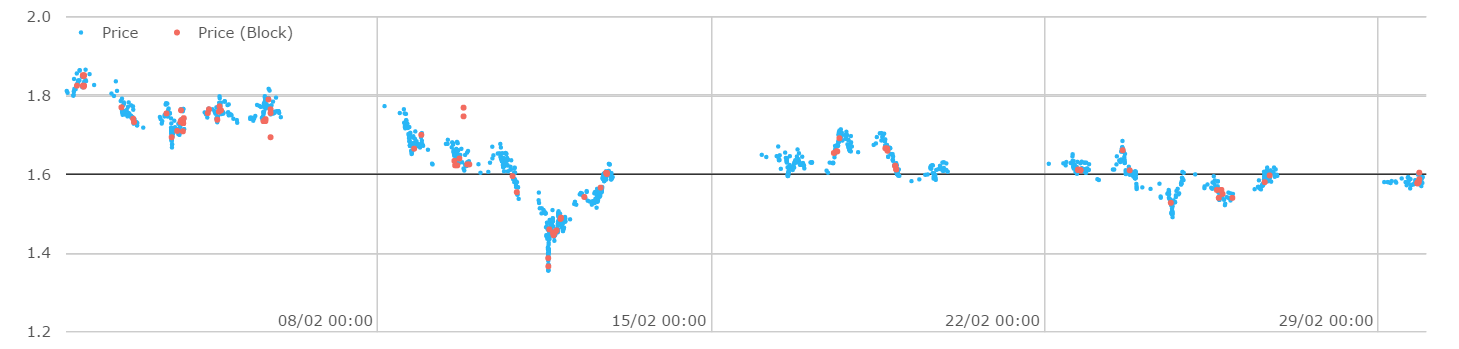
When presented with an intraday time-series of data that is derived from SDRs, we see a unique feature for USD swaps. Even with the curated nature of the Clarus data, the price-series is more erratic than we would expect. This isn’t evident if we look on a longer time horizon – even just a few days – but it is noticeable when we interrogate the data intraday. For example, take a look at the month of February (left hand chart below) versus a single day (the 26th) on the right. Click to enlarge the charts.
Showing;
- Prices of 10 year USD swaps, all matching the primary economic terms of the USSW10 Bloomberg ticker.
- On the monthly chart, there are no obvious jumps in price. The price evolution looks like most typical financial charts. Even better, from the middle of the month until the end, prices exhibit a nice random walk, ending where they began.
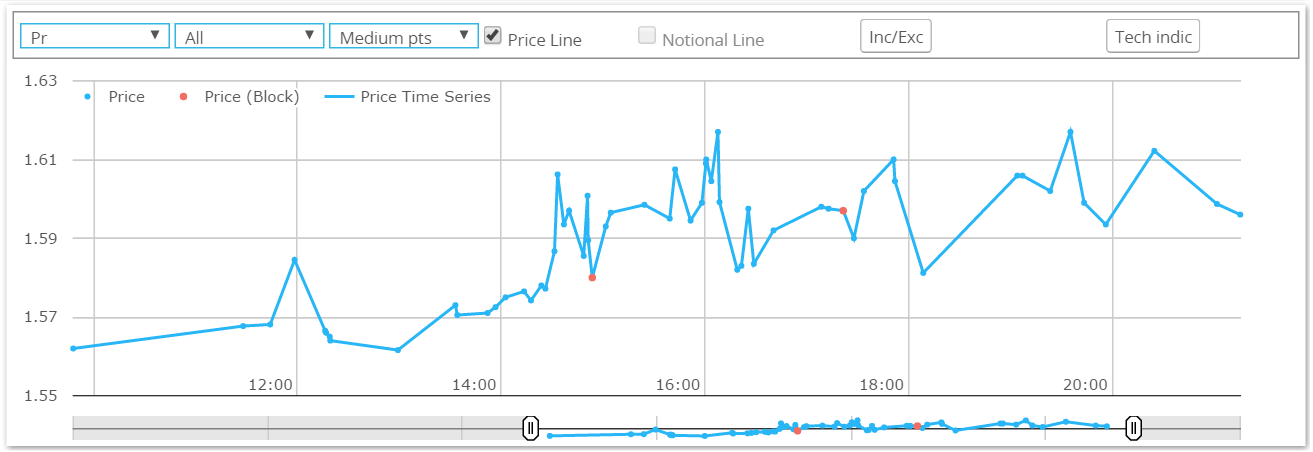
- However, drilling down into a particular day (right hand chart), we see a far more “saw-toothed” pattern.
- The evolution of prices on a single day looks somewhat strange – do prices really see-saw so sharply within a single day?
Regular readers will be aware that the answer is (probably) “no”. The reason that the short-term chart on the right exhibits strange behaviour is due to the polluting nature of CCP Basis on price data.
CCP Basis
When a trade is reported to an SDR, it does not contain the name of the Clearing House at which it is cleared. We can make some educated guesses – such as if a Swaption is reported as “Cleared” then it is a fair bet it has been cleared at the CME!
But, a CCP Basis has emerged for vanilla swaps. This means that economically identical trades that are cleared at different clearing houses now have different fixed rates. We have written at length on this subject, so please check out any of our blogs for a refresher.
Price Pollutants
Fortunately, we can extract extra economic information from the price series of data to accurately deduce which trades are cleared at CME.
We are looking to take advantage of the fact that the difference between the price of a CME trade and one cleared elsewhere is large enough, and in-frequent enough, to cause a discontinuity (or “jump”) in the time series.
Whilst dealing with “jumps” is a feature of some financial literature in academia, they typically deal with an adjustment to a Brownian motion type of movement. Or in terms of modelling OIS rates, defining where and when these jumps can occur.
We actually have a somewhat more defined pattern to look for. We are looking for prices that have a jump on each side. We also know, to a certain extent, what the size of jump should be.
Methodology
We don’t want to give too much away on a public blog about exactly how this is achieved. Suffice to say that we use Linear Regression at a given confidence interval (e.g. 95%) to ascertain how large we expect changes in price to be from one trade to the next. We can then examine the price jumps on trades in “packs of three” to identify if a jump is evident.
Results
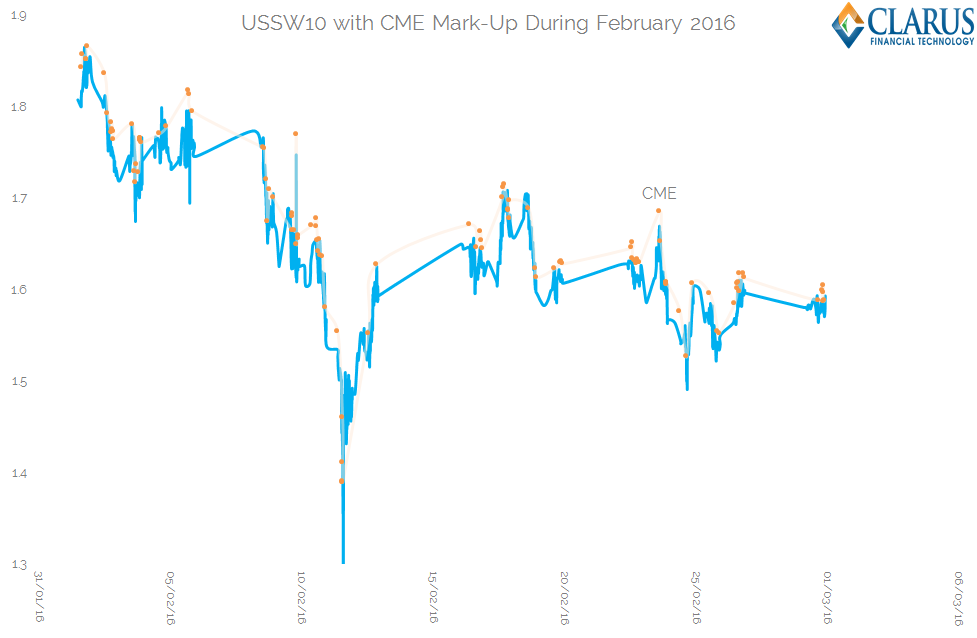
As opposed to last week’s somewhat underwhelming results, I’m pleased to say that running our identification programme this week yielded excellent results. We don’t have quite the same access to a testable universe of known CME trades as we do with CCP Basis – but we can at least cross check to ensure that both our true positives and false positives from last week are equitably dealt with. Have a look at the time-series below for February 2016:


Showing;
- A successful identification of the spikes as “CME” over the four day period shown
- Evidence of an erratic move downwards towards the lows of the month which are successfully ignored – the differences between consecutive trades were not large enough to warrant a different CCP being identified.
- Not a chart Tufte would be proud of though – too much ink.
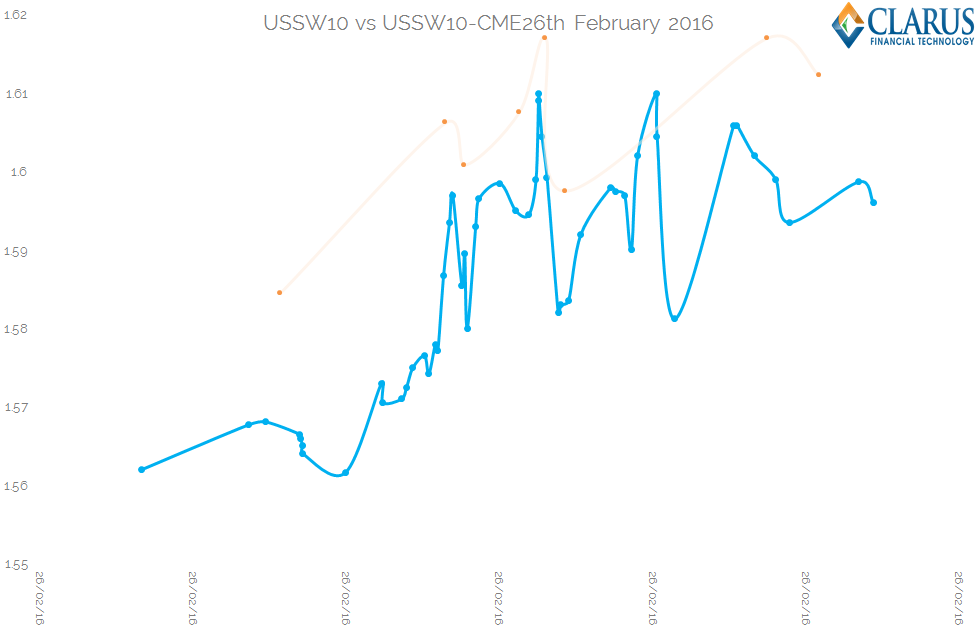
Instead, let’s also look at the separate time-series of USSW10 and USSW10-CME (i.e. the same swap but cleared at CME) for the month of February and for the 26th of February:
Showing;
- A compelling monthly time-series (left hand chart) of near parallel evolution between the CME line and the USSW10 line.
- The intraday chart (26th Feb, right hand chart above) is still somewhat erratic, but far less so than previously.
- 8 trades on the 26th are identified as being CME-cleared.
- These trades tend to follow a similar pattern to the lower blue line.
- Not shown on the charts, but worth noting, is that the CCP Basis trades identified using last week’s methodology are successfully identified (by cross-reference to SEFView), and the false positives are successfully ignored.
- It may also be nice to mark the suspected outliers as part of this exercise, but that would be the subject of another blog!
Caveats
Of course, as we noted last week, there are limitations to using prices themselves to discern more information about…prices. So we should caveat that the above methodology does have limitations:
- This identification works best when the basis is wide. This may be a good thing, as we care most about the basis when it is….wide!
- This identification works best when the instrument is very liquid and has a lot of trades reported. A lengthy period of time between trades or large gaps in price do not lend themselves well to this kind of analysis.
- Despite 2 year swaps being “liquid”, they are generally too short to exhibit either a meaningful basis (as margin does not have to be posted twice for a lengthy period of time) or to trade often in swaps. At the moment, this therefore works best on swaps 5 years and longer.
On the plus side, we do have both CCPView and SEFView with which to cross check our results. Which is the great thing about the Clarus data set.
In Summary
- We extract further information from the publicly reported price data in the SDRs.
- We use discontinuities in the price time-series to identify which trades are cleared at CME.
- We choose a high confidence interval – of 95% – to minimise false positives.
- The methodology is dynamic as it adapts to changing markets and different products. It does not look for the same price discontinuities on a 10 year swap as a 5 year swap.
- We will continue to cross-check the results of this CCP-identification with our other unique data sets in CCPView and SEFView to further test the hypothesis.