- We run a programme to identify CCP basis trades in SDRView
- We successfully identify the trades reported by SEFs every day within the SDR data
- We also find a surprisingly high number of trades transacted at the same time but at different prices – which are not CCP Basis trades.
- This suggests that price discovery and execution is not quite as efficient as we would like to think in IRS markets just yet.
CCP Basis was one of our most widely read subjects of 2015. So I thought it was about high time to have another look at the SDR data and attempt to answer a simple question – can we systematically identify where a publicly reported IRS trade is cleared?
What are we looking for exactly?
As we’ve explained before, a CCP Basis market has evolved on the IDB SEFs. This allows banks to trade a pay-fixed IRS of a certain size and maturity at one CCP versus a receive-fixed IRS with matching primary economic terms at a different CCP. If you need a refresher, check out the blogs here.
This means that CCP Basis trades themselves have certain features that we can go looking for in the SDR data (e.g. pairs of matching trades transacted concurrently).
Clarus Data
We have a number of tools that make the job above fairly straight-forward. First off, we augment the SDR data with Bloomberg Tickers. That means that I can query all trades with ticker “USSW10” to just look for 10 year USD IRS trades. Looking for pairs of trades with matching time-stamps within this universe then gives me a pretty good starting point for today’s analysis.
However, if I were to do that in isolation, we’d still be taking a shot in the dark. This identifies only “suspected” or “likely” pairs of CCP Basis trades. We need a little bit more information.
Fortunately, that is where SEFView helps. We use the mark-ups contained in the daily SEF reports to identify, where possible, which CCP the trade was conducted at.
Our Data Sample
I have looked at March 2016 for this exercise. We see the following trades:
-
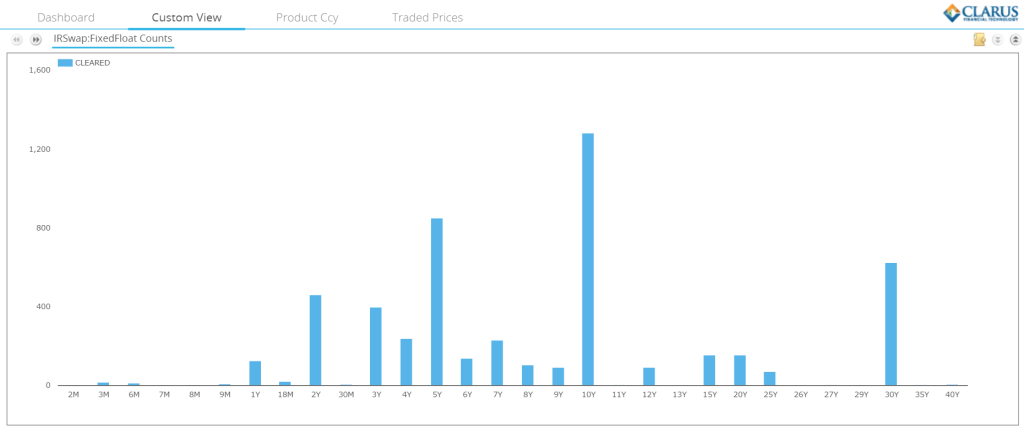
Tenor view of spot starting USD Swaps traded during March 2016 From SDRView Researcher, there were 851 Spot-Starting, Cleared USD trades of 5 year maturity traded as an outright (i.e. excluding Curve, Butterfly, Spreadover and Compression trades).
- There were 1,282 10y trades (chart to the right)

- And we know that we are looking for 10-20 trades in 5 years from the trade count mark-ups in SEFView (out of 851 trades…great!).
- And similarly for 10 years we are looking for roughly 10-15 trades, with activity on 8 days.
The data above means that we can use a known population of trades to verify that our CCP Basis identification programme is working.
So what are the results like?
First off, we can successfully identify the CCP Basis trades from SEFView in the SDRView data.
This is pretty cool. Just as we can filter the price-forming trades from portfolio-maintenance exercises such as Compression, we can now also extract economic information that is not contained within the original data. That’s a big improvement on where we were last year.
It also means that we can identify the price of the adjacent trade and hence of the CCP Basis package. Over a period of time, such data augmentation will allow us to perform all of the analysis we care to on CCP Basis packages. Anyone reading this blog is likely to agree that is a good thing.
It’s also pretty cool from a Clarus perspective. We’ve wanted to extract more value from our unique data for a while by cross-referencing SDRView with SEFView. This gives us the excuse to explore that work in even more detail.
The small downside
Combining our data-sets is retrospective (we will only know if a particular trade was cleared at e.g. CME on a T+1 basis). This is because we have to wait for the SEF end of day reports to be published. If our identification programme did not throw out any false positives, we could also rely on this logic in real-time.
However, when I apply the same package-identification rules to the data in real-time, I do get some false-positives. For example, if I do not cross-reference our SEFView data, I see the following results:
- 24 pairs of trades in 5 years.
- 20 pairs of trades in 10 years.
When I do cross-reference with SEFView, I see:
- 12 pairs of trades in 5 years.
- 10 pairs of trades in 10 years.
Currently, if we do not take the price of the CCP Basis into account, our identification programme hence returns the same number of false-positives as true-positives. That isn’t a great hit ratio….
Is It “other” CCP Basis?
If we didn’t have CCPView to refer back to, we might think that these trades are related to another CCP clearing USD Swaps. When we run the volume figures for March in CCPView, we see that Eurex have also cleared $187m month-to-date in USD IRS:
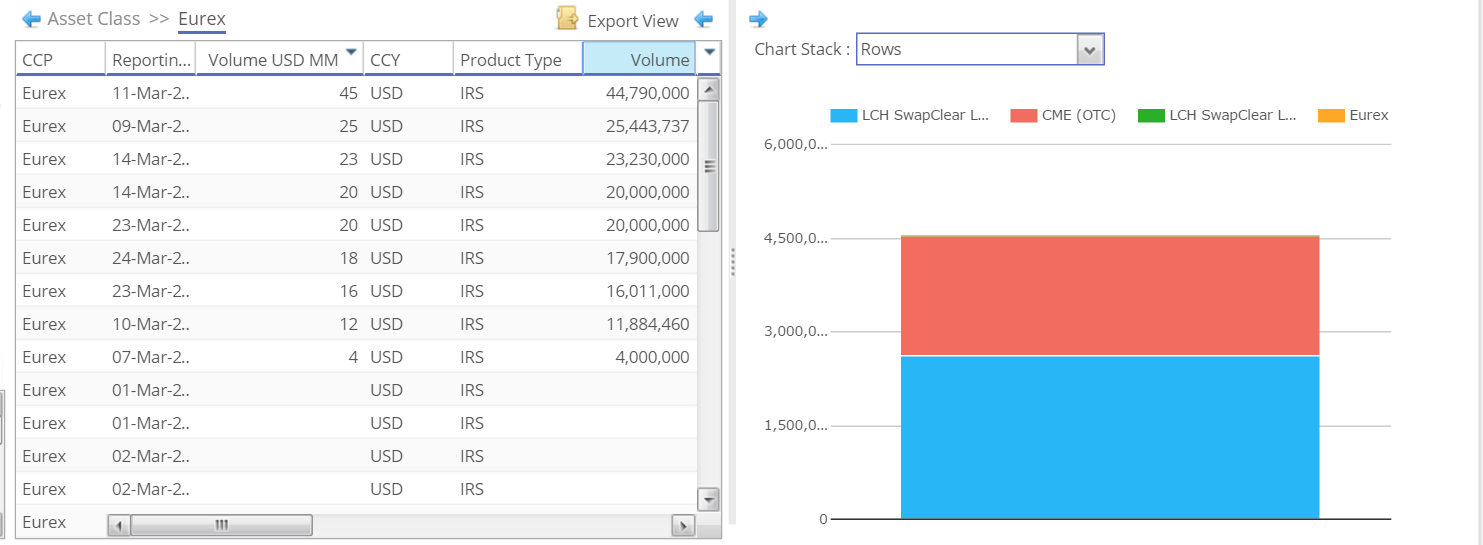
However, when looking at the daily volumes, they are all below $100m. The smallest pair of trades that we identified as a false-positive was $100m, and the largest was two block trades of $240m+ in 5 years. Therefore, these false-positives are not Eurex trades.
Using Price as a Trade Identifier
This brings us to two interesting conclusions. One about behaviour, one about real-time analytics.
- On the behavioural front, we see a surprisingly high number of trades transacted near-concurrently at different prices. These trades are of the same economic primary terms (maturity, size) but are trading at different prices. Reasons for this could be several fold, including;
- An execution process that has adopted a “slice’n’dice” approach to order management
- Bid-offers being locked-in nearly instantaneously
- Market participants joining only a handful of SEFs limiting their ability to access the “best price” at all times
- An inefficient price discovery mechanism operating in the most “liquid” maturities – if this is the case, someone needs to examine their aggregator and latency limits!
Remember that we have filtered out Curve trades, Butterflies, Spreadovers and Compression runs from our data. So these time-concurrent trades are not legs of spreads that are struck at different coupons. They are standalone, price-forming trades that are being transacted at different prices. This is not a great sign of efficiency in our markets.
- In terms of real-time analytics, it means that we need to include the price of the CCP Basis itself as an input to the identification algorithm. This can cause problems when the basis is very small.
Latest Basis Prices
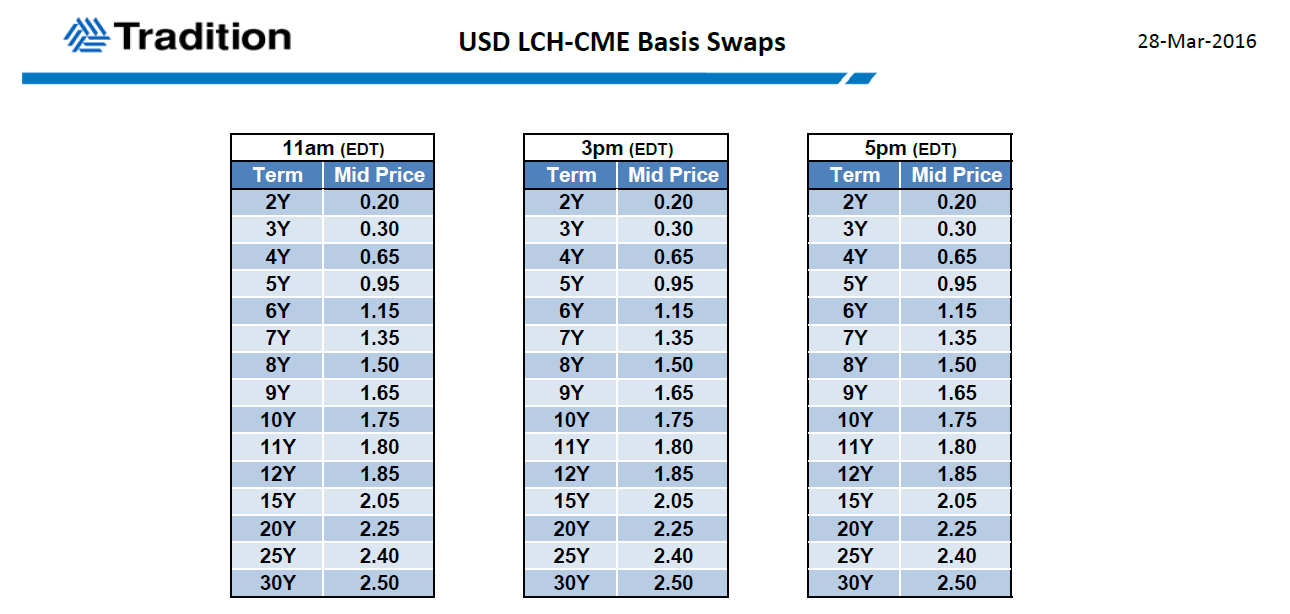
Tradition were kind enough to provide us an update of prices as at 28th March:
 Showing;
- 2 years at 0.20 basis points
- 5 years at 0.95
- 10 years at 1.75
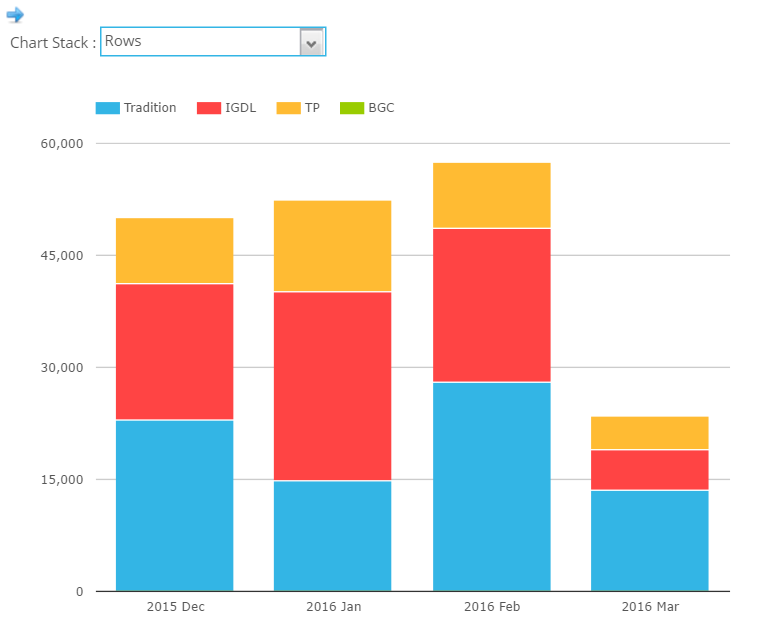 These levels are in-line with our recent February Swaps Review, so our readers will not be surprised to see a dip in CCP Basis-related volumes this month – see chart to the right.
But volumes aside, these tighter prices present us with a conundrum for our real-time CCP identification.
Focusing on the medium term tenors of 5 year to 10 year, we can plot the distribution of possible package prices that we have seen in March 2016. Due to the low number of (real) trades, we also end up with a small population of trades – making most analytical measures such as standard deviation pretty much defunct:
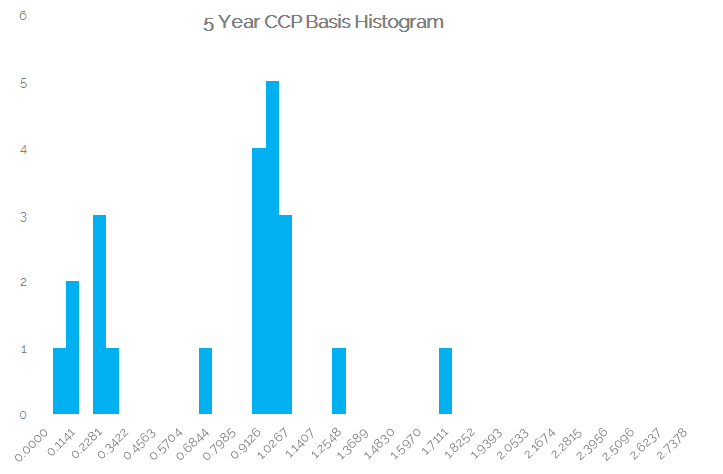
Showing;
- For 5 years, a peak in the number of observations around 0.95 basis points – just as we would expect.
- A disappointingly large number of observations around 0.25 basis points.
- A clear outlier at +1.7 basis points.
Pragmatism
So we need some kind of solution that flattens our tails and stretches the peak of the above distribution. Due to the small sample size (at the moment), we can’t use any fancy data analytics to reliably manipulate the sample distribution.
Fortunately, we have SEFView to rely on. It also gives us known trades to identify. This helps to “train” our identification programme. Once the sample set is large enough, that should enable us to have enough data to consistently rule out the false positives in real-time as well. For now we will probably stick with the “cast-iron” identification by cross referencing SDRView with SEFView on a retrospective basis.
If any of our readers have a strong opinion on this, please feel free to reach out. I’ll follow-up next week to see if we can identify standalone trades by CCP.