Volatility in Rates markets has been elevated this year. However, I cannot remember a year when we haven’t said similar by October! It is very likely that the human-bias is innately more sensitive to change than stasis, which then leads inquisitive minds to work out what is causing the change.
But one thing that is normally stable is market structure. It is rare for CCP market share to change, it is rare for big swings in SEF market share and it is almost impossible to change the products that market participants trade in the absence of sustained regulatory action.
Why, then, am I suddenly having to write about (and talk about) “volatility” in RFR Adoption? It is a strange one, and as I mentioned in our recent podcast, pretty difficult even for those of us who follow the data really, really closely to make sense of.
September 2023 ISDA-Clarus RFR Adoption Indicator
Yes, USD LIBOR cessation has already happened but no, I don’t plan to stop writing about RFR Adoption just yet. If anything, the data has moved from being a virtual scorecard on how regulatory directives are being implemented across the industry to “what the hell is going on?”-levels of intrigue with changes in market dynamics.
The two most recent reports have been highly interesting. Last month, I stated:
- The ISDA-Clarus RFR Adoption Indicator increased to a new all time high of 66.1%.
- The 5.5% increase was the largest ever monthly change in RFR Adoption.
- It was only the third time that the index had been above 60%.
- SOFR adoption increased to 76.2% from 71.5%.
- €STR adoption hit a new all time high at 35.2%.
I went on to state that “RFR trading was back on track“, only for this months report to resolutely prove that a single data point does not make a trend. See below:


Showing;
- The index has dropped from 66.1% to 60.3% – a significant retreat away from last month’s all time high.
- SOFR adoption dropped to 68.3% from 76.2% – the biggest monthly fall on record.
- 58.3% of total activity by notional was vs RFRs, another big fall showing that this was broad-based across all trading.
- €STR trading also dropped, but only slightly, from 35.2% to 34.6%.
- CAD CORRA trading had its best month ever, recording a big jump to over 75% of the total market. However, with CAD a relatively small portion of the overall index (it is DV01-weighted across all currencies), then it does not impact the overall adoption figure.
USD Market
SOFR Adoption was not great last month. Just 68.3% of total USD risk was traded vs SOFR:


A quick chart using the underlying CCPView data provides some clues as to what is going on here in terms of the overall product mix that traded:

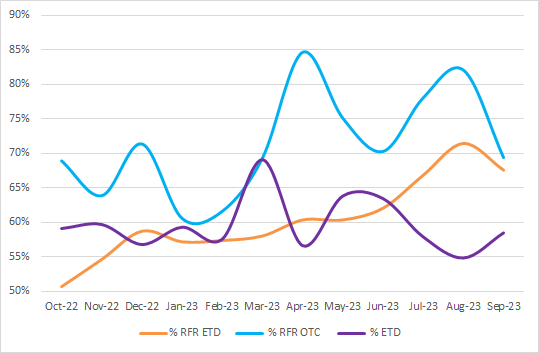
- The orange line shows the percentage of risk traded in Futures (ETD) markets versus SOFR. For the first time in a long time, the amount of risk versus SOFR dropped month-on-month in September. The risk not traded versus SOFR was traded versus Fed Funds.
- At the same time, we saw a large monthly drop in the amount of risk traded vs SOFR in OTC markets (blue line above). Swaps saw just 69% of risk traded versus SOFR, versus over 80% last month.
- The product mix between Swaps and Futures was relatively stable, but there was a small increase from 55% to 58% in the proportion of risk traded as a Future (ETD, purple line above).
The combination of a large drop in SOFR traded in OTC markets, along with a smaller drop in ETD markets, caused overall SOFR adoption to drop significantly across the USD market. This could be caused by:
- Repositioning in Fed Funds markets to reflect potential changes/perception of changes in Fed monetary policy.
- A “higher-for-longer” narrative may have changed the maturity distribution of risk.
- September was a roll month, potentially seeing changes in product mix associated with it.
We try our best to pull out the impacts of these changes in the regular monthly data, but the precise story for SOFR this time around will take a bit more data to work out. Listen in to our upcoming podcasts and we will share more of our thoughts on the precise causes of the drop in SOFR trading.
EUR Market
Finally, whilst €STR adoption was pretty stable month-on-month, it was a busy time in EUR markets overall. The amount of risk traded in EUR versus the rest of the currencies increased.
We can summarise by stating that in a month when the total amount of risk traded was pretty stable compared to last month:


The increase in the amount of EUR risk traded was substantial:


Meaning that a market with only ~35% RFR Adoption was a bigger constituent of the overall market in September (the currencies are DV01-weighted), resulting in a drag lower on the overall index.
In Summary
- RFR Adoption reduced substantially last month.
- This was a surprise given USD LIBOR cessation has now occurred.
- The product mix changed in September with more risk trading versus Fed Funds and in EUR products than in previous months.
- It is well worth tuning into our podcasts where we share more of our thoughts on the data.