
- We go through the ISDA SIMM™ methodology document
- And create an Excel spreadsheet for Rates IM according to ISDA SIMM™
- We provide a summary of Initial Margin for standalone trades and portfolios under ISDA SIMM and as Cleared portfolios at a CCP
- UPDATE: We now offer free 14-day trials for our SIMM for Excel product
ISDA SIMM™
ISDA highlighted the documentation and operational issues surrounding the implementation of the UMRs (Uncleared Margin Rules) recently in a media comment. Fortunately, there haven’t been the same concerns aired about the calculation of margin within ISDA SIMM™ itself for the actual margin amounts involved.
If we remember that some of the guiding principles surrounding the SIMM model are (selectively):
- Ease of replication
- Transparency
- Quick to calculate
- Predictability
- Costs
It makes sense that the calculations should be simple. I therefore thought it would be a good idea to see if I could build an ISDA SIMM calculator in Excel, without recourse to any coding or custom functions.
Foolhardy? Let’s see….
Follow Along at Home…
I was originally going to work through the ISDA_SIMM_vR1.0 document. But because we focus on the Interest Rates market, I’m not too concerned with the other “Product Classes”.
In effect, this means that all I really needed to do was work-out what the below formula means from an Excel viewpoint:
\( \tag {1} K = \sqrt{\sum\limits_{i,k}{WS_{k,i}^2+{\sum\limits_{i,k}}{\sum\limits_{(j,l)≠(i,k)}{φ_{i,j}{ρ_{k,l}}{WS_{k,i}}{WS_{l,j}}}}}}\)
Breaking this formula down into its’ constituents shows that;
\( {WS_{k,i}}\) is the DV01 of a given tenor multiplied by the ISDA-supplied risk weighting. The risk weightings vary from currency, but there are only 3 mappings – normal currencies, low volatility currencies and everything else. All of this data is supplied by ISDA on the website, and in particular in the methodology document.
\({φ_{i,j}}\) is the correlation of the “WS” terms between indices (i.e. between index i and index j in the nomenclature). So for example, ISDA deem that the Libor 1 month Index has a correlation of 98.2% with the Libor 3 month Index. At the moment, this is neither currency nor tenor dependent, although this may obviously change in the future. One value therefore serves all relationships, which ISDA has calibrated at 98.2%.
\({ρ_{k,l}}\) is the correlation of the “WS” terms from one tenor to the next (i.e. between tenors k and l in the nomenclature). So for example, ISDA deem that the 3Y tenor has a correlation of 96% with the 5Y. These are not currency dependent – one table serves all currencies.
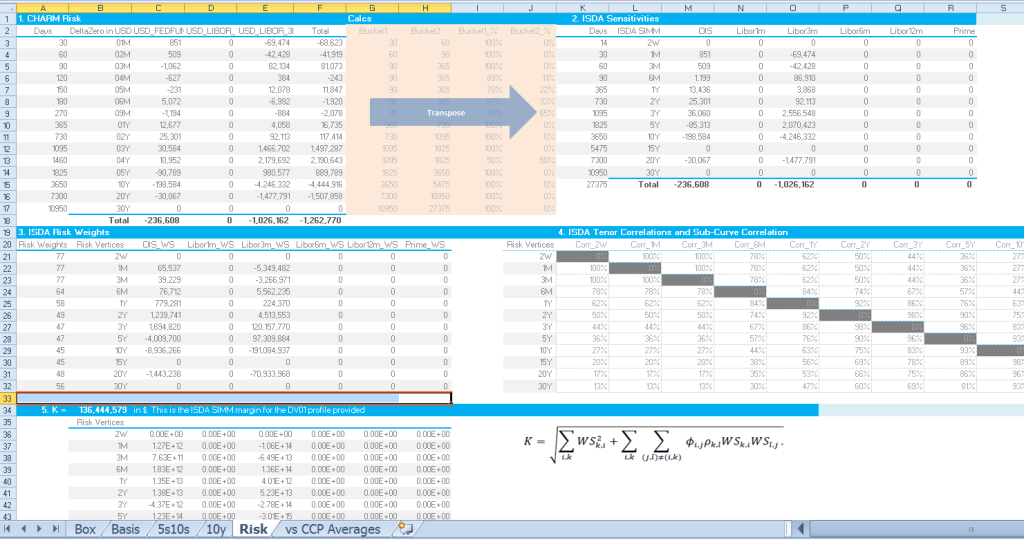
1. Risk Transposition of Sensitivities
As Amir has highlighted previously here and here, ISDA SIMM relies on risk sensitivities as inputs to the model. So, let’s start with a grid of DV01’s in our efforts to translate the above formula into something workable in Excel.
Showing;
- A DV01 profile (the left half) of interest rate risk for 1,000 USD Swaps. All of the swaps are versus the 3m Libor index, but some are off-market and hence create discounting risk to the Fed Funds curve.
- Strictly speaking, ISDA states that:
“For the interest rate risk factors, “market rates” (and not “zero coupon rates”) should be used to construct the risk-free yield curve”
- Worth bearing in mind when you are considering exactly which risk report to format correctly for ISDA.
- On the right hand side, we have transposed the risk from the “risk vertices” (buckets) in CHARM to the risk vertices that ISDA demand. These are defined in the document, and I chose a simple day-count transposition to arrive at the ISDA SIMM acceptable format of risk (shown as the “ISDA Sensitivities” above).
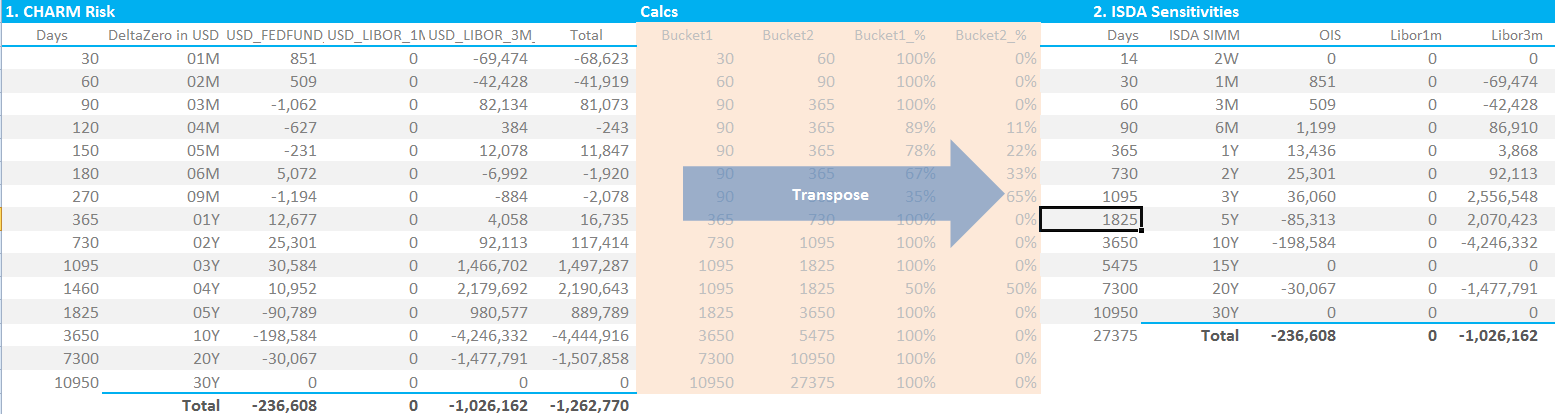
2. Risk Weightings
The next step is akin to calculating PnL. We simply take the risk above and multiply it by a vector for that tenor. Seeing as we are looking at a USD portfolio, we only need worry ourselves with the vectors for a “normal” currency. These are called Risk Weights by ISDA and are again available in the document (section D, page 12).
Therefore, applying the Risk Weights in the first column (which vary by Risk Vertex as we would expect), we end up with a matrix of “Weighted Sensitivities”, as shown below. These values are referred to as “WS” in the ISDA SIMM documentation.
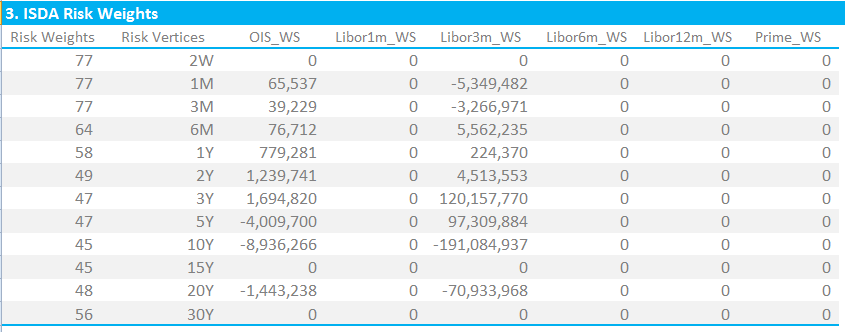
3. Correlations
I hoped the next step would be to sum all of those numbers together. That’s what we do on a daily basis after all – price change multiplied by risk gives us the PnL. But, to be fair, we are trying to calculate a mark-to-market change that will cover over 99% of possible market moves – including changes in outrights, curve and basis. So it’s not quite that simple.
Instead, we use correlations between all of the Risk Vertices across the different indices to decide how much offset we apply for any given position.
Again, these correlations are all defined by ISDA:
Showing;
- On the left hand side, the correlations between tenor points for the same index. This I think of as the “within-index” correlation matrix. For example, a 10Y tenor is deemed to have a 27% correlation with the 2W tenor.
- On the right hand side, I have added in the “SubCurve” correlations. These are the correlations between different points across different indices AND tenors. This I refer to as the “between-indices” correlation matrix. These are the correlations between tenors multiplied by the SubCurve correlation factor which is 98.2%.
- This double grid of correlations allows us to do two things – combine a Weighted Sensitivity in e.g. the 3M Risk Vertex with a WS in the 10y Risk Vertex of the same index.
- And also combine a WS in the e.g. 1Y risk vertex of the Libor3M index with a WS in the 10Y risk vertex of the OIS index.
- I found I needed two grids of correlations from an excel perspective – one with zero correlation of 10y vs 10y within an index, and one with 100% * 98.2% of 10y vs 10y across indices.
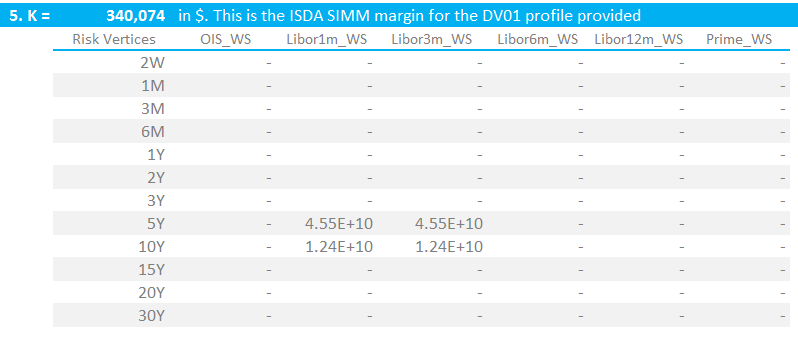
4. Calculate IM
For a single currency IM calculation, ISDA SIMM denotes the Initial Margin (IM) amount as letter “K”. This is defined as per the equation at the top of this blog:
\( \tag {1} K = \sqrt{\sum\limits_{i,k}{WS_{k,i}^2+{\sum\limits_{i,k}}{\sum\limits_{(j,l)≠(i,k)}{φ_{i,j}{ρ_{k,l}}{WS_{k,i}}{WS_{l,j}}}}}}\)In Excel terms, what we are doing is:
- Square all of the WS terms
- Calculate the WS-weighted sumproduct at a single risk vertex for all WS’s within an index (“k,i’s”) with the within-index correlation matrix
- Calculate the WS-weighted sumproduct at a single risk vertex for all WS’s across indices (“l,j’s”) with the between-indices correlation matrix
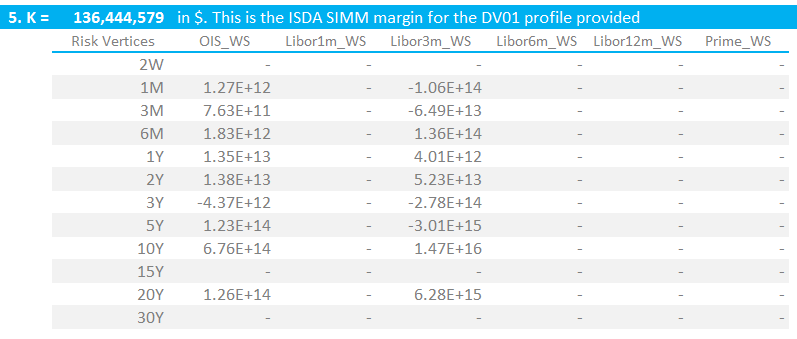
- Add together all of these 3 terms and then take the square root. For a single currency portfolio, this is the Initial Margin under ISDA SIMM. For our portfolio, this is $136m (see below).
My output looks like this:
5. Sanity Check Your Model
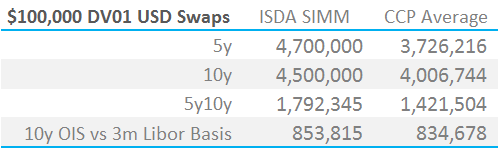
It’s nice to do this along the way, but really you need a K-calculator before you can get some sensible numbers out. I used the following test cases. We also present the output and compare with CCP-generated numbers from CHARM.
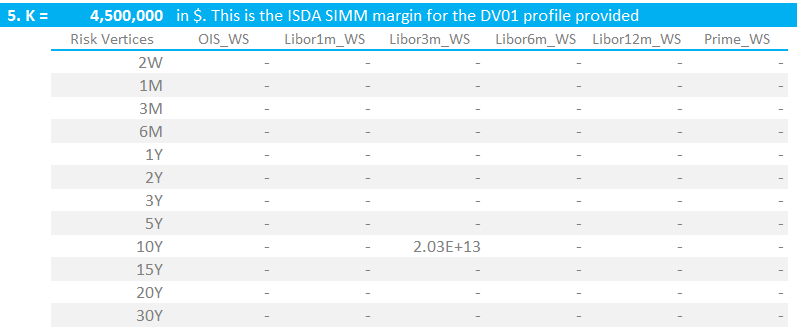
10y USD Swap in $100,000 DV01. IM = $4.5m
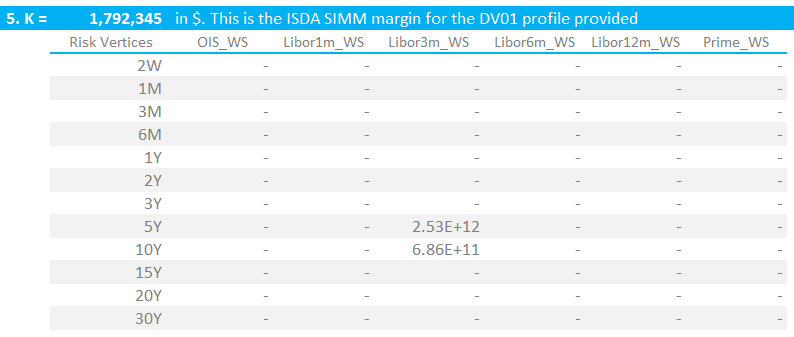
5y vs 10y USD 3m Libor swaps in $100,000 DV01. IM = $1.792m
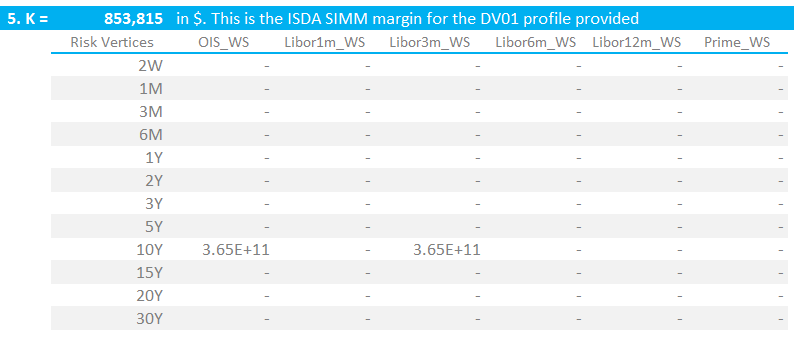
USD 3m Libor vs USD OIS 10y Basis in $100,000 DV01. IM = $0.85m
A USD Box trade – 5y10y in OIS vs 3m Libor in $100,000 DV01. IM = $0.34m
6. Summary vs the CCPs
I cannot imagine this will be the last time we are looking at ISDA SIMM or how margins compare.
So here is our first summary for standalone IM under ISDA SIMM compared with the same trades cleared at a CCP (IM figures calculated in CHARM):
Showing;
- ISDA SIMM is symmetrical between Pay and Receive. I have therefore taken the average of Pay and Receive for all CCPs in CHARM.
- ISDA SIMM, on a standalone basis, is higher than CCPs for all cases.
- But this may change on a portfolio basis. Our 1,000 test trade portfolio shows the following:
- These differences are not as great as we would have predicted.
- Remember that ISDA SIMM is calibrated for a 10-day holding period, but a ~99% confidence interval. Using a rule of thumb of “square-root 10 over 5” for the effect of the longer holding period, we would expect an IM 1.4 times higher for ISDA SIMM compared to CCP models.
- However, this is offset by a lower confidence interval. ISDA SIMM is calculated at a 99% interval, where-as CME and LCH use 99.7% (and it is Expected Shortfall, average of worst six, for LCH). This reduces the difference. It is hard to say by how much given the different sample periods.
Finally, we note that;
- These comparisons exclude Liquidity Add-Ons from all calculations. There is provision for Concentration Thresholds within ISDA SIMM, but ISDA are yet to implement these.
- I have to highlight the effect of netting. ISDA SIMM will be grossed-up between counterparties. This analysis assumes you trade with only one counterparty. See my recent blogs here and here to see the effects of grossing-up across multiple counterparties.
- The next step is to examine multi-currency portfolios. There is a (relatively) low correlation co-efficient of 27% under ISDA SIMM between interest rate risk in different currencies.
In Summary
- ISDA provides excellent documentation, allowing us to create an Excel spreadsheet that calculates IM for Uncleared Derivatives. We show you how.
- We use this model to compare IM for given DV01 profiles for both Cleared and Uncleared trades.
- The standalone IM figures for the Uncleared trades are closer to the CCP figures than we initially expected.
- But we cannot forget the effects of netting for a portfolio with multiple counterparties.
- Our next step is to expand our model to include multiple currencies under ISDA SIMM.
- UPDATE: We now offer free 14-day trials of our SIMM for Excel product.