Last week we introduced the idea that we can identify compression trades within the SDR data. Combining this with information direct from SEFView, we now have good estimates for compression volumes being traded across the three SEFs currently active in this market – TrueEx, BSEF and Tradeweb. Due to the nature of the exercise, we consider compressions as a subset of the swaps market as a whole, more aligned to portfolio maintenance than to risk-initiation and price discovery.
It is therefore important to understand a little bit more about how this market operates and analyse the behaviours inherent in the data. Let us therefore take a closer look at compression in USD Swaps traded on-SEF.
Block Activity
Most noticeable about this area of the market is the sheer quantity of block activity that takes place. For block trading, it makes most sense to look at the number of trades. We can see that, for November 2014, block trades made up a large portion of compression activity by trade number:
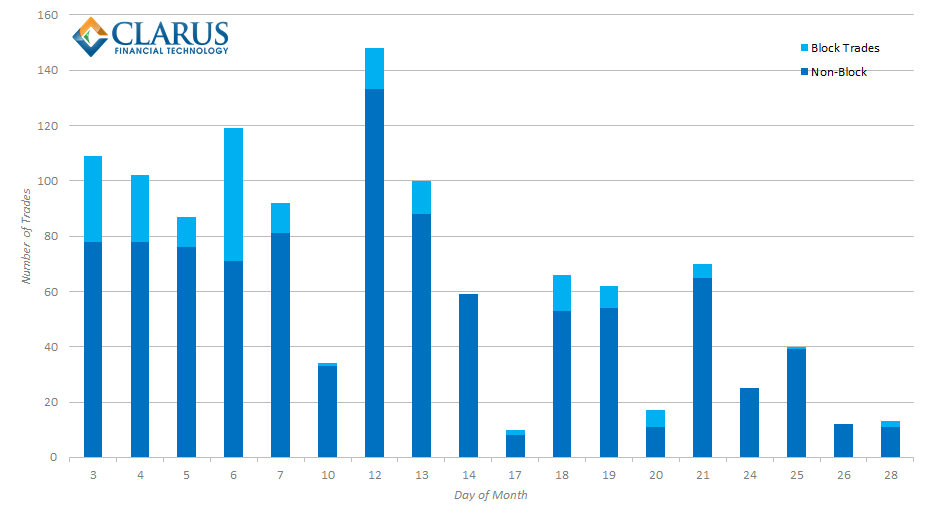
- 190 block trades were part of a compression run during November 2014
- On November 6th alone, 48 block trades transacted within a compression run
- 16% of compression trades were of block size
This last point is very interesting. We know that the CFTC generally wants to capture trades above a defined 67% notional threshold (see Tod’s rather natty explanation here), but this is difficult to conceptualize in terms of how many trades per day this actually is! However, looking at on-SEF USD trades for November, we can see that on average 9% of all trades were block size – much lower than within compression runs:
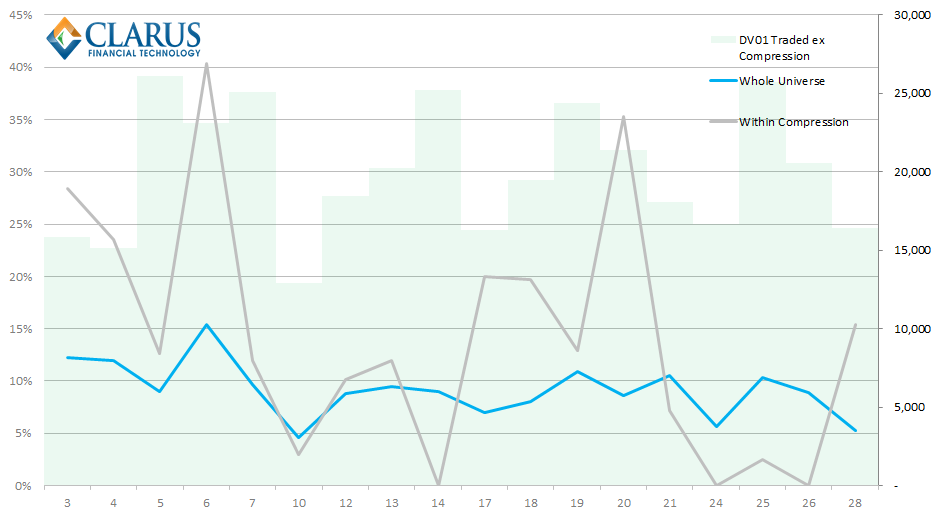
I have included the DV01 traded (excluding compression) per day in the background of the above chart to see if there was any identifiable pattern between large volume days and the number of blocks traded within compression runs. Sadly, we see just as many large volume days with a corresponding drop in block compression activity as we do peaks.
Over the month, we can state that blocks comprised 16% of all compression trades, versus only 8% for non-compression trades – i.e. compression runs have twice as many block trades compared to vanilla trading.
History
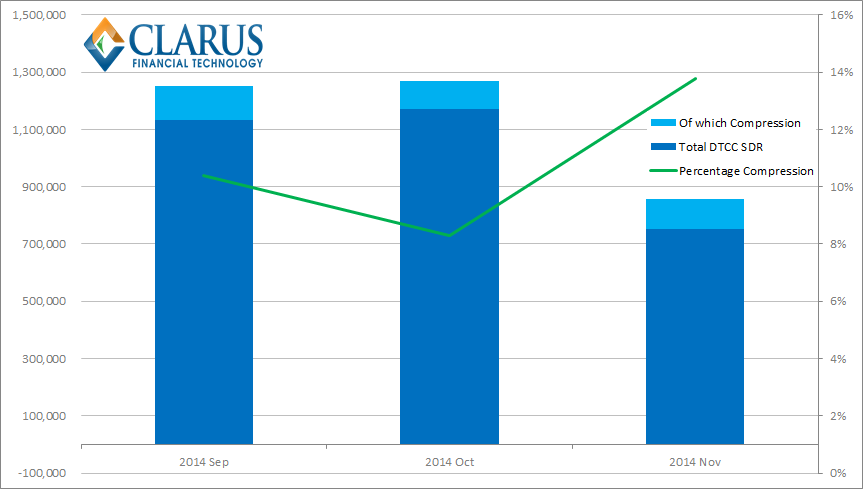
We’ve extended our compression identification to the past three months because this is when we introduced DV01 metrics to SDRView. This may only provide a limited history, but we can already see that compression volumes have been far more stable over our sample period than on-SEF traded volumes. On a monthly basis we see the following:
Showing that:
- On-average, Compression Volumes are $106bn per month.
- This has been pretty stable. 14% of traded notional was due to compression activity in November mainly because overall volumes dropped sharply – due to the holiday-shortened month.
- Following on from last month’s analysis, we see that Tradeweb have enjoyed approximately a 77% market share of compression during the past three months.
Daily Time Series
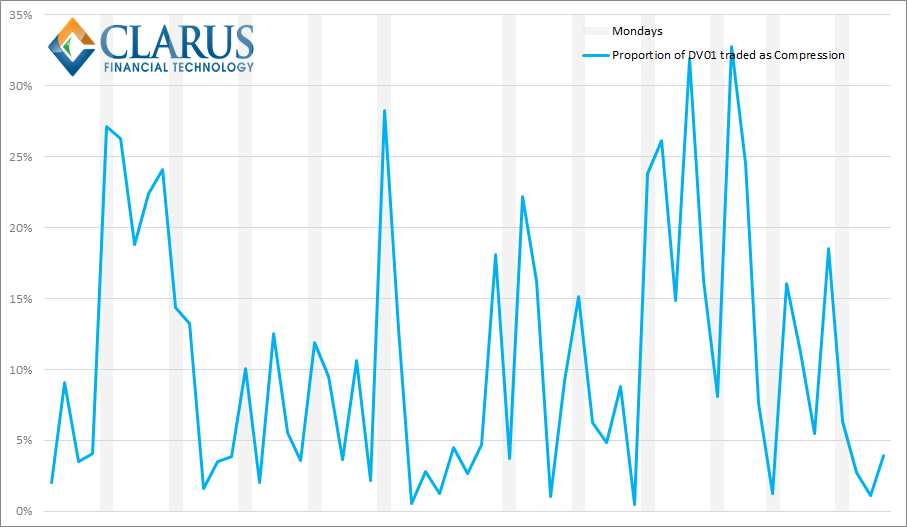
Just to re-iterate what we said last week – the proportion of risk traded as part of a compression run on any given day is an extremely volatile time-series. Our three-month daily history is shown below:
Showing that:
- Peak compression volumes per week used to occur on Mondays.
- This was only true at the beginning of our sample period. Has the introduction of BSEF’s offering during October changed this market behaviour?
- Generally speaking, the same holds true as we commented last week – it is volatile, with no discernible pattern to activity.
In Summary
Compression has been a significant portion of traded volumes over the past three months, accounting for over 10% of USD on-SEF volume by DV01. Block trades are twice as common within a compression run compared to vanilla trading, but it is hard to predict when compression may occur. Whilst compression is now a daily activity in USD Swaps, volumes vary dramatically day-to-day – highlighting the importance of analysis to understand volume peaks and troughs across the universe of SDR data.