A typical month in swaps? Far from it! These were the highlights:
- A record ever month for SEF trading.
- A big increase in client flows.
- The data suggests that some clients used the IMM roll to trade the CME-LCH basis, in particular on Tradeweb.
- Bloomberg saw some huge compression flows in MAC-dated swaps after the IMM roll.
- Consolidation of the year to date rankings in the Dealer-to-Dealer market.
USD Swaps On-SEF
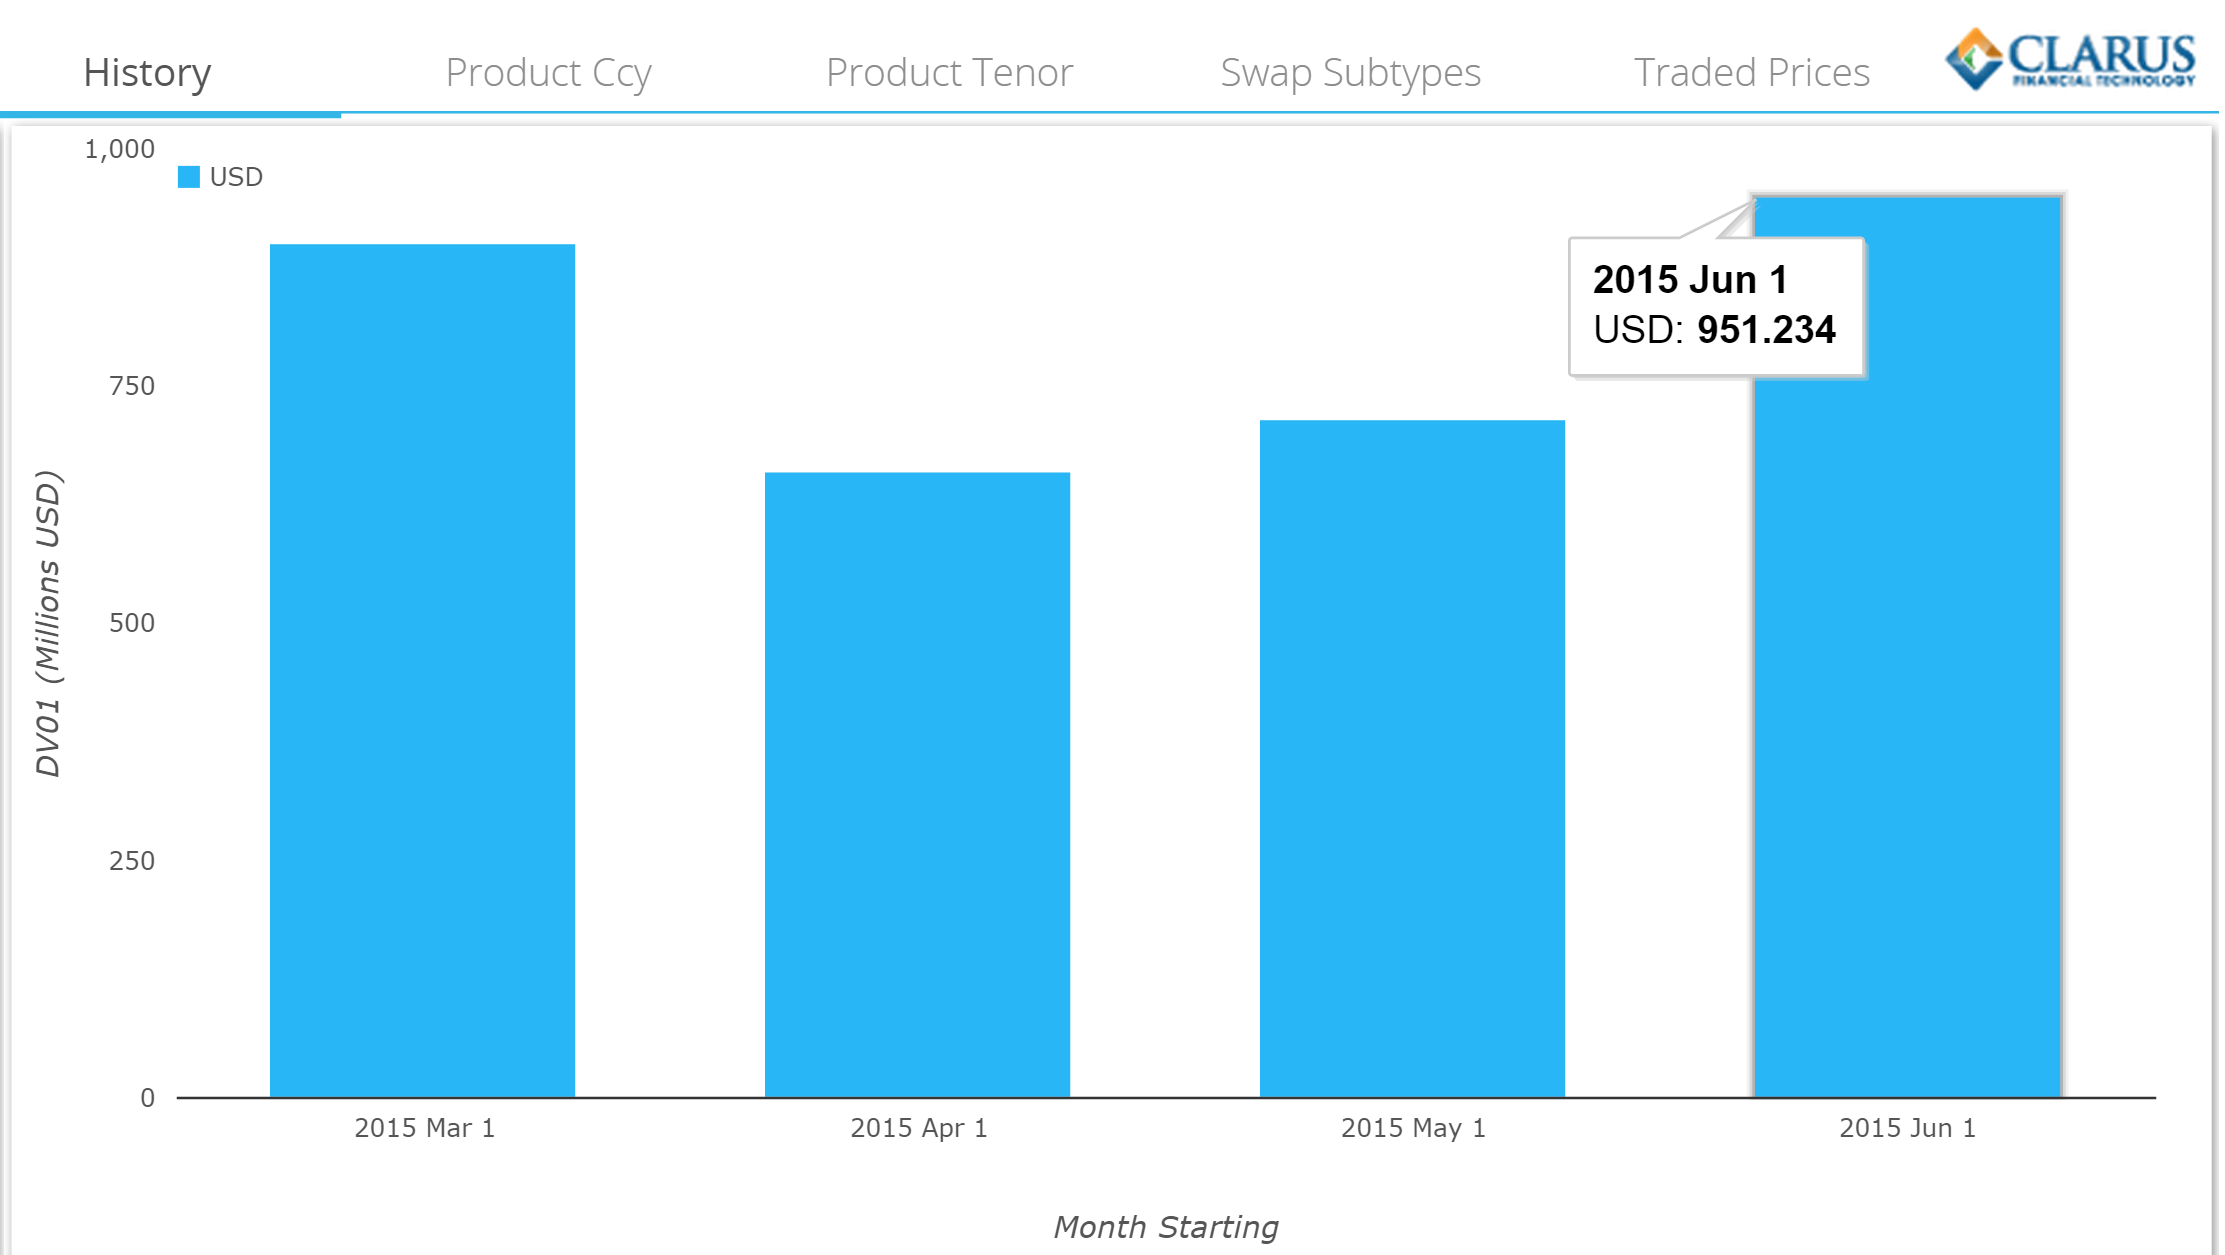
SDRView shows record volumes on-SEF as measured on a DV01 basis YTD during June. By extension, we can therefore say these are all-time record on-SEF volumes.
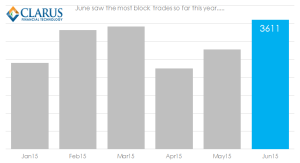 This month also saw a large amount of block activity, with the highest number of block trades so far this year.
Over two thousand of these blocks were transacted on-SEF. What this means is that SEFView shows an even higher total volume traded in June as this reporting is not capped by the block thresholds:
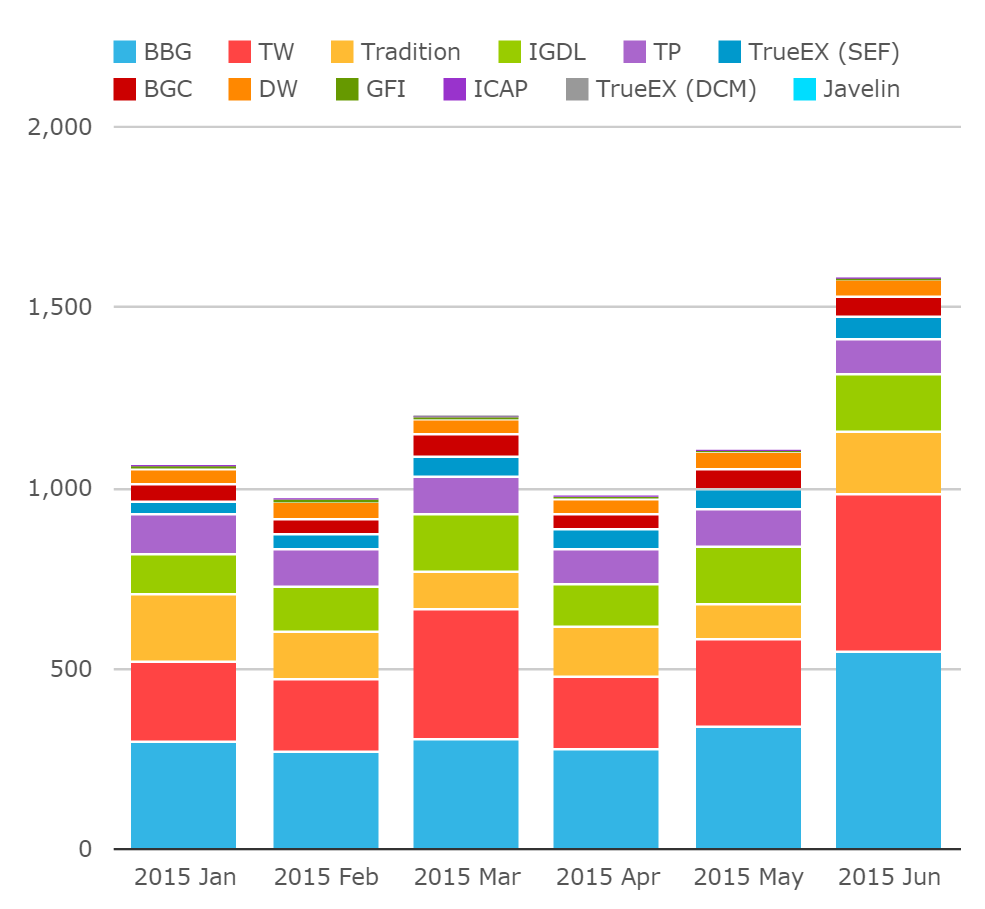
This is therefore the first time we have seen over $1.5bn in DV01 trade in a single month. And remember that is only for USD Swaps. So yes, IMM rolls distort the June figures, but that’s still a landmark month.
Dealer to Client Flows
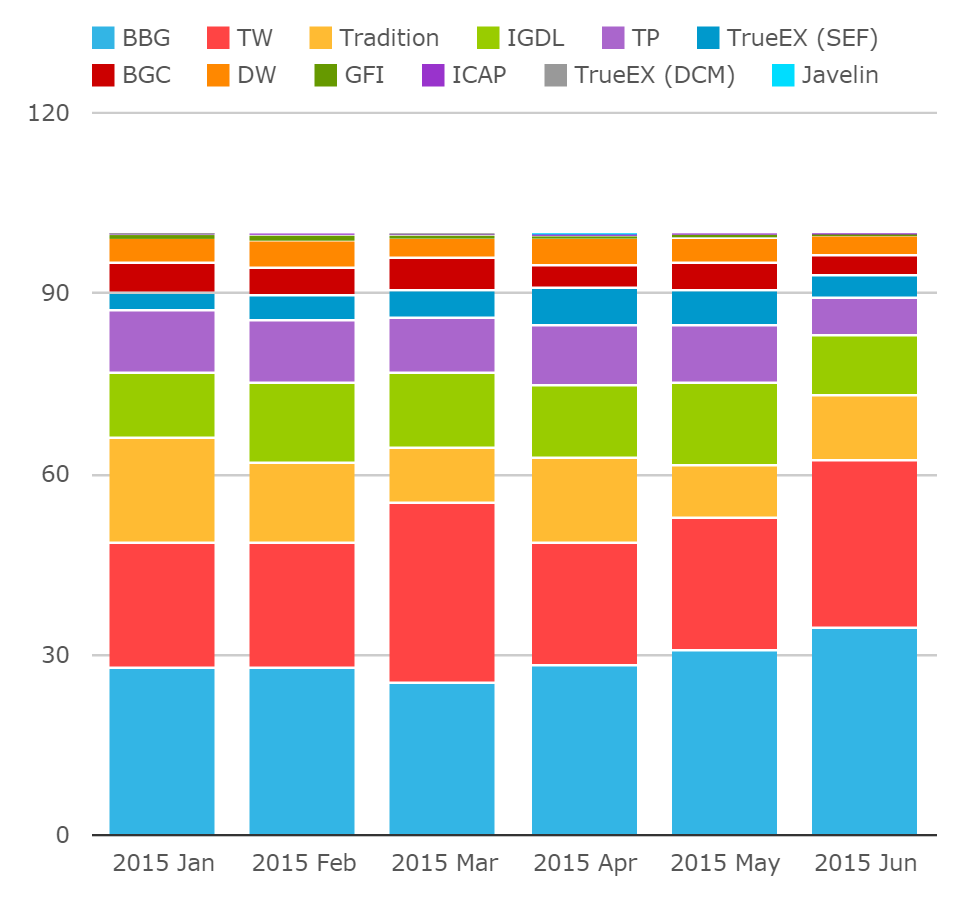
If we look at these same June figures, but from a percentage share perspective, we see that the Dealer to Customer platforms (BSEF and Tradeweb) killed it this month:
 A few points on the chart:
- June was the first time this year that the D2C market accounted for over 60% of market share in USD Swaps.
- We saw a spike in D2C market share in March as well – another IMM roll month.
This last point raised a couple of questions for me:
- Do people prefer to roll positions electronically on these platforms, and hence they attract an outsized market share in IMM roll months?
- We know that some customers have limited access to the dealer to dealer platforms. Are these customers also mainly trading IMM swaps? Do we therefore see them rolling large directional swaps every 3 months on the Dealer to Client platforms?
With these thoughts in mind, I went digging into our data sources to look at the roll in a number of different ways.
The IMM Roll
As per previous rolls, there are different ways of looking at this. To estimate volumes, we can take all swaps traded out of the June IMM date and match these with September IMM dated swaps of a corresponding tenor. We can either do this on an aggregate basis, or incorporate time-stamps and do so on a trade-by-trade basis. This latter approach allows us to identify the least risky roll approach as there is no meaningful market exposure, but is possibly over-reliant on (accurate) time-stamps. For USD swaps, it is worth considering the difference between the two approaches.
Using SDRView Pro, we see the following notional amounts of IMM-dated USD swaps traded before the roll:
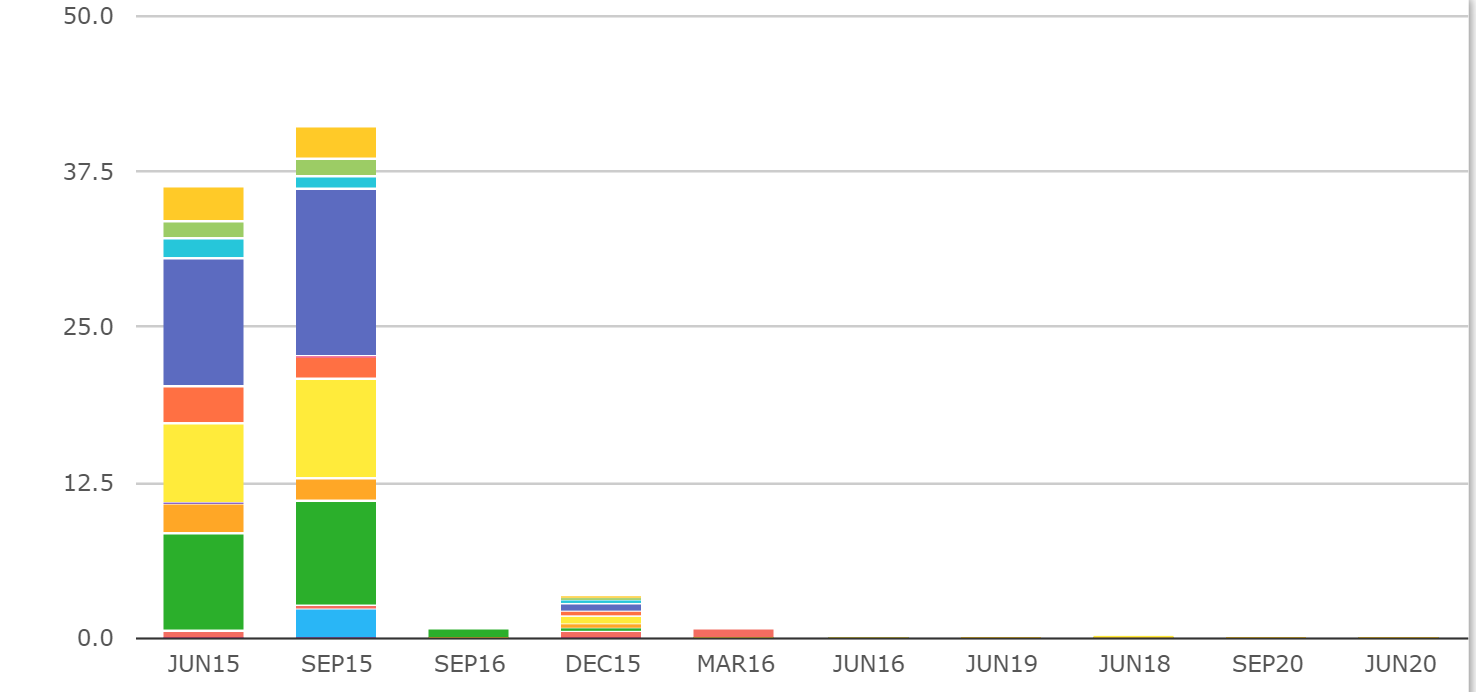
If we match June 15 volumes with the same tenors traded for Sep 15 (i.e. green with green, yellow with yellow etc. on the chart above), we estimate the following activity in DV01 terms:
- $28.74m DV01 of June 15 exposures were rolled into matching maturity Sep 15 exposures.
- Therefore, when we consider the reported total DV01 volumes, we need to subtract $57.5m (double the roll volume) to be able to make a fair comparison with non-IMM months.
- We include all trade types, such as compression, list, spreads and butterflies.
- Of the $28.74m rolled, we identify over $22.6m traded on-SEF.
- This analysis implies nearly 80% of IMM roll activity was transacted on-SEF.
If we repeat the analysis on a trade-by-trade basis via the SDRView Pro, we find a lower number – of around $17.83m. Remember this is inherently reliant on time-stamp accuracy, and given the large number of block trades we see this month, we are not surprised that a “riskless” timestamp-based measurement yields a lower number.
Nonetheless, neither measurement method yields a number that would significantly alter the picture for June when we are talking about a total market of $1.5bn in DV01.
IMM Rolls and CME-LCH Basis
We can also use SEFView to look at the IMM roll activity on a venue-by-venue basis. I did this to try and answer the following questions:
- Why did Tradeweb and Bloomberg have an even larger spike in market share this month – was it related to roll activity?
- Did the CME-LCH Basis volumes we saw from May drop-off the Dealer to Dealer SEFs and hence reduce their market share metrics?
With those two questions in mind, I noticed a potential “pattern” on the Tradeweb reports. Take June 8th MAC activity as an example:
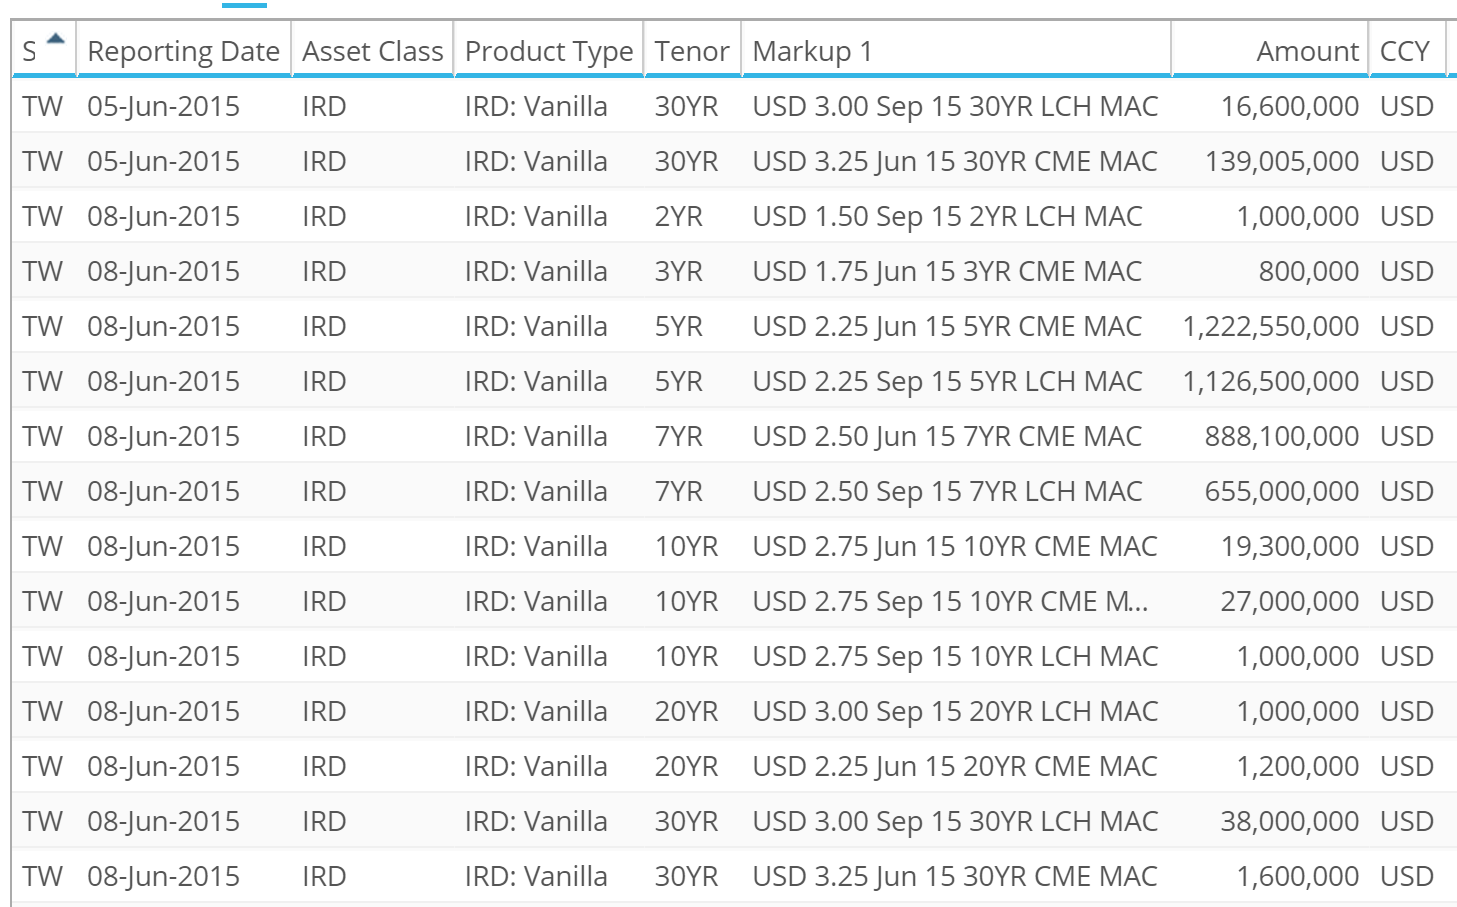
Two things struck me about this trade-list:
- The CME MAC swaps tend to have a Jun 15 start date.
- The LCH MAC swaps tend to have a Sep 15 start date.
- There is an uncanny match up of maturities by CCP. If a 5y CME MAC traded, the 5y at LCH also tended to trade.
So I wondered if this was just luck? Had I stumbled upon a particular day or flow in the market? So I went about looking at Tradeweb trade records for June and looking at their IMM & MAC activity. What I found was somewhat surprising:
- Total CME June 15 dated MAC activity: $23.3m DV01
- Total CME September 15 dated MAC activity: $5.88m
And conversely for LCH:
- Total LCH June 15 dated MAC activity: $0.57m
- Total LCH September 15 dated MAC activity: $19.22m
Interest piqued, I thought about trying to find the exact rolls – matching CME MAC trades for like-tenor CME MAC trades on the same day. And the same for LCH. Amazingly, I found very few of these trades. Instead, we see evidence in the data of cross-CCP rolls – e.g. trading June 15 5 year MAC at CME versus trading Sep-15 5 year MAC at LCH.
The sizes involved with these trades are significant:
- Total IMM rolls identified on Tradeweb are nearly $25m in DV01. This is equivalent to $47.4bn in notional.
- Of this total, $16.3m in DV01 looks like a switch from CME to LCH positions. In notional terms, this equates to $24bn.
CCP Basis Volumes
So does all of this mean that clients have been using the opportunity of the IMM roll to transfer positions from one clearing house to another? Maybe. Our data isn’t conclusive – and we have found this pattern because we went looking for it. But the evidence within the data is pretty compelling, building on Amir’s observations last week regards CME and LCH volumes in June.
Additionally, $24bn of CME-LCH basis would put Tradeweb at the top of the tree in terms of volumes traded. For example, even when we assume that all CME swaps traded at Tradition are due to CME-LCH basis trades, we find a notional traded of $17bn for the whole month of June. Remember that in May we estimated Trads enjoyed a 57% market share in the fledgling CME-LCH Basis swap market.
We can use that Tradition data point to assume volumes in the basis have remained strong in the Dealer to Dealer space as well. $17bn would be a high-water mark for Trads in terms of total basis traded in a month, adding more weight behind the idea that customers have used the IMM roll to transact basis trades – the hedging of which has ended up in the dealer-to-dealer market.
SEF Market Share
If this were a typical IMM roll month, I would argue that we should strip out the IMM roll activity from market share figures to give a more accurate representation of liquidity per venue. However, given the analysis above, it increasingly looks to us that the IMM roll this time was not such a “riskless” transaction. Indeed, many accounts may not have seen this particular roll as a simple portfolio maintenance exercise. Therefore, whilst we will strip out Compression figures as always, I will leave the IMM roll volumes in for this month.
Feel free to contact us and let us know if you think that is a fair assumption to make.
For Q215, DV01 volumes across USD, EUR and GBP Swaps are shown below per venue, with Compression volumes stripped out as per our previous assumptions.
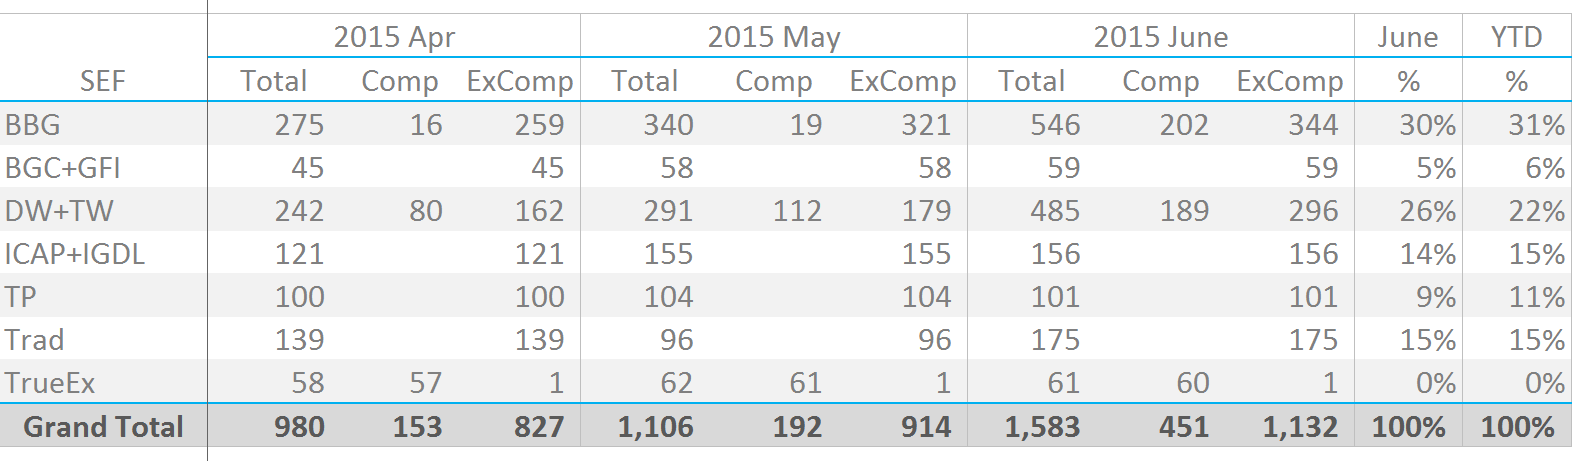
Showing:
- Tradeweb had a big increase in market share for June at 26% versus 22% year to date.
- Bloomberg and Tradition maintained their market shares around 30% and 15% respectively.
- The fact that Bloomberg don’t show the same increase as Tradeweb in market share this month suggests that either they did not see similar MAC flows or;
- Something else is going on. Bloomberg saw a HUGE jump in Compression volumes of more than ten times May 2015 figures. Do they count some of the IMM roll activity as Compression on their reports? This seems unlikely, as virtually all of this activity occurred after the roll date.
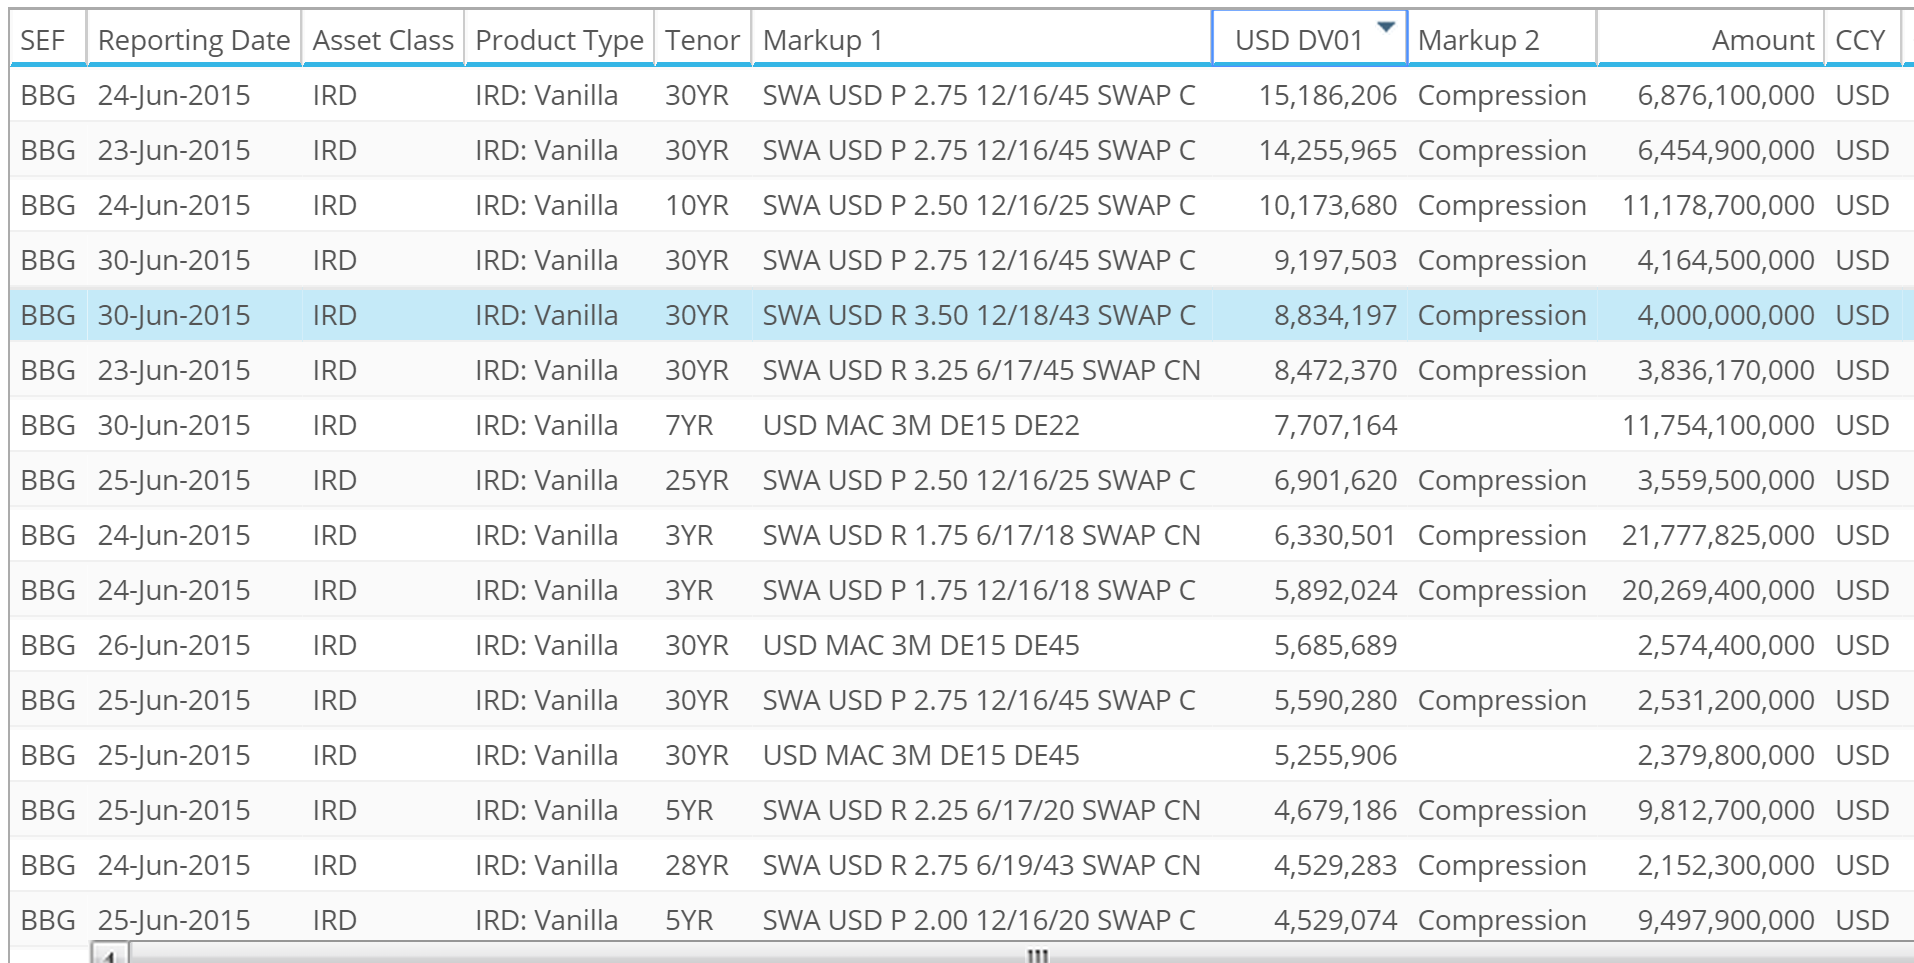
- Some huge size Compression trades are included in the Bloomberg report. All of them look suspiciously like MAC trades, and yet are not reported as such by Bloomberg. Very strange. But just have a quick look at the sizes we are talking about – $15m in DV01 for some trades!
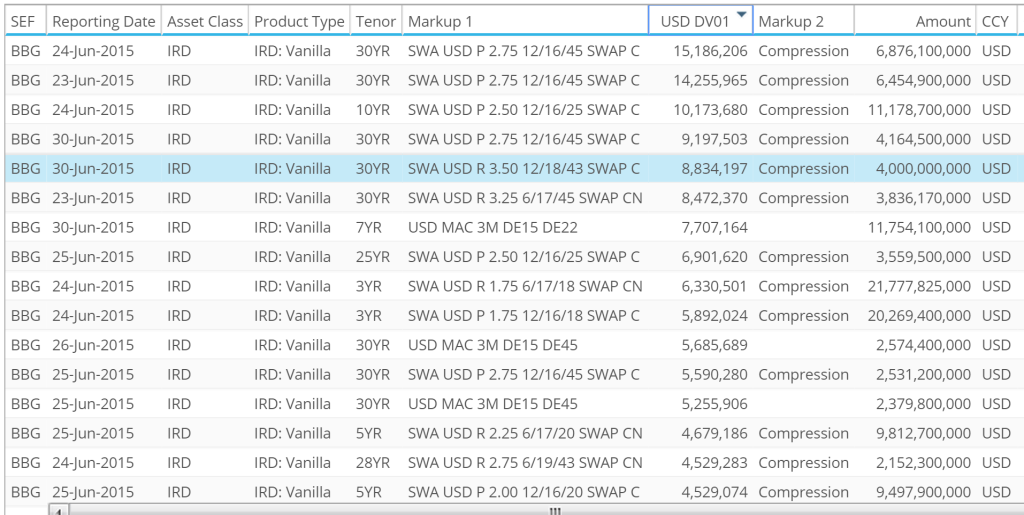
- Sadly, Bloomberg do not identify whether the trade is done at CME or LCH.
- This huge increase in Compression activity at Bloomberg needs to be monitored. It may alter our assumptions about Tradeweb compression volumes. To help the market, we would like all venues to follow the TrueEx and Bloomberg lead and separate Compression volumes from vanilla transactions.
- TrueEx continued to record impressive volumes in the Compression space, even in the face of this increased competition from Bloomberg. Volumes were generally flat month-on-month, meaning they are consolidating their gains made year-to-date.
- One last word on the CME-LCH switches that we identified at Tradeweb. It is possible that these were done as part of their Compression offering as well. Should we therefore also strip these volumes out from their market share? Answers on a post-card please!
- Finally, in the Dealer to Dealer space, our numbers show that Tradition just managed to grab the number one spot from ICAP this month, leaving them level-pegging at 15% market share each on a YTD basis.
- Tulletts are still in third place, although they did not enjoy a good June compared to their peers. BGC/GFI are in fourth with a 5% market share this year.
A Closing Comment
All of this happened before the Greece “no” vote, which we assume will lead to continued volatility during July.
Our comprehensive sources of data have revealed a number of interesting lines of investigation this month which just go to show the importance of having a holistic view of the markets. It is transparency like this that lets us demystify what is going on. That can only be a good thing during times of market stress.