In a new line of analysis for these blogs, we’ve been working on a first cut of data that expands upon the “trade types” that we identify. I think all traders and market participants will agree that there is inherent value in being able to identify whether a particular trade is an outright, one leg of a spread – or one leg of a spread within a butterfly.
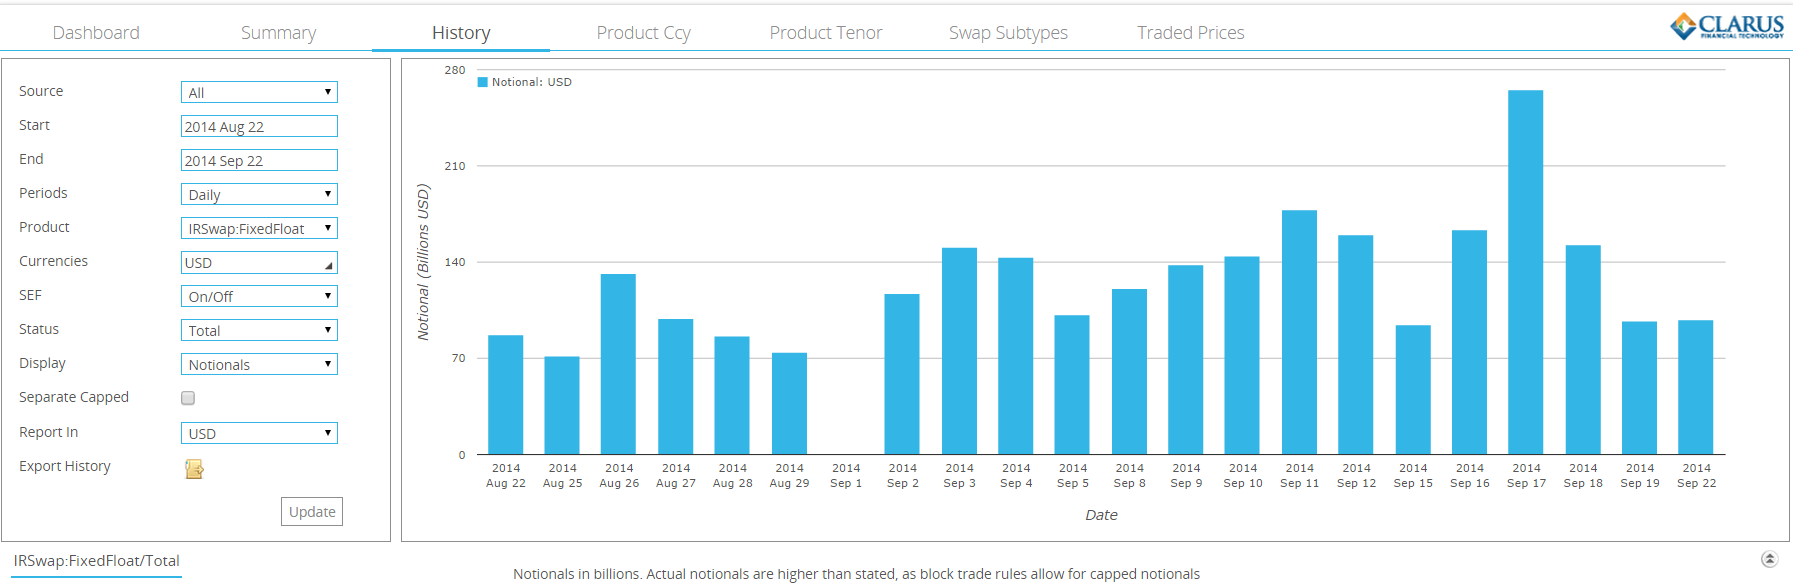
As ever, we import the day’s data into Excel using the Clarus API. We first need to have a decent starting day, so let’s take the previous Fed meeting on September 17th, when we can see volumes were largest in USD Swaps:
To start, we’ll focus on the low-hanging fruit. We therefore use the subset of swaps that are spot starting, on-SEF trades. This gives us the “cleanest” set of data possible. It also has the kind side-effect of offering predominantly electronically-executed packages, which have the same time stamp – if only it were really that simple to identify all “package” transactions!
This offers the following trade population:
- 801 USD Swap trades vs 3m Libor
- A total DV01 of $32.9m
- 44% of the total DV01 across all IMM, FWD and Old trades done on that day
- Up to 67% of DV01 traded in key maturities such as 30y. This can be seen below:
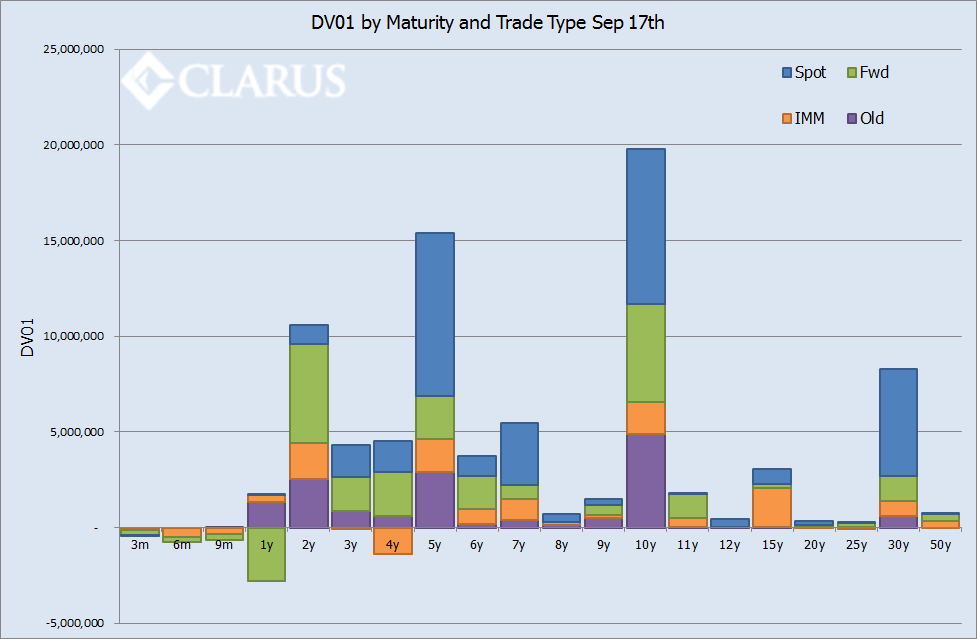
But the point of this blog is to look at which of those trades are really “outright” and which are traded against at least one other maturity on the curve. The methodology is far from trivial – we first identify spreads using an iterative process through different combinations of trades offering matching DV01s and matching time stamps. We then apply differing levels of leniency to arrive at a final classification. To keep things simple (!) we classify the belly of a butterfly as belonging to two spreads, in half the size.
For this particular day, we find that out of the 801 trades:
- 388 (44%) are part of a spread.
- $14.9m (45%) of the DV01 traded was related to spreads.
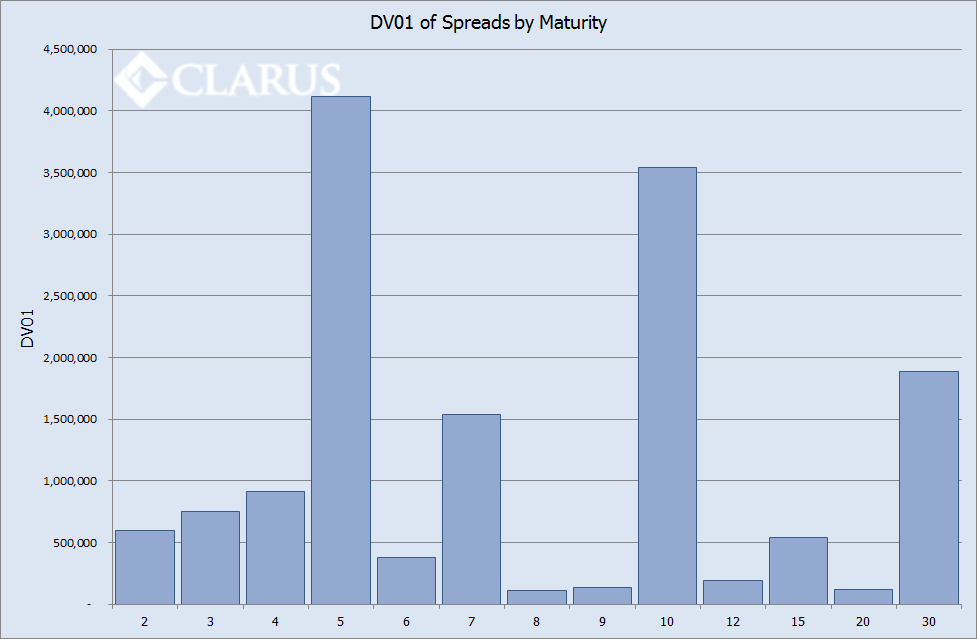
The sheer number of combinations traded is quite baffling. And here we were thinking it was all PCA driven now-a-days! We see that 5 years and 10 years are the most active legs as part of a spread – particularly noticeable when we look at the DV01 chart:
It is also important to put these totals in perspective, given that we know 5y,10y and 30y trade far more frequently and in larger size than any other maturities. Therefore, let’s put these totals as a percentage of the total DV01 traded (for Spot trades) in each maturity:
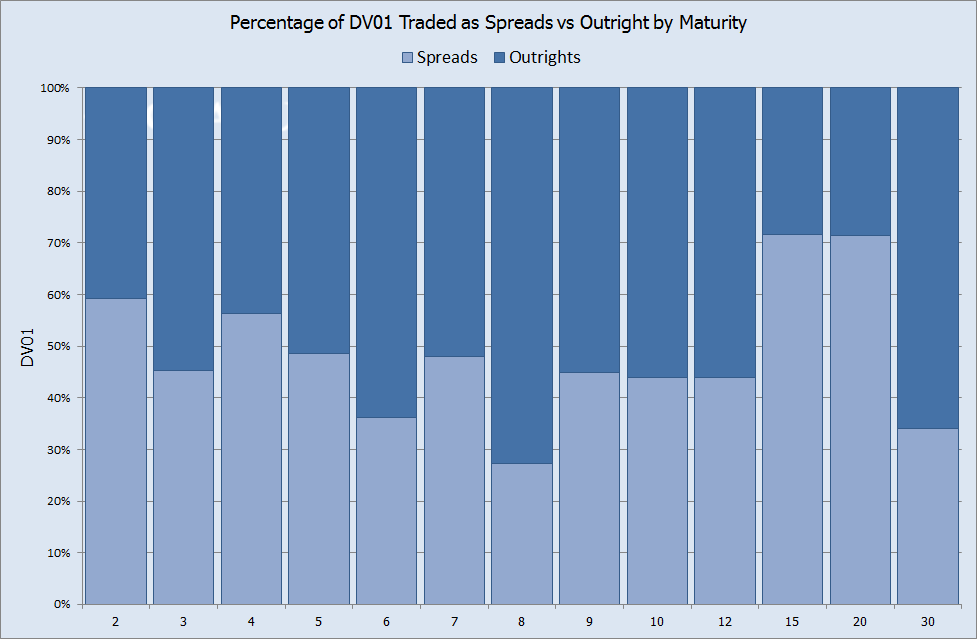
Remember that overall, about 45% of all DV01 was traded as a spread. We can therefore see that 2y, 15y and 20y deviate significantly from this “benchmark”.
This analysis is pretty “raw” for now, but writing the logic to ascertain which are spread trades is somewhat comparable to reverse engineering a CLOB, so give us time to refine it over the coming weeks.
And finally, whilst many articles are sceptical about the uptake of CLOB trading, the data clearly shows that CLOBs are taking-off. We can see strings of 12 or more swaps being transacted (virtually concurrently) as different combinations of swaps and butterflies. Knowing, as we do, that these packages must be inherently delta neutral, we can also make a significant deduction as to which are the buys and which the sells. But that is a story for another day…..