
- The price of liquidity in USD swaps has risen in 2021 relative to 2020 when measured by Price Dispersion.
- However, USD Swap markets saw huge volumes traded during February 2021, showing that liquidity has still been available.
- Our analysis shows that the price of liquidity has increased as volatility increased.
Everyone is talking about the bond market sell-off
I noticed this on Bloomberg this week, and therefore revisited our own analysis on liquidity in USD swaps.
Bloomberg look at bid/offer spreads in US Treasuries. Our analysis instead uses post-trade transparency data to estimate the Price Dispersion each day. This represents the volume-weighted average difference of each trade to the day’s VWAP. The theory being that as liquidity tightens, the price dispersion goes up. Trading becomes less continuous, more sporadic and at a larger spread of prices. Another way of saying this is that volumes alone give an indication as to the availability of liquidity whilst price dispersion measures the price of this liquidity.
Let’s see what the 2021 data shows this time.
Liquidity in USSW10 during 2021
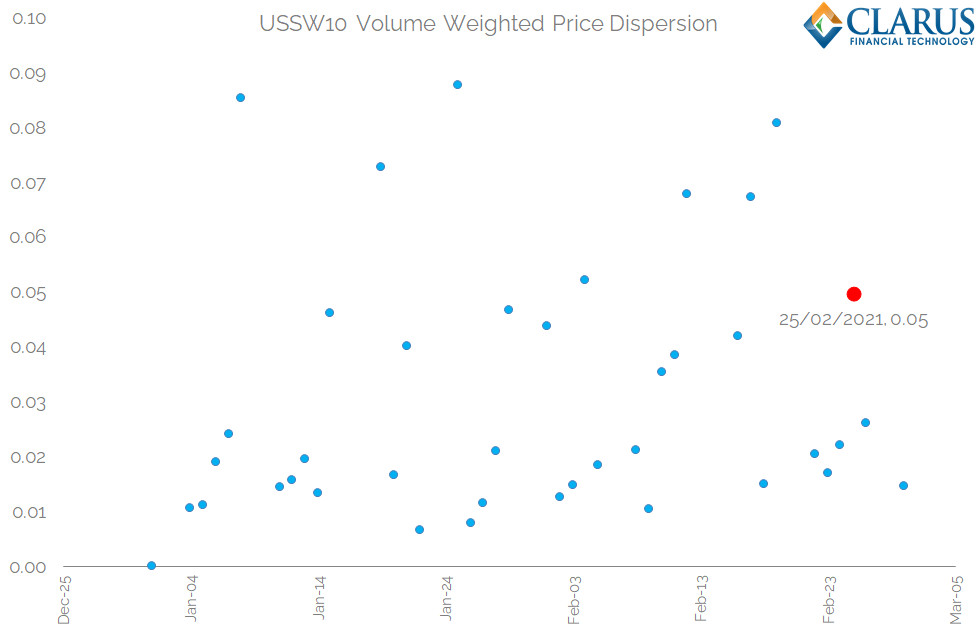
The chart below shows the price dispersion (aka the Clarus liquidity proxy!) every day in 2021 for 10 year USD swaps:

Showing;
- Every day saw price dispersion below 0.1 basis points.
- There are some outlier days, such as the 24th January, which saw the highest price dispersion (i.e. the most “expensive” liquidity conditions) of the year at 0.09 basis points.
- When yields spiked, to 1.6% on 10Y USTs, during volatile markets on 25th February, we also saw elevated price dispersion in swaps. Price Dispersion jumped to 0.05 basis points in what can best be described as choppy trading!
- However, the average daily price dispersion in January was 0.03 basis points. The average daily price dispersion in February was….also 0.03 basis points!
- From a perspective of actual trades transacted, it is therefore hard to argue that the price of liquidity/liquidity conditions have seen a fundamental change since the beginning of the year.
Comparing 2021 to 2020
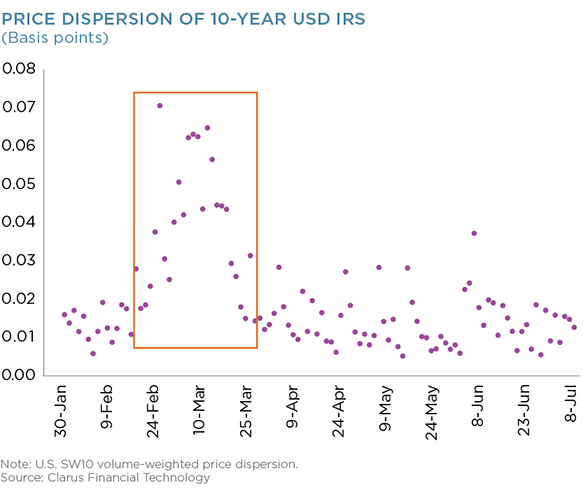
- For reference, when we ran the identical analysis for the first half of 2020, we saw a clear jump in Price Dispersion during the March 2020 “pandemic volatility“:
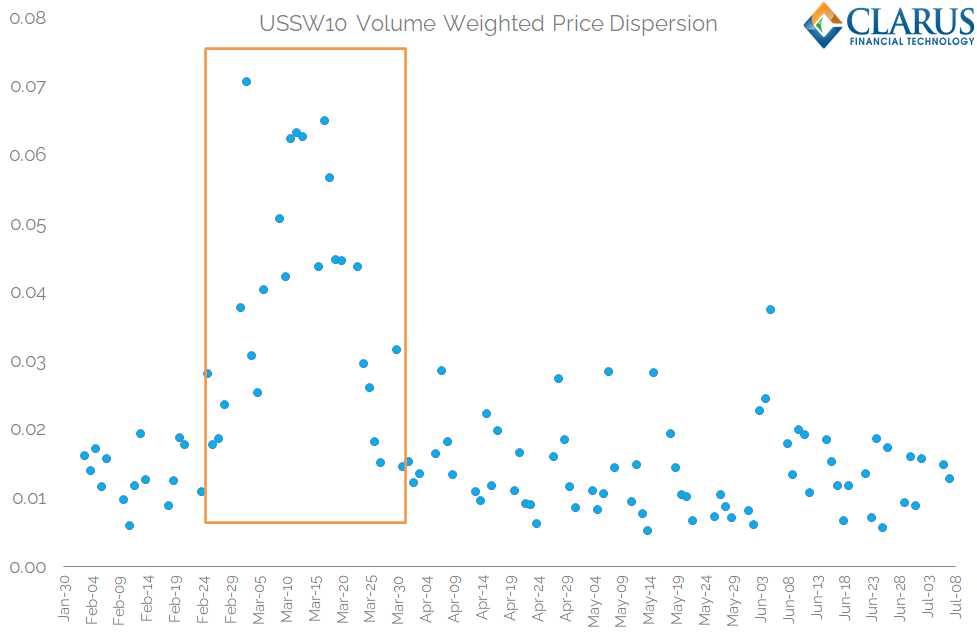
Comparing H1 2020 to 2021 so far, it looks like Price Dispersion has increased. For example, the average Price Dispersion in June 2020 was just 0.01 basis points. In the worst week of March 2020, this jumped to 0.06 basis points.
Comparing the two charts suggests that the price of liquidity for ten year USD Swaps is now higher in 2021 than it was for most of 2020.
One to monitor, particularly in light of today’s FT article on UST liquidity:
Volumes in USD Swaps
One may assume that tighter/more expensive liquidity conditions leads to reduced volumes in USD Swaps. Of course, countering this is the sheer size of the sell-off we’ve seen this year, leading to a lot of repositioning (volatility always leads to increased volumes).
But first, a health warning! Analysing SDR volume records is complicated in 2021 because:
- Some FRA trading, even in USD, has now transitioned to Single Period Swaps. This means that we see more short-dated swaps being reported to SDRs (less than one year, and mainly 3M tenors).
- This distorts volume data when looked at in notional terms.
- The same is true for SEF trading.
- You therefore need to analyse volumes in DV01 terms. This is exactly what our Clarus data tools offer you.
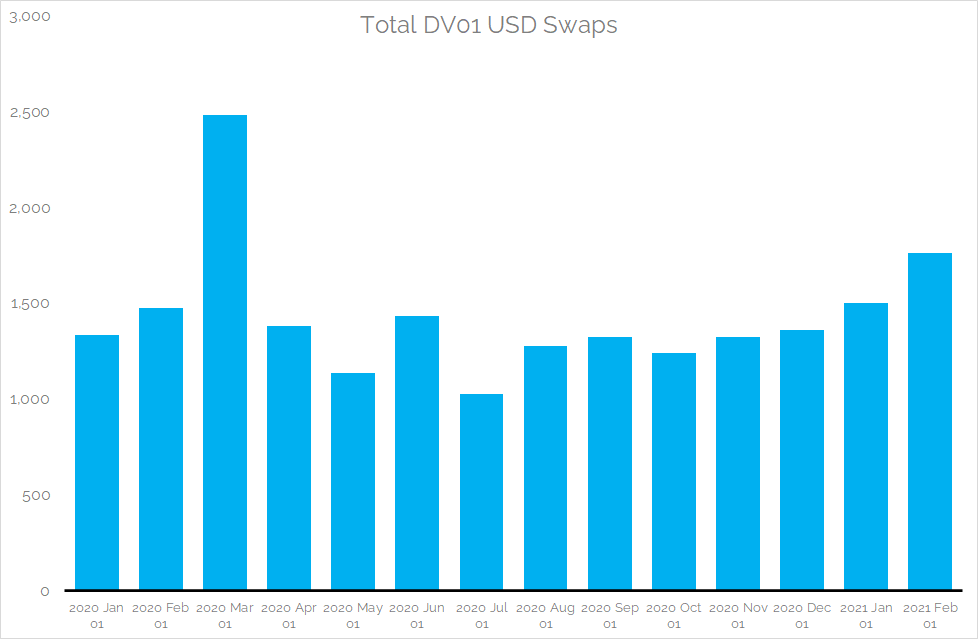
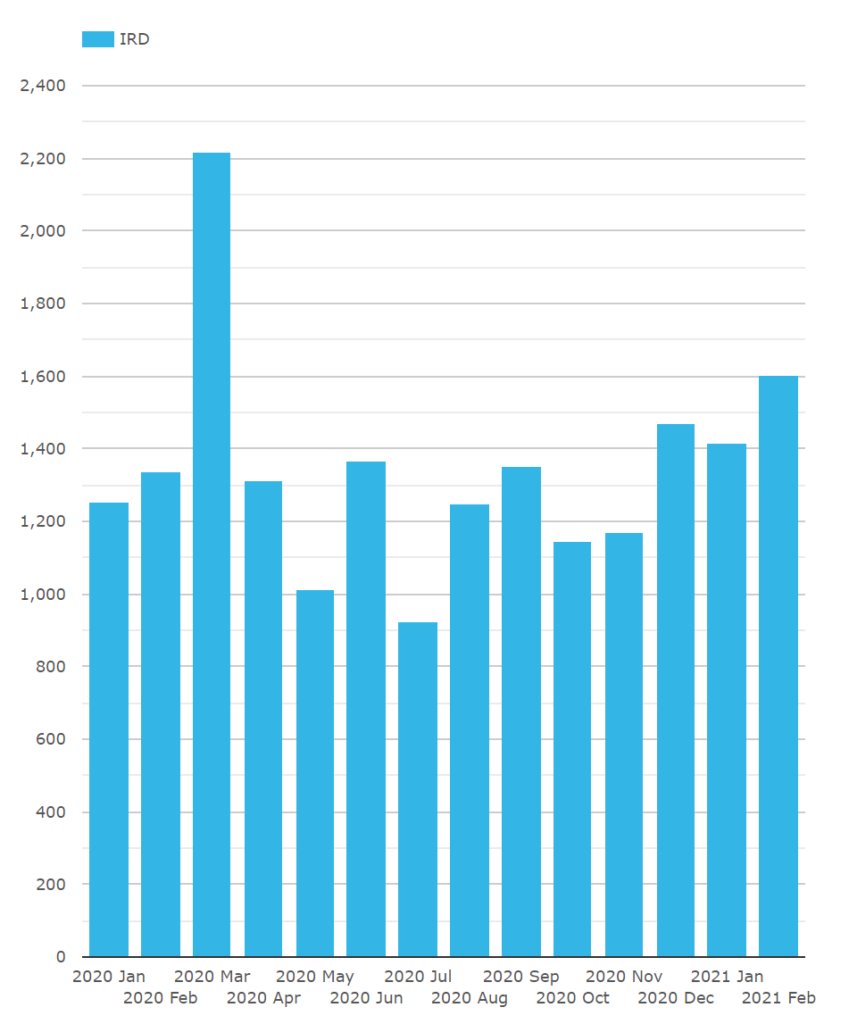
Therefore, we present volumes in USD Swaps in the SDRs expressed in DV01 terms:

Showing;
- February 2021 saw the largest volumes of USD Swaps reported to SDRs since the March turmoil last year.
- This makes February 2021 one of the largest volume months we’ve seen on record.
- Based on capped notional amounts, $1.76bn of DV01 traded.
- However, volumes in February 2021 were still 30% lower than March 2020.
We also saw a lot of block trades last month, with 3,904 capped notional trades reported, again the highest since last March. However, looking at uncapped DV01 traded from SEFView, we still see that February 2021 fell about 28% short of the March 2020 records in USD swaps:

No matter, February 2021 will still go down as a huge volume month in USD swaps.
The Price of Liquidity and Execution Conditions in Swaps
As we concluded last year (see here and here) post-trade analysis of execution conditions shows that:
- Record volumes are consistently seen when market conditions are volatile and price dispersion measures head higher.
- Liquidity is still available when markets are volatile.
- As volatility increases the price of liquidity increases.
Simply put, market participants must pay a higher price for liquidity when markets are volatile. That seems fair to me.
In Summary
- Post-trade analysis suggests that the price of liquidity in USD swaps has increased in 2021 relative to 2020.
- Average monthly price dispersion has increased since H1 2020 from 0.01 basis points to 0.03 points in February 2021.
- When yields spiked on February 25th, Price Dispersion jumped to 0.05 basis points.
- Despite this, USD swap markets have seen extremely elevated volumes.
- Assessing execution conditions, we can state that the price of liquidity increases as volatility increases.