- Trading has continued uninterrupted across the markets that we monitor, despite the extreme levels of volatility we have seen over the past week.
- Transparency data shows that Rates, Credit and even Funding markets continue to function “normally” in terms of volumes transacted.
- Crucially, markets have not “seized up” during some crazy price moves.
- Market participants are able to take confidence that markets are continuing to operate, that trading in derivatives remains open and that liquidity is accessible. Post-trade transparency provides this confidence.
Yesterday, Matt Levine wrote;
[B]ut you could also perceive [the Great Financial Crisis] as an emergent phenomenon beyond the control of any individual human. Complex structures and systems interacted in unforeseen and unwanted ways to produce a crisis that nobody exactly predicted or understood.
I have been wondering recently if we might have learned that particular lesson of the financial crisis a little too well. When markets are going up, it is tempting to have some theory of why they might one day go down, and if the obvious economic news is good your theory will likely be arcane and esoteric. Esoteric theories can ignore or explain away the obvious news, and they make you sound smart, and they carry an implicit reference to 2008. “Sure unemployment is low and the economy is expanding,” you can say, “but have you thought about rehypothecation chains in the repo market?” It is a bit of a conversation-ender—no, no they have not thought about rehypothecation chains in the repo market!—and hard to disprove, and of course shadowy chains of collateral really did bring down the system in 2008 so you’d never want to dismiss this sort of theory.
And last week, Tracy Alloway tweeted:
To both I say “Transparency”!
I tend to agree with what Mark Carney has just said. The measures that have been put in place over the past decade mean that the financial system is part of the solution this time, NOT the problem:
Is This Time Different?
On the Clarus blog, we spend a lot of time writing about Derivatives. We couldn’t have written this blog before 2013, when public trade reporting began.
Derivatives markets were not transparent. Back in 2008, during the GFC, no-one knew what was actually trading. This could make every trade a lottery if you were not fully informed.
So, how does trade transparency help?
- It shows volume as well as prices. It is not terribly helpful hearing where people think prices are or what size may have traded. Market participants need hard data.
- It gives a clear sign of liquidity. Is average trade size constant, even if prices are extremely volatile?
- It removes information asymmetry. All market participants can be as well informed as possible.
- It removes “fake news” about phantom trades executing “off-market” that are whispered about and then sow seeds of doubt/fear/greed in market participants.
- During crisis conditions, it provides evidence as to whether markets are seizing-up (or not). This could be crucial during the RFR transition that we write about so much.
So What Has Traded in Rates?
First up, in case you have been living in a bunker recently, 10Y rates in the US have collapsed:
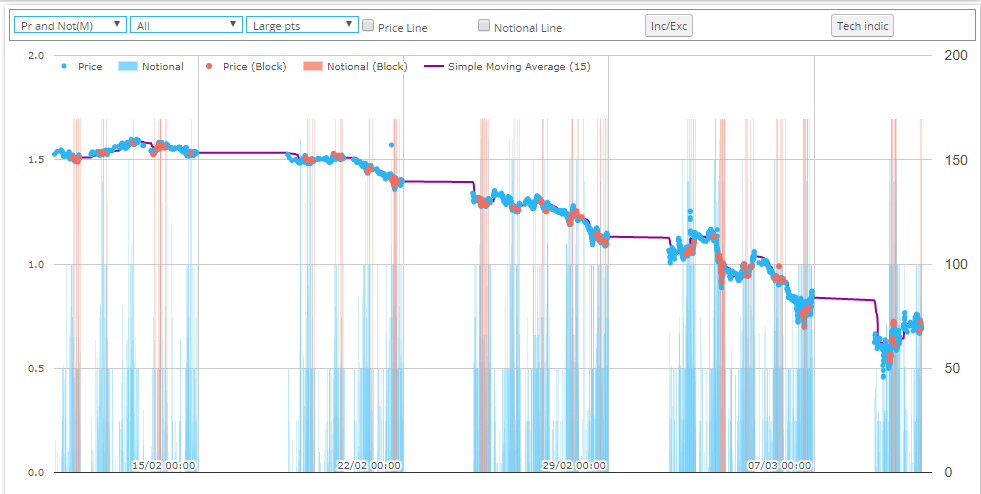
- The lowest recorded rate on a 10Y USD Swap printed at 7:33AM yesterday (9th March) morning in London at 0.45682%.
- We have only 3 swaps printing below 0.50% (for what it’s worth), with 10Y USD swap rates bouncing to as high as 0.75% during the trading day.
- That is a crazy wide range!
- For reference, we started the month of March with 10Y swaps above 1% and February saw rates above 1.50%.
However, as the vertical lines show, decent volumes have continued to trade despite the turmoil. The pink lines show block trades.
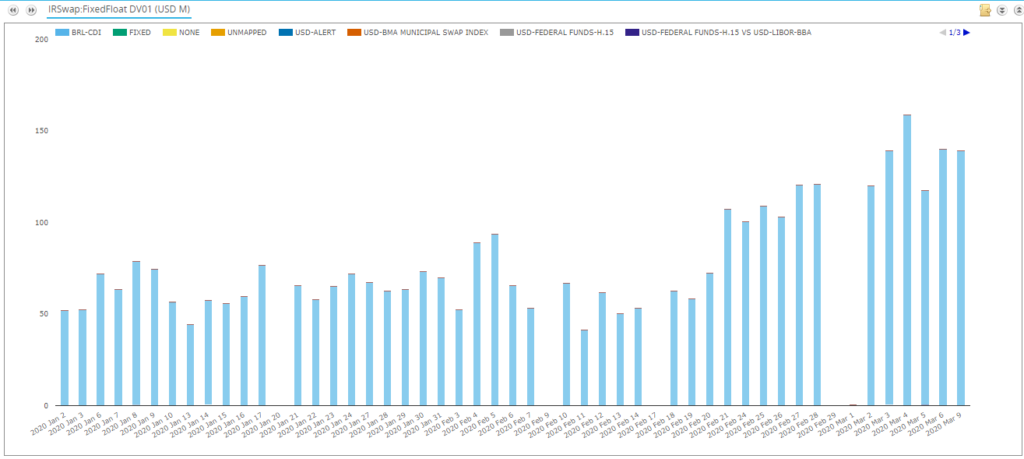
With the volatility in March, all of the record trading days in 2020 have been in the last few days:
Showing;
- DV01 traded of USD swaps and reported to US SDRs each day.
- March 4th was the largest day, with March 3rd (the day of the 50bp cut), March 6th and March 9th all pretty much level pegging in 2nd position.
- These elevated volumes show that market structure is working and that it is still possible to trade.
What About Credit Markets?
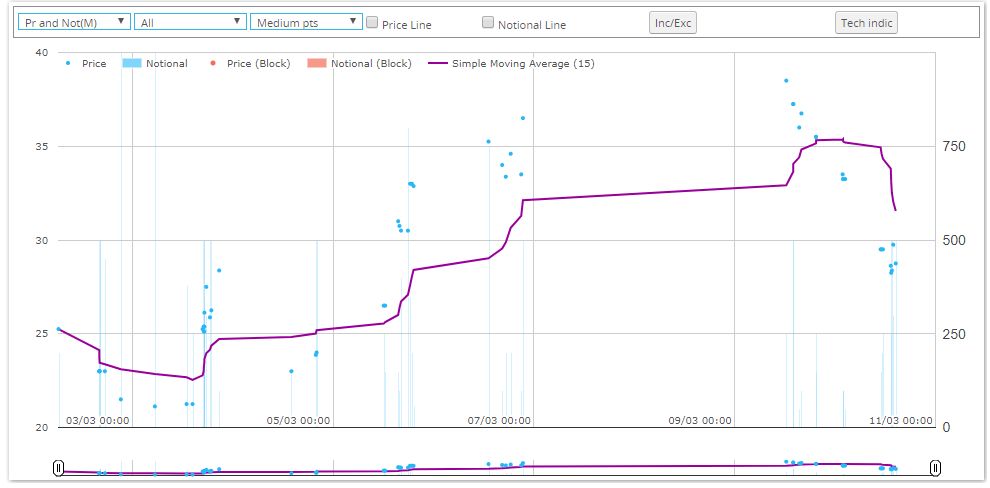
Credit markets also continued to function:
Showing;
- Trading for March 9th for CDX Investment Grade. (The precise series is the CDX.NA.IG.S33).
- Prices seemed to evolve in a pretty orderly manner throughout the day albeit with a huge gap from 83 basis points at the New York close on Friday to the first print at 116bp on Monday morning (!) (as reported by US Persons).
- It is striking how many block trades are transacted in CDX. That is one for another time.
So coming back to 2008 again, we know what is trading in Credit markets. How much, at what price and when. This is vital for confidence in the markets.
What About Funding Markets?
I can’t draw any comparison with 2008 without mentioning funding. Have LIBOR-OIS spreads blown wider in USD? Has Cross Currency Basis gone berserk?
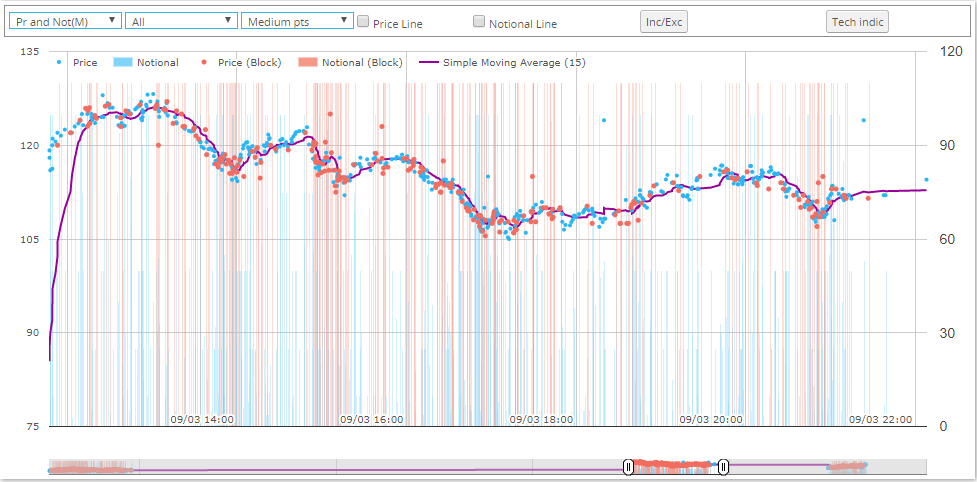
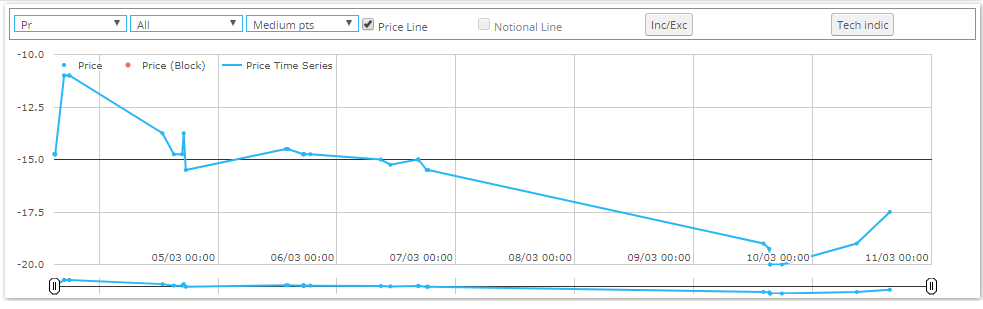
First up, USD LIBOR-OIS:
Showing;
- Actual traded prices (and notional amounts) in Libor vs Fed Funds for a one year maturity.
- The spread started March at 23 basis points and has since moved as high as 38.5bp.
- It has since retreated today (10th March) to now stand at 28.75bp.
- These are not signs that banks are in a desperate search for cash.
Note that the notional amounts yield surprisingly few block trades. Volumes are pretty small in these basis trades anyway, but volumes are at the highs of the year:
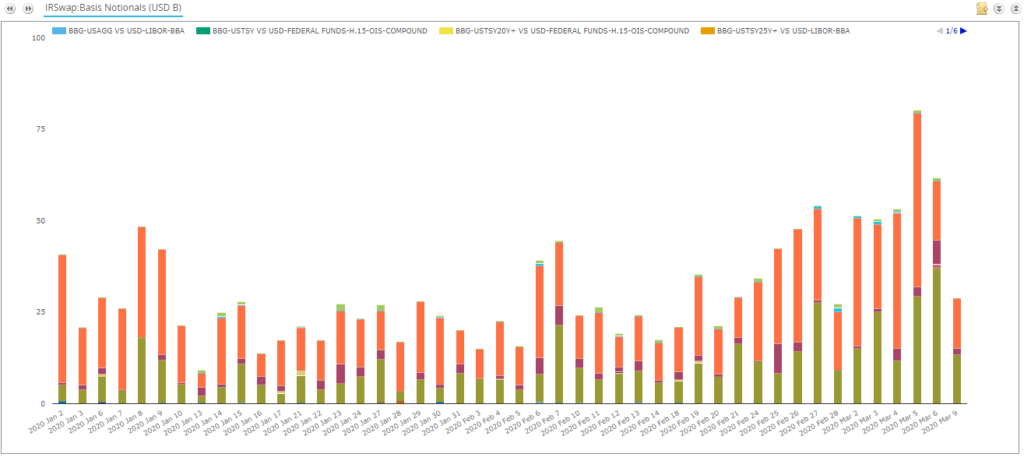
Showing;
- Volumes in all USD basis trades (e.g. 3s1s, 3s6s, Fed Funds vs LIBOR).
- The chart shows that the highest volumes this year have been seen over the last few days. No surprise there.
- Volumes have grown in both Libor vs Libor and Fed Funds vs Libor basis trades.
- In the case of a real credit crunch, I expected Fed Funds vs Libor volumes to grow much more than Libor vs Libor. Anyone else agree?
- Either way, this type of volume information just wasn’t available to us as traders during previous crises (including the European debt crisis). It remains fascinating (and highly useful!) to know what is actually trading.
And remember, whilst our charts might not look as pretty as the continuous time-series you see on a Bloomberg terminal chart, these are based on actual trades, not indicative quotes of where a market might be if a trade were to happen. It is a crucial difference – we are working with real trades here.
Cross Currency markets are also fairly calm at the moment. 1Y EURUSD has moved lower, but the moves are not of the magnitude we saw during the dash for dollars that was September 2008:
All of this doesn’t mean that there isn’t a dislocation lurking out there somewhere in the financial system. But we at least have the tools to look into it – at least for US markets.
At The Margin
Having said all that, we know what has traded, but we still don’t really understand the impacts of it all. The one big bit of data I feel we are missing is any timely information on margin calls. With mandatory clearing, with Uncleared Margin Rules, with better risk management all round, there must be much larger margin calls going around this week than we’ve ever seen before?
I don’t know how this data could be made available, but I do think the CFTC are on the right track requiring dealers to report the margin posted for uncleared transactions. I just wonder when and how this could be made public?
It would certainly be handy if the CFTC Cleared Margin Reports were available right now!
In Summary
- We believe that post-trade transparency is providing derivatives markets improved resiliency during these volatile market conditions.
- Whilst market prices are extremely volatile, trading activity is continuing uninterrupted, and volumes have scaled-up accordingly.
- Post-trade transparency is aiding price-discovery and confidence in our markets.