- Statistical measures show that USD swaps liquidity has deteriorated in the past six weeks.
- Specifically, price dispersion of 10Y USD swaps has tripled since early February.
- This is consistent with anecdotal stories in the press.
- However, we are still seeing higher than typical volumes transacted.
- Trading may be more difficult, but we are not seeing derivative markets seize up.
Liquidity
There has been plenty written on liquidity in the past month, mainly in the US Treasury market:

It is therefore a natural question to ask whether we have seen anything in the USD swaps market that mirrors these concerns over liquidity in broader markets.
We have used the concept of “price dispersion” on previous blogs to try and measure liquidity. This methodology draws on work done by the Bank of England when they analysed SEF trading, (original paper).
I have therefore monitored price dispersion over the past six weeks for outright, spot-starting 10Y USD swaps reported to the SDRs. Chart below:
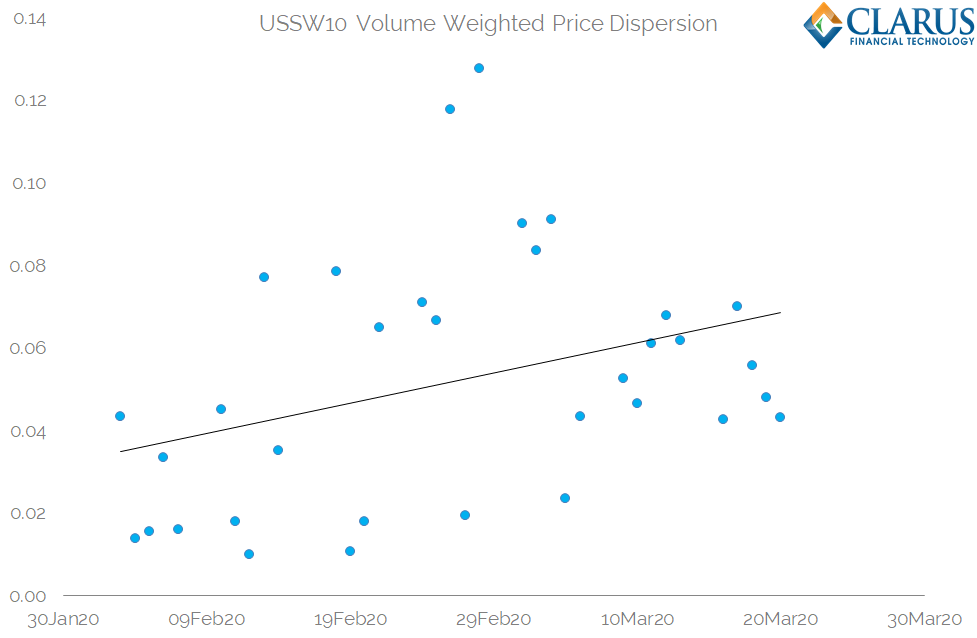
Showing;
- This is the volume-weighted difference of all 10Y swap trades to the average price printed on that day.
- In terms of monitoring “liquidity” we expect a more liquid market to have a lower price dispersion than a less liquid market.
- The chart shows that price dispersion has trended higher since the beginning of February.
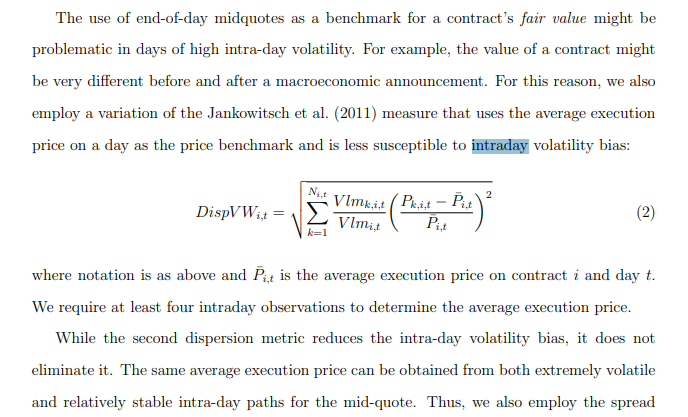
A quick aside to explain the exact methodology:
\( \tag {1} DispVW_{i,t} = \sqrt{\sum\limits_{k=1}^{N_{i,t}}\frac{Vlm_{k,i,t}}{Vlm_{i,t}}(\frac {P_{k,i,t}-\bar{P_{i,t}}}{\bar{P_{i,t}}})^2}\)
where;
\(N_{i,t}\) is the total number of trades executed for contract i on day t, e.g. how many 10y trades occurred on the 23rd March 2020? \(P_{k,i,t}\) is the execution price of transaction k, i.e. the price of a particular 10y trade on the 23rd March.
\( \bar{P_{i,t}}\) is the average execution price on contract i and day t, e.g. what was the average price of all 10y trades done on 23rd March.
\( Vlm_{k,i,t}\) is the volume of transaction k; e.g. the size of the 10 year trade we are looking at on 23rd March and;\(Vlm_{i,t}=\sum_{k}Vlm_{k,i,t}\) is the total volume for contract i on day t. e.g. the total volume of 10 year swaps traded on the 23rd March.
Is This Reduced Liquidity or Increased Volatility?
The authors of the BoE SEF report noted that this particular measure of price dispersion is sensitive to intraday volatility:
Well we’ve certainly seen a boat-load of intraday volatility in recent times! Below is the intraday chart of 10Y USD swaps over the past week:
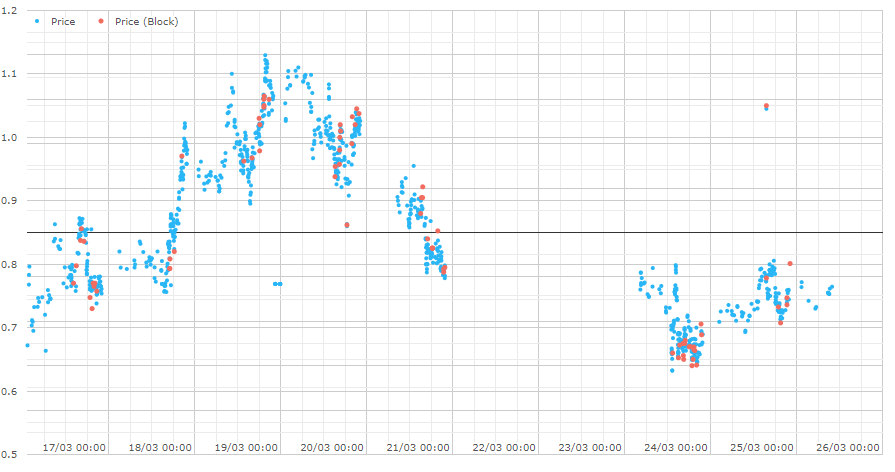
The key question is therefore whether price dispersion increases have “out-stripped” this increase in intraday volatility of the underlying? That is difficult to state unequivocally. Anyone with a statistical methodology to do so, please get in touch.
What we can say is that, yes traded prices have been more disperse over the past month, on a volume weighted basis.
Price dispersion has roughly tripled in 10Y US Swaps since the beginning of February.
Whether this is due to wider bid-offer spreads or more intraday volatility, it does not matter too much.
Higher price dispersion means it is more difficult to assess, pre-trade, what price your trade will transact at. That means trading is getting more difficult.
The statistics back-up the anecdotal evidence of constrained liquidity out there.
Volumes in USD Swaps
As I have written recently, the benefit of post-trade transparency data is that we have clear evidence that trading is continuing to take place. Markets have not “seized up”.
Here are the notional volumes reported in USD swaps since February to US SDRs:
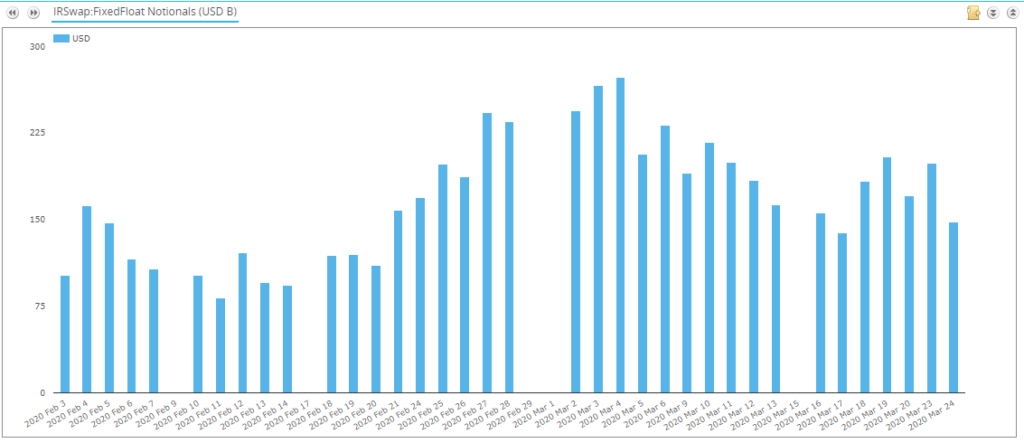
Showing that notional amounts peaked around early March, but that daily notional amounts are still higher than we saw in February.
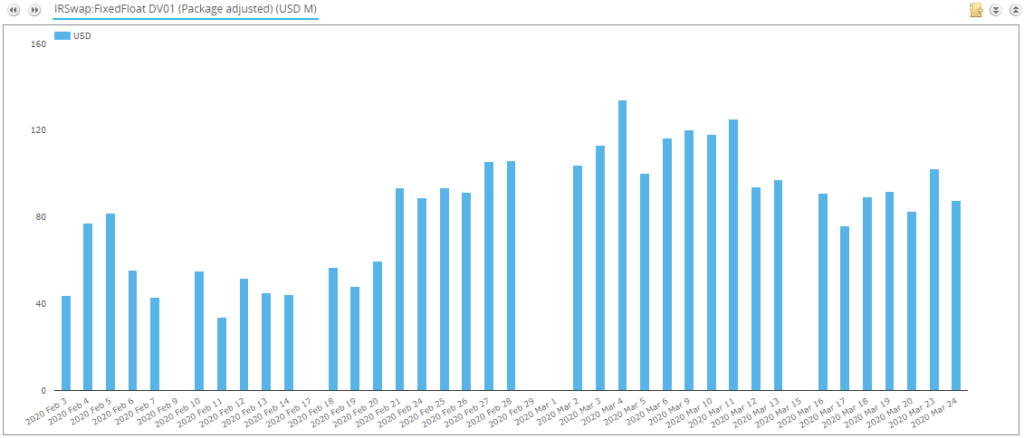
Transforming this into the DV01 traded shows that there has been an increase in the amount of risk being traded. This increase in trading activity is just as evident in long-dated products as it is in short-dated products:
Global Volumes in USD Swaps
Finally, turning the picture to look at global volumes transacted in USD swaps reveals how well the trading infrastructure is currently coping with the crisis.
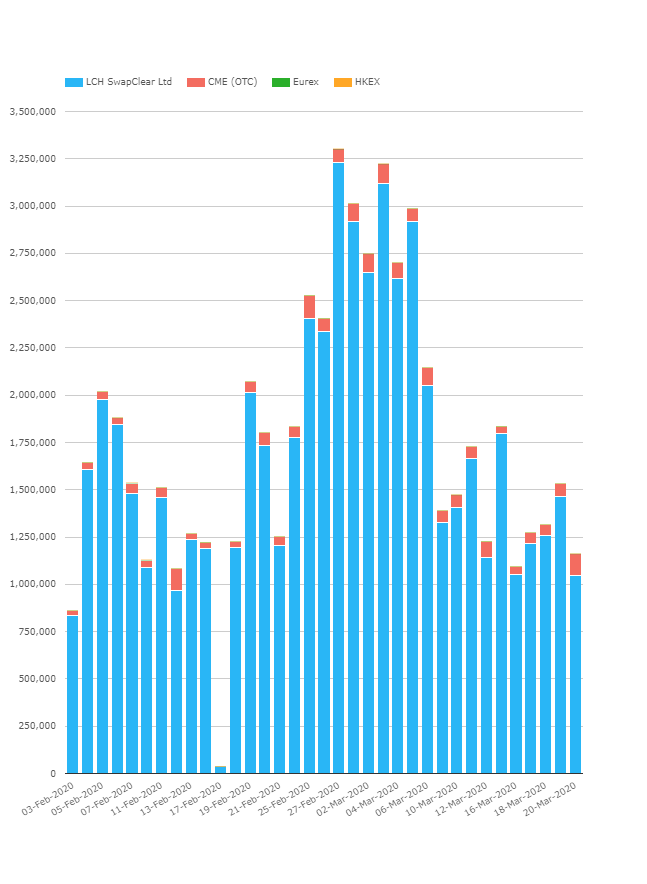
Showing;
- A massive scaling-up of daily notional volumes cleared at the end of Feb/beginning of March.
- Those volumes seem to have retreated pretty quickly into the middle of March however.
What is this telling us? Let’s look at the notionals by tenor:
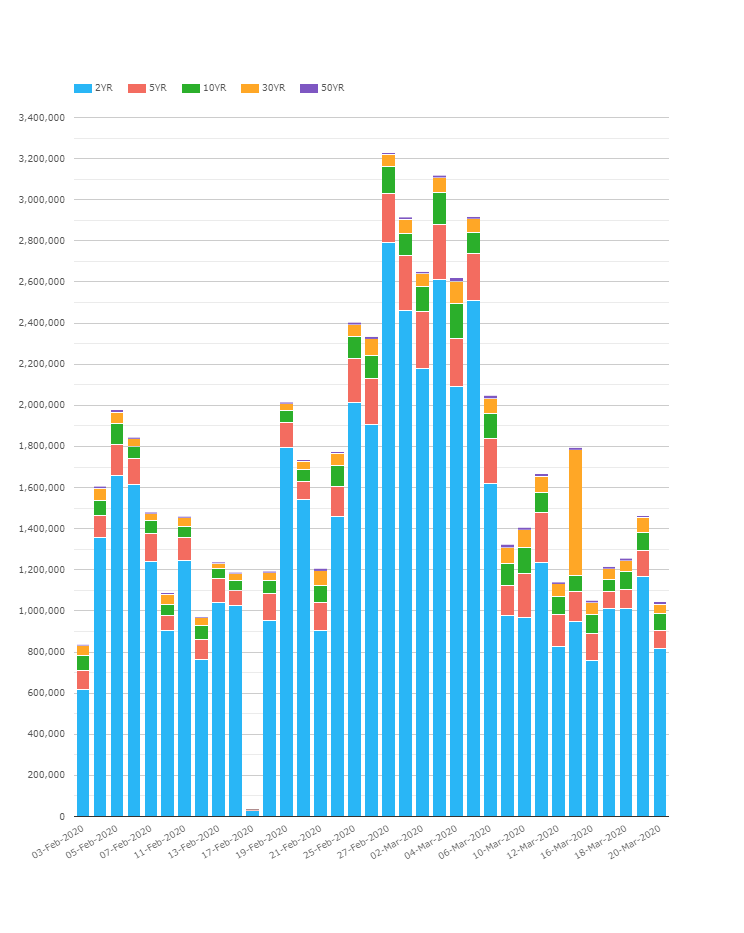
Even without translating into DV01s, we can see that almost all of the variability in notional cleared has been due to changes in activity in the short-end of the curve (the 2 year, blue bars).
In terms of our price dispersion analysis, I was interested to see how 10Y volumes in particular have evolved. Chart below:
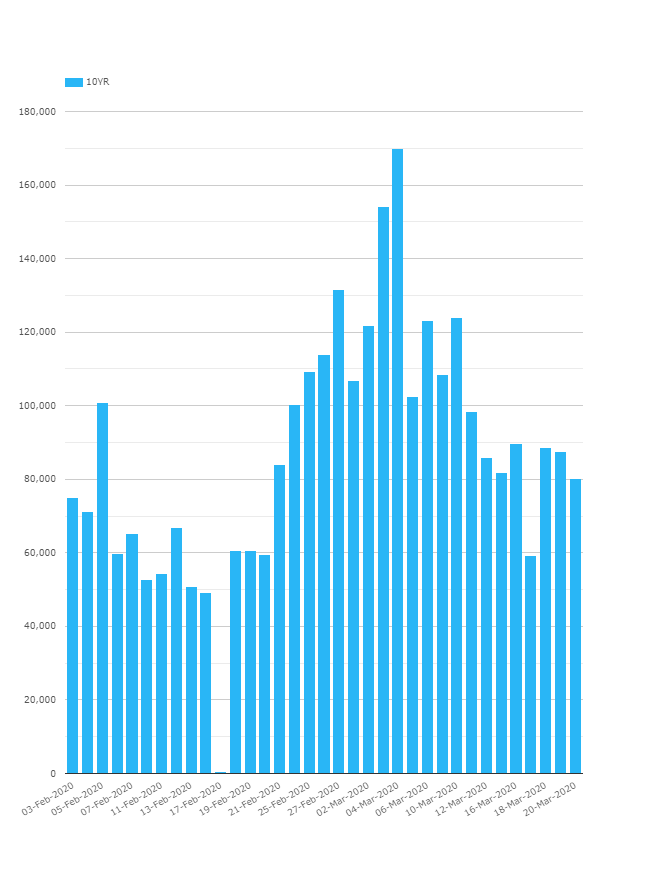
Showing;
- A similar pattern to overall volumes throughout the past six weeks.
- The rolling one-week average of 10Y USD Swap volumes was $71bn per day at the beginning of February.
- This nearly doubled to $133bn per day at the beginning of March.
- We are now back to $82bn average per day, still a 15% increase in activity.
We can also explore a bit further the rest of the long-dated tenors:
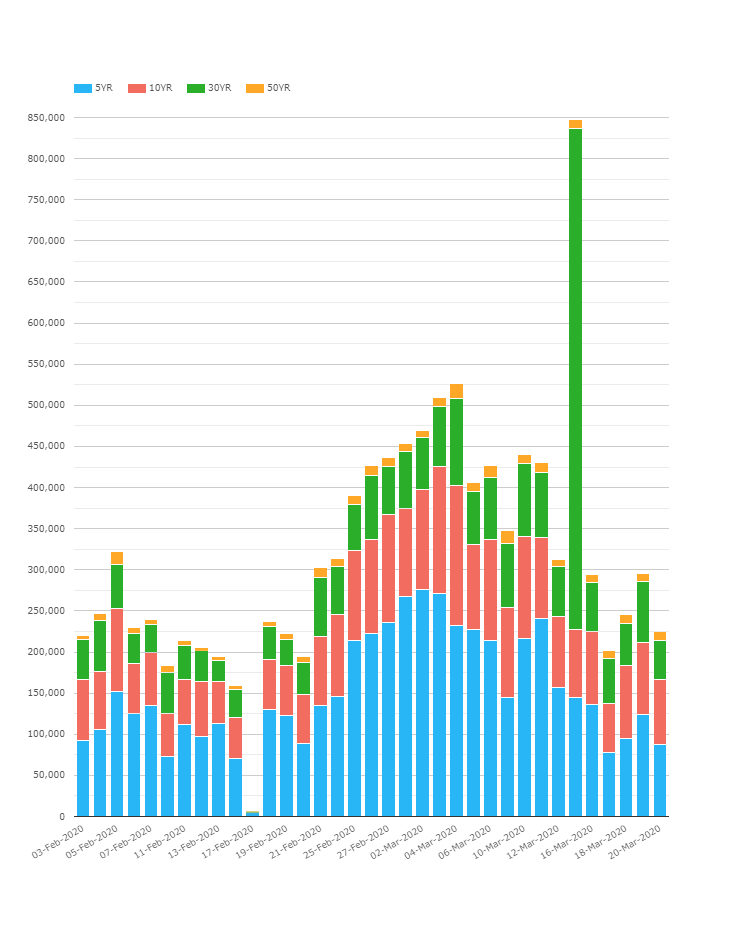
Showing;
- Long-dated activity roughly doubled between early February and early March.
- The average for the first week of February was ~$240bn in long-dated activity.
- This rolling average peaked at ~$470bn per day at the beginning of March, a 1.96X increase.
- For the past week, we are back to $350bn in long-dated notional activity, still above the typical February levels of activity.
It is therefore important to note that daily trading activity remains ~1.5 times higher than normal. The chart may look like recent trading activity has reduced, but I think it is actually painting a pretty rosy picture.
More volatility should drive more trading.
I would suggest that we should really start to worry about liquidity if declining volumes are coupled with increasing price dispersion.
We are not in that situation at the moment, but we will keep on monitoring the markets.
One thing is for sure – that spike in 30Y activity on March 13th is worthy of a blog all on its own!
In Summary
- Price dispersion in 10Y USD swaps has increased significantly over the past six weeks, to triple the early February levels.
- This can be a negative sign for liquidity.
- However, we continue to see larger than typical volumes traded in USD swaps, consistent with periods of high volatility.
- Volumes peaked at the beginning of March and have reduced somewhat since.
- The really negative signs of liquidity, where price dispersion moves substantially higher and volumes plummet have not been seen.
- We will continue to monitor markets and try to investigate the spike in 30Y USD swap volumes at LCH on the 13th March!