- We identify Asset Swaps trading in USD and EUR in the SDR data.
- Different types of Asset Swap package are active across different markets.
- Understanding these differences allows us to examine the data accurately.
- In the US, about 15% by risk of Libor-based swaps are linked to Asset Swaps.
- In Europe, over 90% of non-standard Euribor-based swaps are Asset Swaps.
- In Eonia markets, 47% of all trades are Asset Swaps.
Asset Swaps
Call them Spreadovers, Invoice Spreads or Matched-Maturity Spreads. Call them Asset Swaps, Swap Spreads or Synthetic FRNs. Even call them Optical Spreads, Sovereign Spreads or Credit Spreads if you want to. Let’s just be clear – we’ve blogged on them all in the past (Mechanics, Volumes, Spreadovers are just some examples). And they are all similar flavours of the same thing – namely Package Trades where the swap leg alone does not give you the whole price picture.
When we describe an Asset Swap we mean a swap that is traded versus a bond.
Because these swaps have certain characteristics, we can identify Asset Swaps in the SDR data. We will focus exclusively on Asset Swaps versus Sovereign Debt in this blog. So to be more specific, we will answer the question of how large the Asset Swap market is versus Sovereign Debt. We could also do similar analysis for Corporate Bonds using TRACE data if we were so-inclined.
US Bonds
Our Spreadover blog covers this in far more detail. The ten-second summary is:
- We identify spot starting benchmark swaps that are traded versus on-the-run US Treasuries in the SDR data.
- On a notional basis, these swaps account for about 10% of volumes.
If we look at these volumes on a risk-adjusted basis, we see that they are an even more significant portion of the market. For example, on a DV01-basis (excluding Compression), we see that Spreadovers account for over 15% of risk:
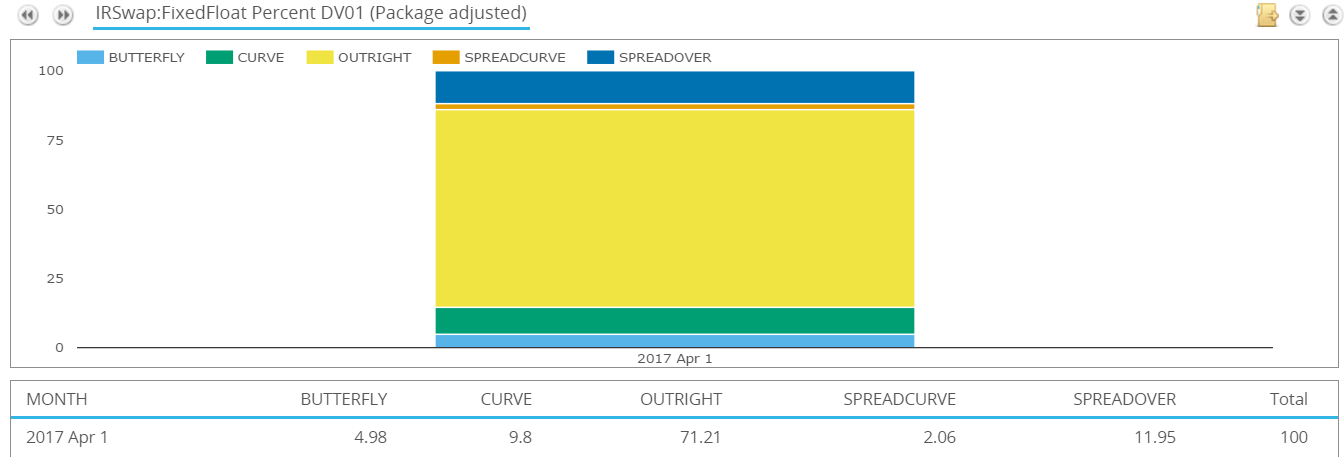
Showing;
- For USD swaps in April 2017, nearly 12% of DV01 was transacted as an outright Spread over a US Treasury bond.
- A further 2% was traded as a spread of spreads.
- These measures are package adjusted, meaning that we only count the DV01 of one leg of a package trade.
We will not dwell too much on the US markets, as we have covered this data previously.
Europe
For EUR markets, we have a single benchmark EUR Swap curve, but we have a fragmented EUR-denominated bond market, divided by national borders and the deemed credit-worthiness of the sovereign issuer. Therefore, we’ll take a geographic approach to our analysis.
German Bonds
Much of the interbank transfer of risk in EUR Swap markets happens versus benchmark government bonds. Due to the vast liquidity offered via the German Bond futures traded at Eurex, the Interbank swap markets frequently trade Invoice Spreads versus these futures. The exact swap structure has a maturity date that matches the cheapest-to-deliver bond within the basket of deliverables of the bond future. I looked at these swaps in one of my very early blogs on European swap markets here.
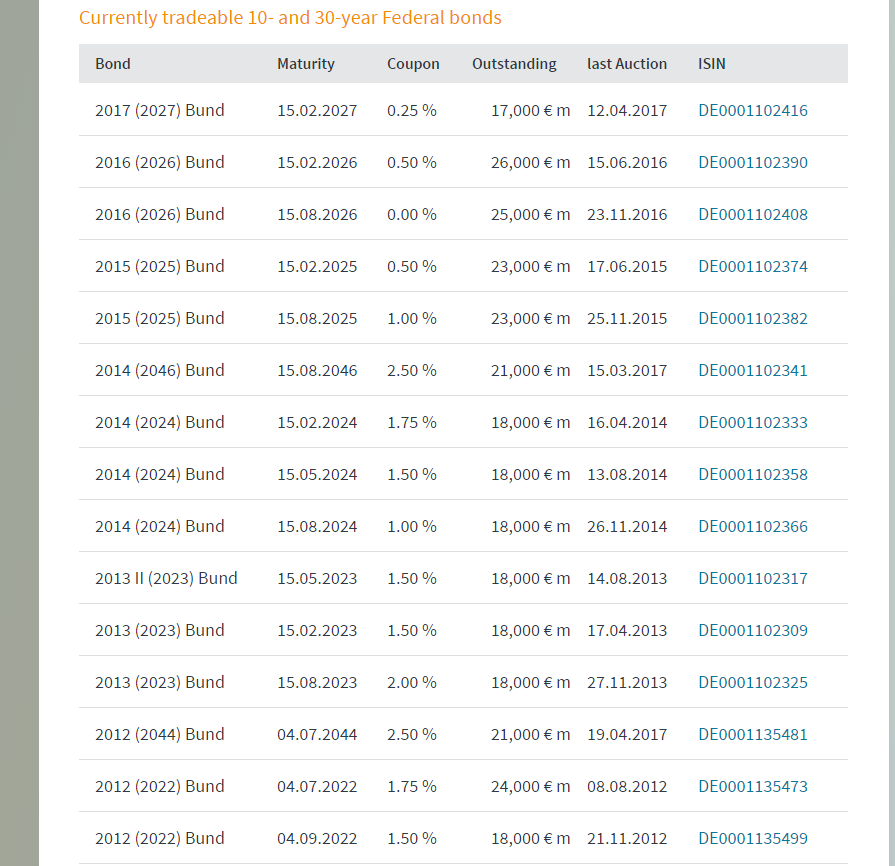
To identify these swaps in the SDR data, we can be a little pragmatic and simply take the maturity dates of all outstanding German debt. Fortunately, this is all fairly simple to source:
Maturity dates of Bunds, Bobls and Shatz are easy to find:
We can do some very quick and dirty analysis using these dates in SDRView Pro. Let’s first filter out all swaps that are spot-starting or back-starting, on the assumption that Asset Swaps have a non-standard start date. For April 2017, we are left with the following market view:
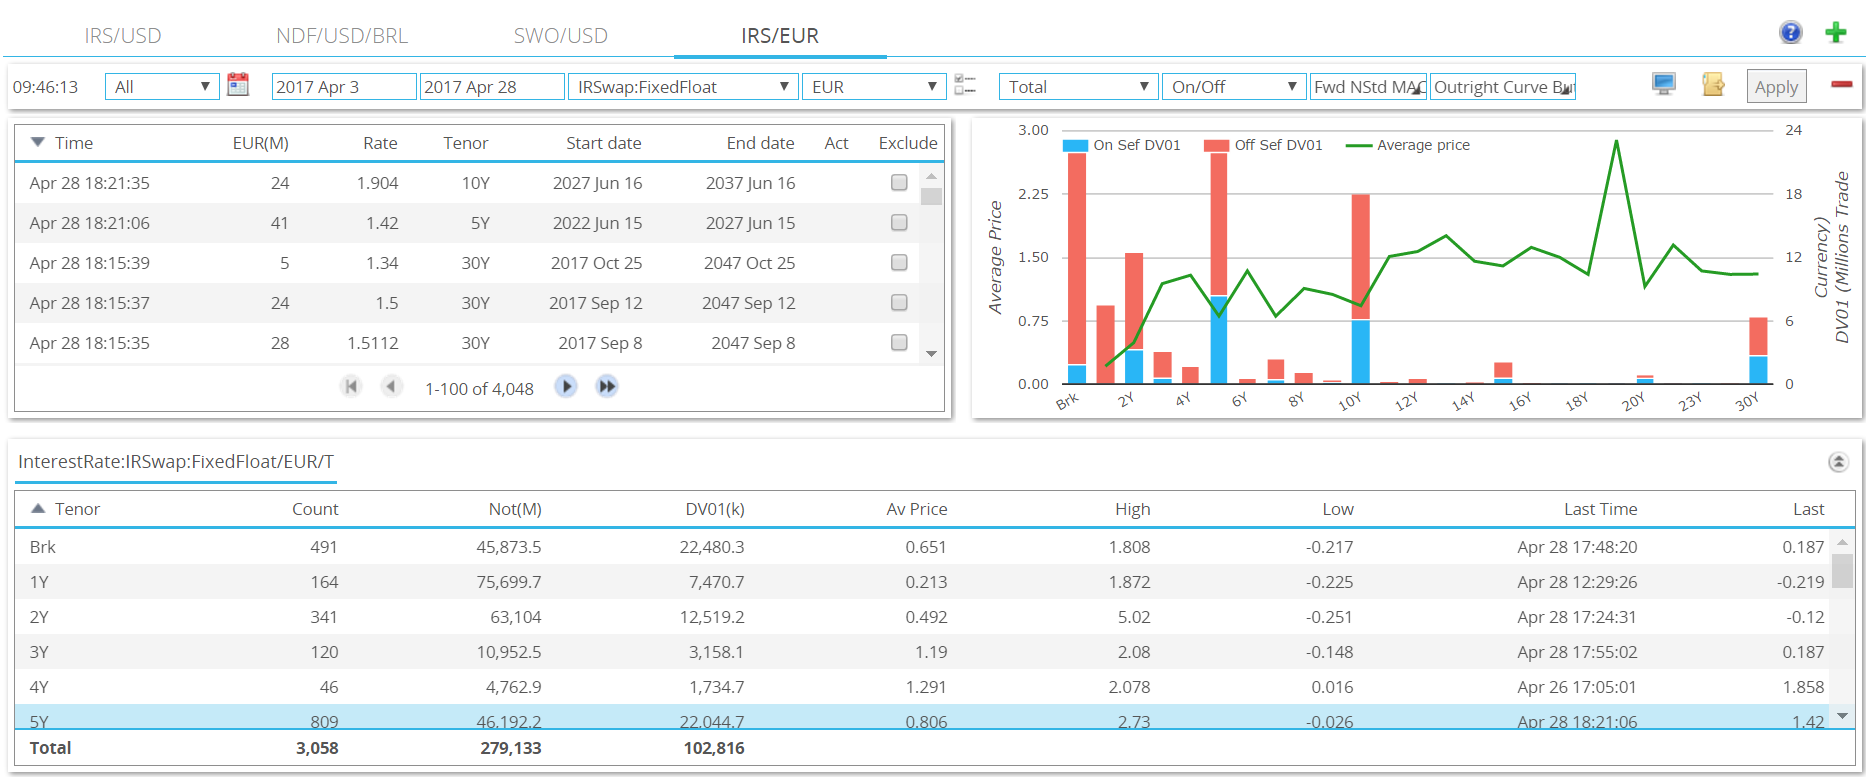
Showing;
- Over 3,000 “non-standard” swaps were reported to SDRs in April 2017.
- For perspective, only 1800 spot starting swaps were reported. Hence non-standard structures are a hugely significant portion of the EUR market.
- Of these 3,000 non-standard swaps, 491 were of a broken tenor. This means that the maturity gap between start date and end dates is not a whole number of years (adjusted for good/bad business days).
- When I export these 491 swaps to Excel I can run a simple match function versus the maturity dates of outstanding German government debt.
- I find that 393 swaps, or 80% of them, are matched-maturity asset swaps versus German government debt.
- 80%!
Now if we turn to the whole EUR swap market traded in April 2017:
- Including Compression, Rolls, spot starting swaps etc, there were nearly 7,000 Euribor trades in total. Of these, 8% are matched-maturity asset swaps versus German bonds.
- If we look at all Eonia swaps, there are a further 1500 swaps. 41% are matched-maturity asset swaps versus German bonds.
Italian BTPs
Having discovered that I could readily explain 80% of our broken dated swaps by looking at asset swaps linked to German government debt, I naturally turned my attention to other sovereign issuers. For Italian BTPs, I turn to the March monthly report from the Tesoro here.
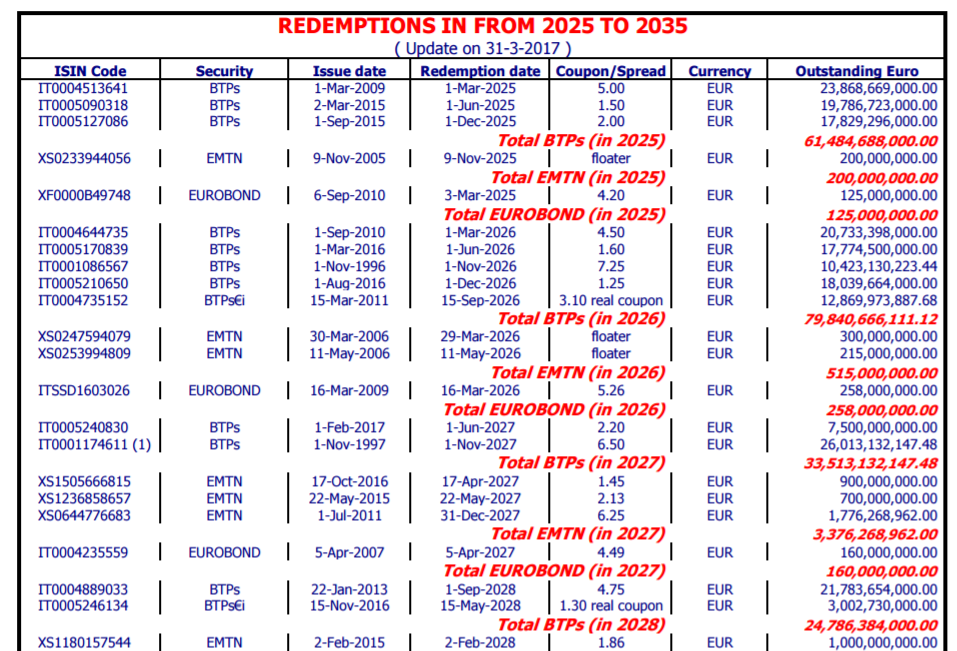
Again, running a match function on the April 2017 swaps data shows that:
- 250 Asset Swaps versus Italian BTPs traded in April 2017 in Euribor swaps. This is 4% of all Euribor swaps.
- A further 25 Asset Swaps versus Italy traded in Eonia swaps during April. This is 2% of all Eonia swaps.
French OATs
For French sovereign debt (OATs and BTANs), I turn to the March monthly report from the Trésor here.
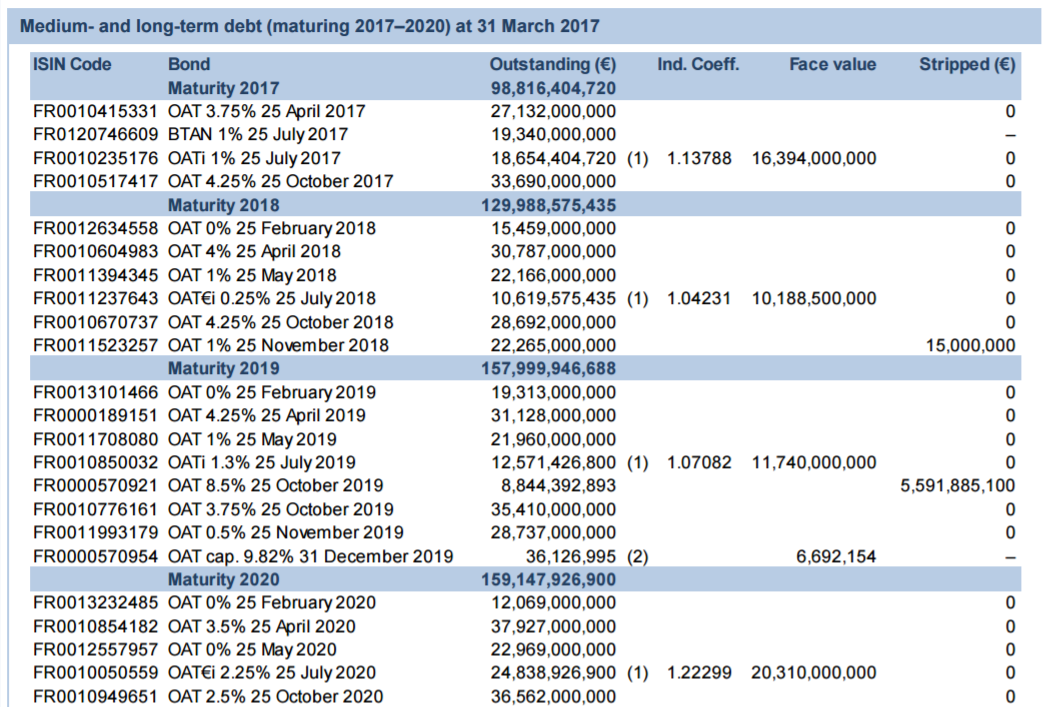
Analysing the swaps data shows that Asset Swaps versus French government debt account for 3% of all Euribor swaps and also 3% of all Eonia swaps.
Spanish Bonos
For Spanish sovereign debt (Bonos), I turn to the Tesoro website here.
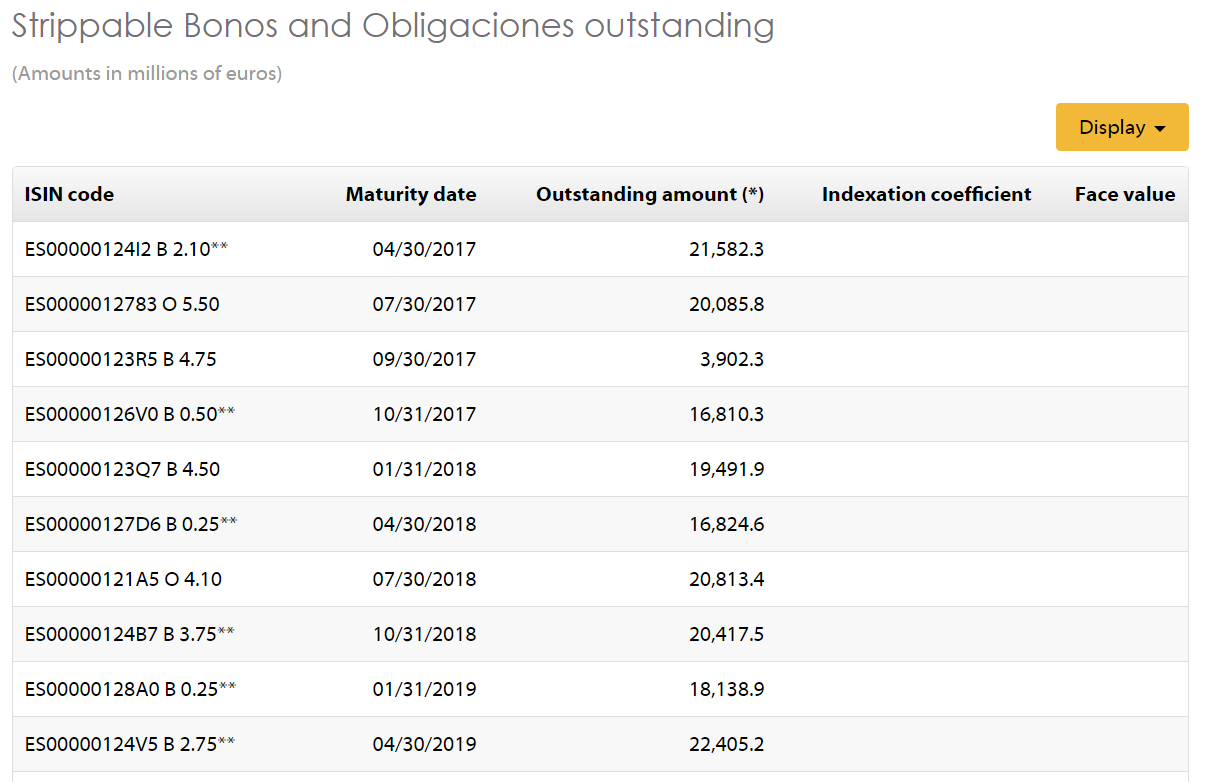
Analysing the swaps data shows that Asset Swaps versus Spanish government debt account for 1% of all Euribor swaps and 1% of all Eonia swaps.
Netherlands
Finally, for Dutch sovereign debt, I turn to the monthly report from the DSTA:
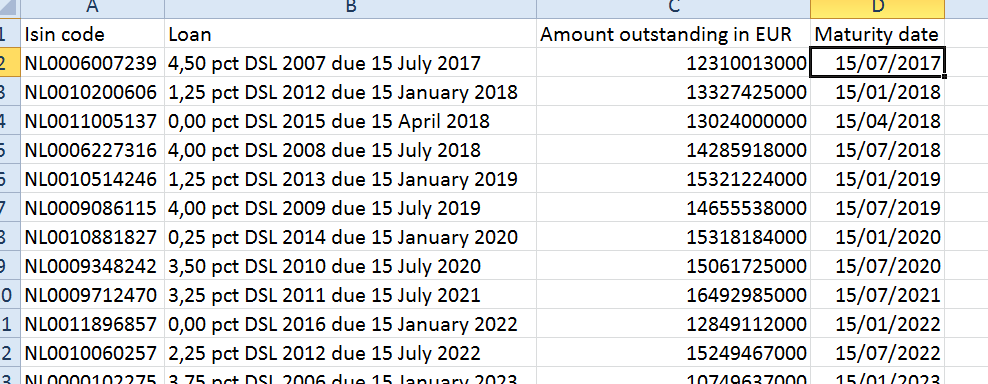
I am beginning to scrape the bottom of the barrel now! Just 42 Euribor swaps match these maturity dates (<1% of all swaps) and only 2 Eonia swaps!
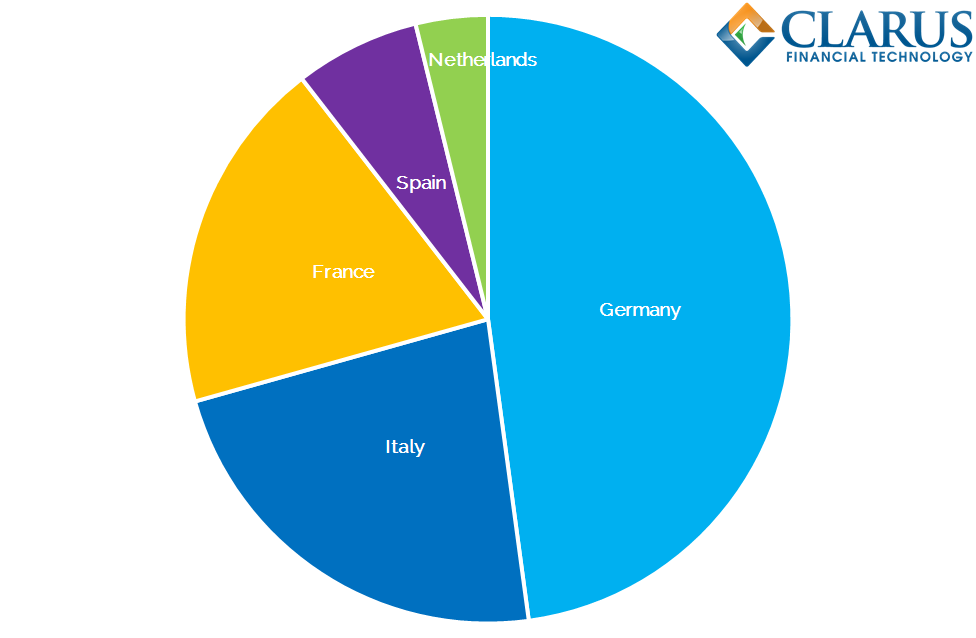
The Consolidated European Picture
In summary, 47% of all Eonia Swaps and 16% of Euribor Swaps may be considered as Asset Swaps versus the major sovereign debt markets in Europe. I could clearly continue down the line and look at Ireland, Portugal, Greece etc. But I think you get the idea.
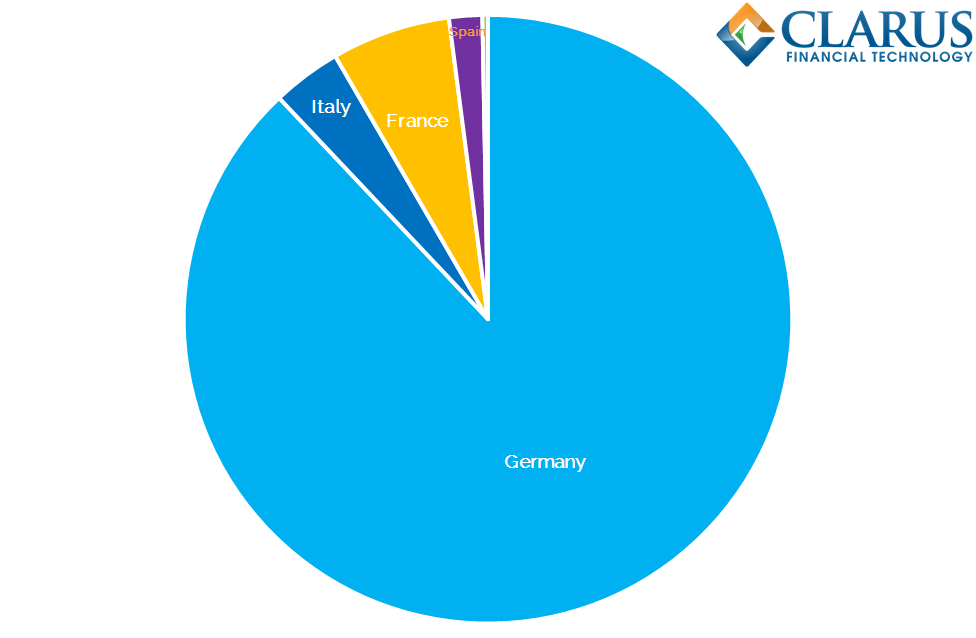
Finally, this analysis begs for a geographic break-down:
In Summary
- Asset Swaps are a significant portion of major swap markets.
- In the US, up to 15% of risk is traded versus a US Treasury bond.
- In Europe, the market is even more significant.
- 47% of all Eonia swaps are Asset Swaps.
- 16% of Euribor swaps are Asset Swaps.
It is worth noting that this analysis may be skewed by the nature of the reporting counterparties for EUR swaps to the SDRs. Let’s add that to the list of reasons that we need more transparent trade reporting in European jurisdictions.
I have looked at the data on a trade count basis for this blog. I plan to repeat the analysis for notional and DV01 metrics in upcoming work. Please remember to subscribe to stay updated.