- Open Interest of NDFs has set new records recently.
- Volumes have continued to be elevated compared to 2016.
- We have not seen a significant change in behaviour since the 1st March VM big bang.
- Overall, we estimate 15% of the entire market is now cleared.
- Up to 35% of D2D volumes are being cleared during any single week.
Uncleared Margin Rules
Tod looked at volumes towards the end of last week to see if trading had ground to a halt as a result of the expansion of Uncleared Margin Rules on March 1st. Whilst there (probably) remains re-papering work to be done, our understanding is that the combination of No Action Letters (US) and an acknowledgement that counterparties will not be held to the letter of the law (Europe) has kept markets trading.
One of the markets most impacted back in September 2016 when the UMRs hit the dealer community was NDFs. We saw a big shift towards Clearing from a previously bilateral only market. Clearing rates went up from around 3% to 35% for some of the D2D NDF markets. This week, we’ll take a stock check to see what’s happened in the 100 days of trading since my last update.
Open Interest in Cleared NDFs
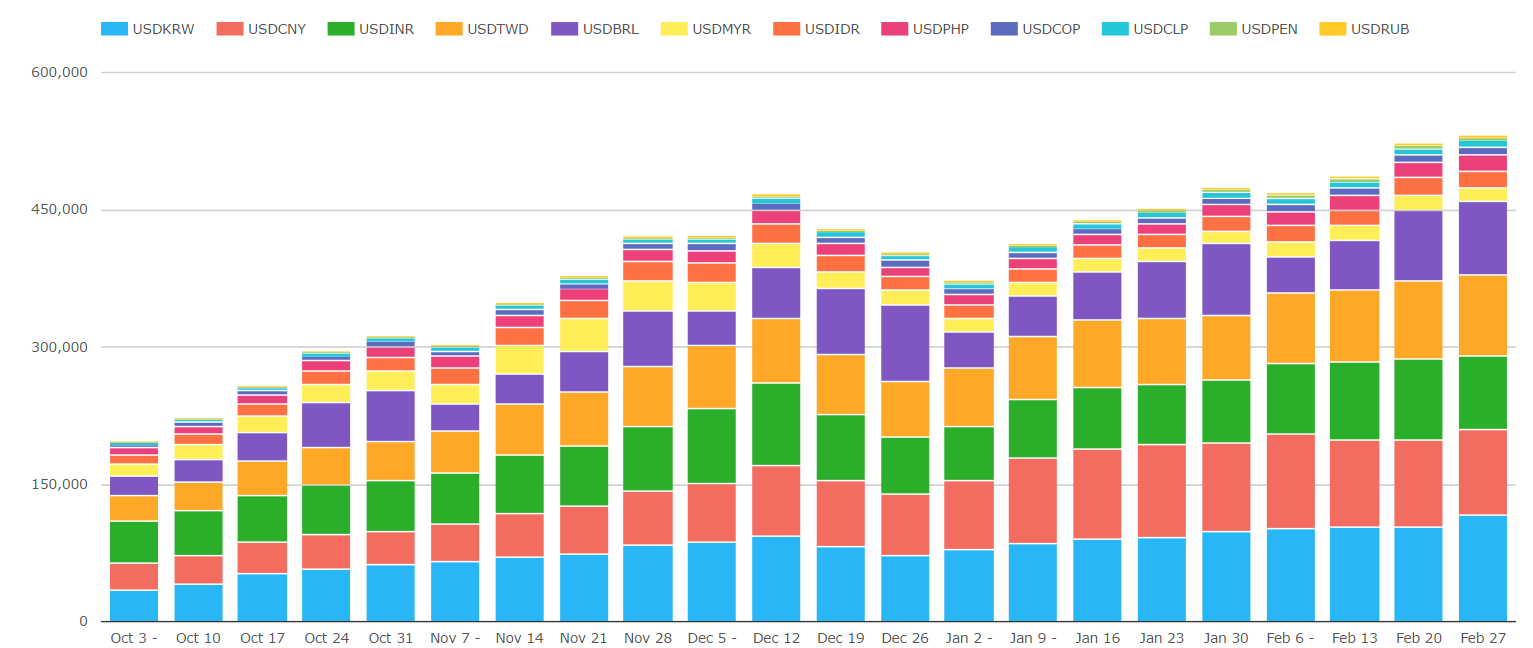
The chart above is from CCPView, showing the growth in Open Interest of NDFs at LCH. It is interesting to see that even in a dealer-to-dealer market where 75% of volumes are one month or less, the clearing of OTC instruments results in a gradual increase in Open Interest. If the main use-case of a financial instrument is to roll spot risk out to one month, why aren’t we just trading standardised instruments? Anyway…I digress. The point is that Open Interest has now surpassed $500bn and looks set to continue to grow.
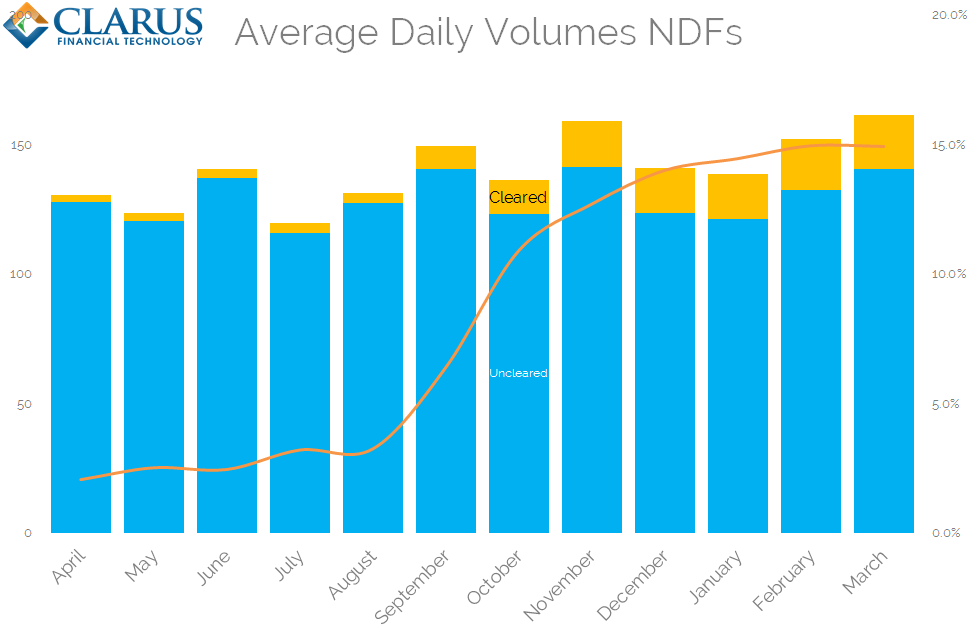
Volumes in NDFs
Using the same methodology as we outlined previously, we can combine SDRView and CCPView data to ascertain what percentage of markets are currently being cleared. This was particularly useful at the end of last year as Clearing volumes were accelerating quickly. The updated chart is shown below:
Showing;
- Average Daily Volumes of Cleared and Uncleared NDFs.
- Cleared NDFs include volumes from Comder, SGX and LCH.
- Uncleared volumes are derived from SDRView data, scaled up on the assumption that reporting US Persons are ~38% of the global market.
- The current Clearing Rate in the market is 15%.
- We can see that the clearing rate in the market has somewhat plateaued in recent months.
- We have a very limited number of observation points in March so far. But as Tod highlighted, there appears to be little to no change in market behaviour so far as a result of the more wide-ranging UMRs.
Over the coming months it will be interesting to see how this chart evolves. It is clear that there was a behavioural shift in September and October of last year. Therefore, for NDFs, the UMRs did not simply “flick a switch”. It took time for the Dealer community to transition towards clearing.
From the data, we can see that a shift towards Clearing has had little impact on overall market volumes. Average Daily Volumes of NDFs in February were the highest since November, with ADVs healthy so far in March.
Clearing by Currency
We estimate the overall rate of clearing in the market at 15%. We can also use a combination of BIS data, CCPView and SDRView to look at this on a currency-by-currency basis:
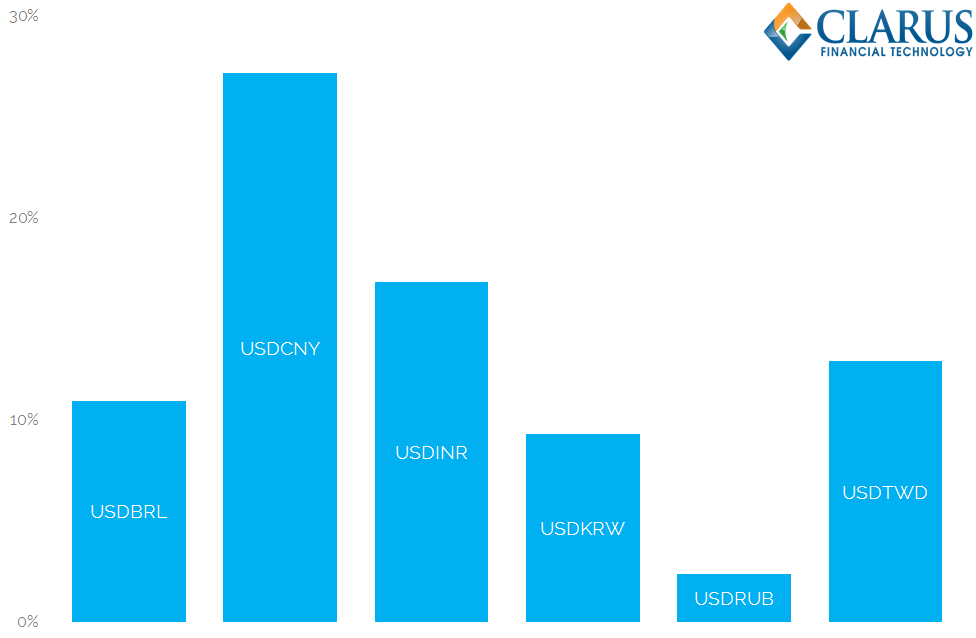
Showing;
- The average percentage of volumes cleared on a weekly basis for a given currency pair since October 2016.
- USDCNY sees the largest portion of (derived) volumes being cleared, at 27%.
- USDINR is the second most popular cleared currency at 17%.
- USDTWD is third at 13%.
- We took a deep-dive into the USDBRL market last year. 11% of this market is currently being cleared.
As a brief interlude, let’s outline our methodology for the above chart. We examine only the currency pairs that are broken down in the BIS survey in the above chart. This gives us an accurate number, at an individual currency level, to scale our SDRView data with. These scalars range from 30% in USDTWD to 66% in USDBRL. As we noted previously, the average across the whole market is 38%.
Dealer To Dealer Volumes
To complete our analysis, we can use our SEFView data as a proxy for the overall Dealer to Dealer market. We know that all Cleared volumes are currently Dealer to Dealer activity only, therefore it is most pertinent to compare these Cleared volumes to Dealer to Dealer activity, rather than the whole market.
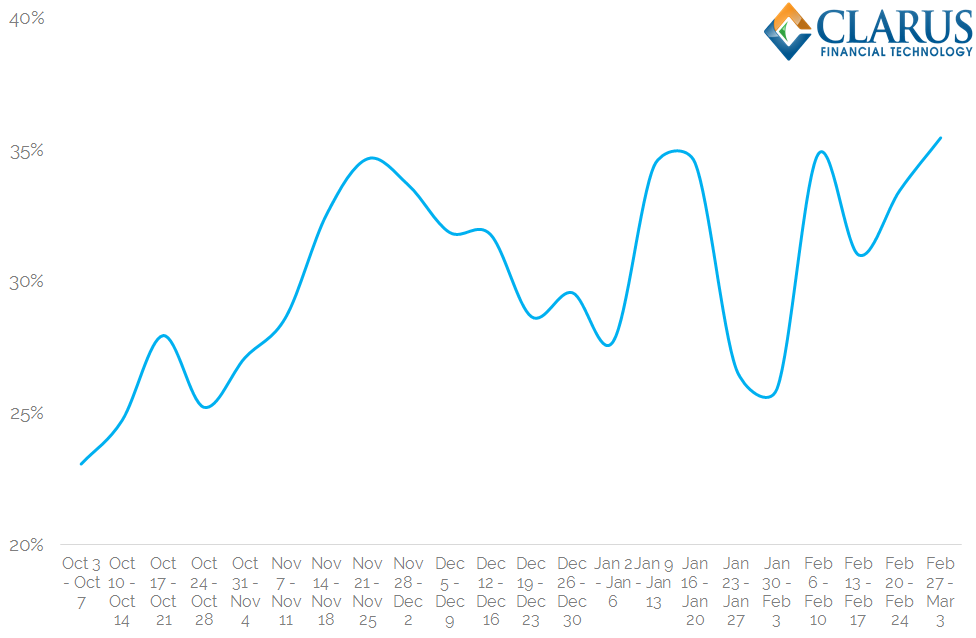
Showing;
- Consistent with our previous analysis, a maximum of 35% of D2D volumes are cleared.
- We did see a small uptick in our most recent data, so it will be worth revisiting this analysis over the coming weeks.
- It has been a volatile time-series. This may be reflective of changing volumes, how clearing occurs (i.e. post-trade not pre-trade) or simply because our data is not always 38% of the entire D2D market.
In Summary
- Clearing appears to be business as usual for a portion of the market in NDFs.
- Overall, about 15% of the total market is now cleared.
- If we look at just the D2D market segment, up to 35% of weekly volumes are cleared.
- Our current analysis is consistent with when we last looked at the figures in December.
- The latest UMRs are yet to significantly change market behaviour. There has been no meaningful change in either Cleared or Uncleared volumes so far.
- We will continue to monitor the trends via our data products.