a.k.a Predictive Analysis in USD Swaps
Clarus, ever since reporting began, have enriched both SDR and SEF data as we identify more and more trade types. Whether the trades are Compression, Spreadovers or Curve trades, we estimate that we are marking up over 1 in 2 trades reported to an SDR.
But to what purpose?
In this blog, I’ll take a simple example – can we use historic SDR data to help predict what the next trades will be? That idea was prompted by a tweet yesterday, regarding Cash vs Futures in US Treasuries:
US Treasury futures + cash markets links. Same group of firms trade on @CME, then cash markets, with rough 5ms lag pic.twitter.com/iONwh11Wmp
— Philip Stafford (@staffordphilip) July 13, 2015
Before we look at the data, it is important to remember that we have no information on counterparties and no information as to whether it was a buy or a sell. We use only information embedded within the SDR data, plus the Clarus enriched fields.
Tick Level Data
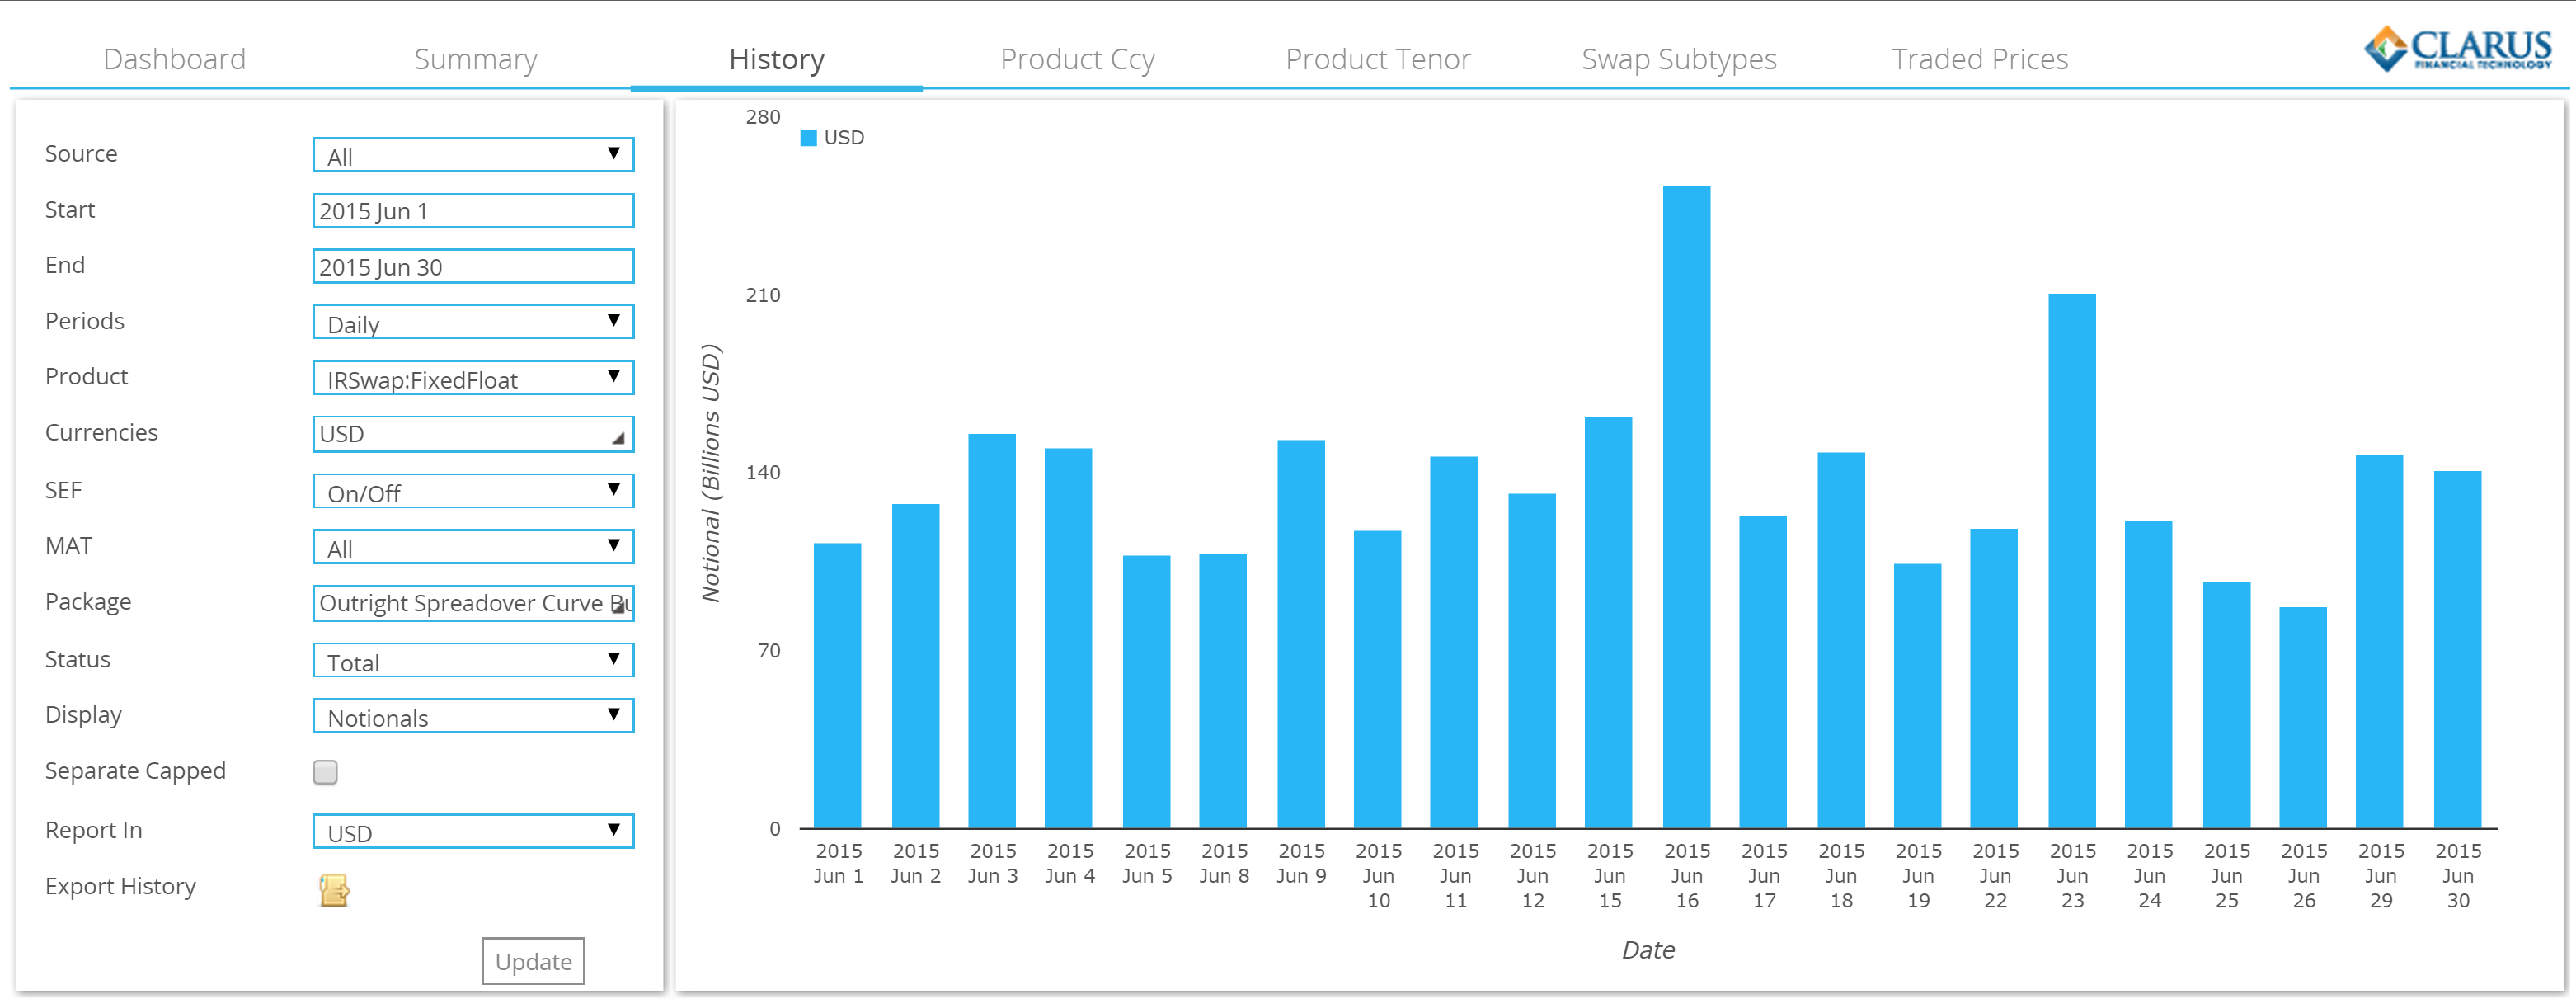
So let’s start by pulling the tick data from the SDR. Using SDRView, this is a simple one-click process.
Now let’s go about extracting the maximum value from the diverse price information embedded within every trade.
This is why we enrich the data with trade types. Clearly, a 5y swap traded versus a US Treasury has slightly different price information embedded within it, than a 5y swap traded outright (i.e. with no other offsetting trade against it).
But first, let’s sort all USD Swaps done in June 2015 by time-stamp. This allows us to analyse the sequential order in which they traded. This yields some interesting statistics.
Like Maturity for Like Maturity
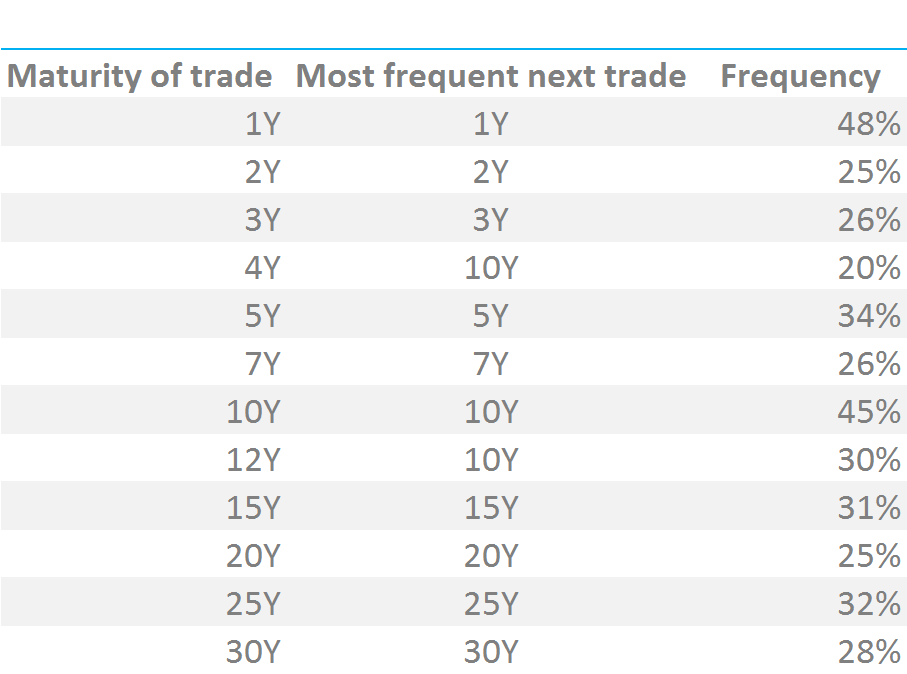
First of all, let’s take the unfiltered list and look at all trade types. How many times is a 5 year swap immediately followed by another 5 year trade? Have a look at the table below:
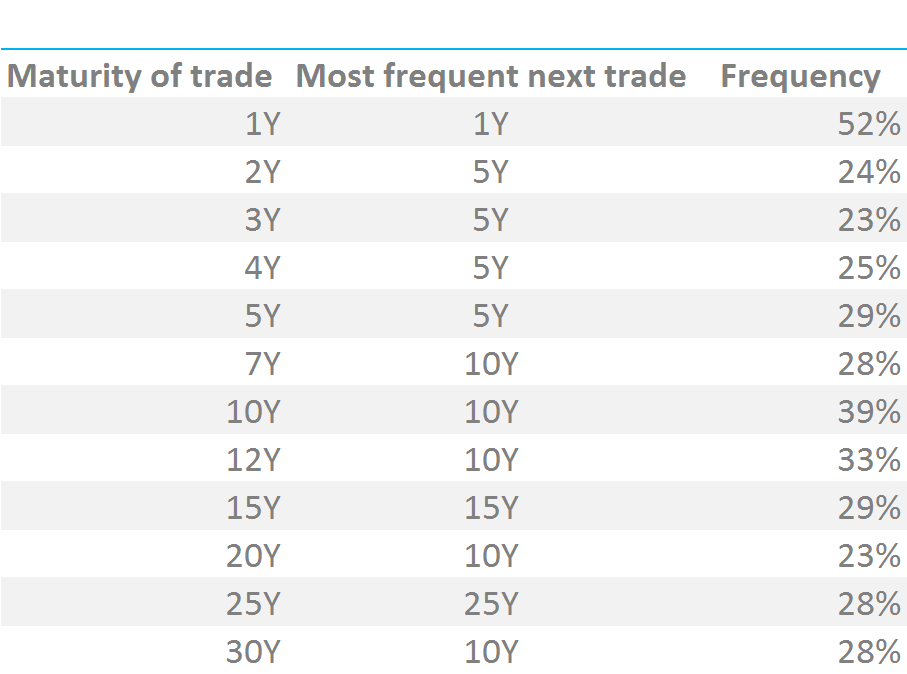
Showing;
- Because 5y and 10y trade more frequently than any other maturity, they tend to be the next trade for most trade maturities. Makes sense, but not particularly helpful for analysing order flow.
- We also ran the numbers looking at only Outrights (i.e. excluding Compression, Spreadovers, Curve trades etc). The numbers are surprisingly similar – 5y and 10y frequencies still dominate.
Therefore we need to take the analysis a step further. Fortunately, Clarus include size information in terms of DV01. We can use this duration-neutral measure to compare…
Outrights: Like Maturity for Like Maturity in the same size
The idea here is to find an exact hedge or follow-on trade once a particular trade has transacted. If we look for matched-maturity trades in exactly the same size and of the same trade-type, we see a completely different frequency of occurrence:
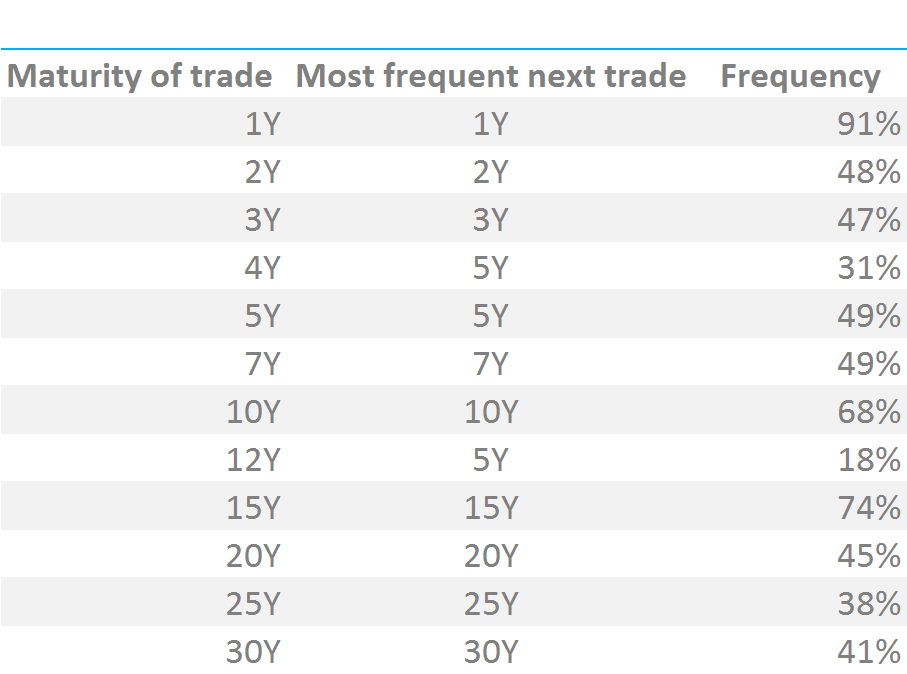
Showing:
- If 1 year trades in $50k of DV01 on an Outright basis, and the next trade is also an Outright in $50k DV01, then the maturity of this trade is also 1 year 91% of the time!
- In a similar manner, if 15y trades in e.g. $10k DV01, and the next trade is also $10k DV01, then the maturity will also be 15 years 74% of the time.
- Intermediate maturities also follow this rule well, with only 12 years standing out as a big anomaly.
- Note the difference to the previous table is large. In 10 years, the next Outright trade, if it is also a matching size, is twice as likely to be 10 years as if we do not take size into consideration.
These findings are directly applicable to how traders can manage any upcoming flow through order books.
- When the size and maturity of the previous trade in the SDR is known, there are patterns within the data as to what the next trade may be.
- If you therefore have a particular trade to do, it is preferable to monitor these patterns throughout the course of the trading session.
- Clarus therefore provide email alerts to our clients, informing them when particular trade types and of particular size are trading. Direct to their inboxes.
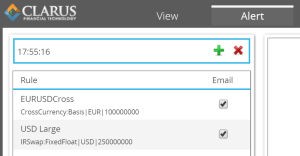

In the current simple market structure, this seems to be the best way to enable our clients to stay on top of incoming order flows, but multiple levels of further complexity are also possible. One such example is shown below.
Changing the Parameters
This blog started looking at just the next trade. However, we can utilise the DV01 metric that Clarus enrich the trade records with, to find the next trade that occurs in e.g. $10k DV01. This might be within ten trades, it might be within 1000 trades – it doesn’t matter. What we care about asking is “What is the maturity of that trade?” We see an identifiable pattern:
Showing:
- Once again, if a $10k trade in 10 years has traded, the most likely maturity of the next $10k trade will be 10 years.
- The frequency percentages (let’s not kid ourselves into calling them probabilities!) are much lower for this more flexible search method.
These simple findings present some very interesting questions:
- Are these patterns repeatable over time? Clarus curated data can be used to back-test this.
- Are these patterns subject to sampling bias? June was an IMM roll month after-all. I’ll leave Clarus users to look into that or contact us for our work on this.
- Are the differences between the frequencies statistically significant? Again, Clarus provides a large, curated back-testable database to interrogate (via our API if you wish).
- If the differences are statistically significant, are they monetisable?
On that last point, we shouldn’t be in this business if we don’t believe that to be the case!
Finally…
For the purposes of the blog, I focused on maturity of trade. But we can also look at volume at price and look for similar patterns throughout the data. An obvious example of this is shown below, plotting Volume vs Coupon on a scatter plot for 5 year swaps.
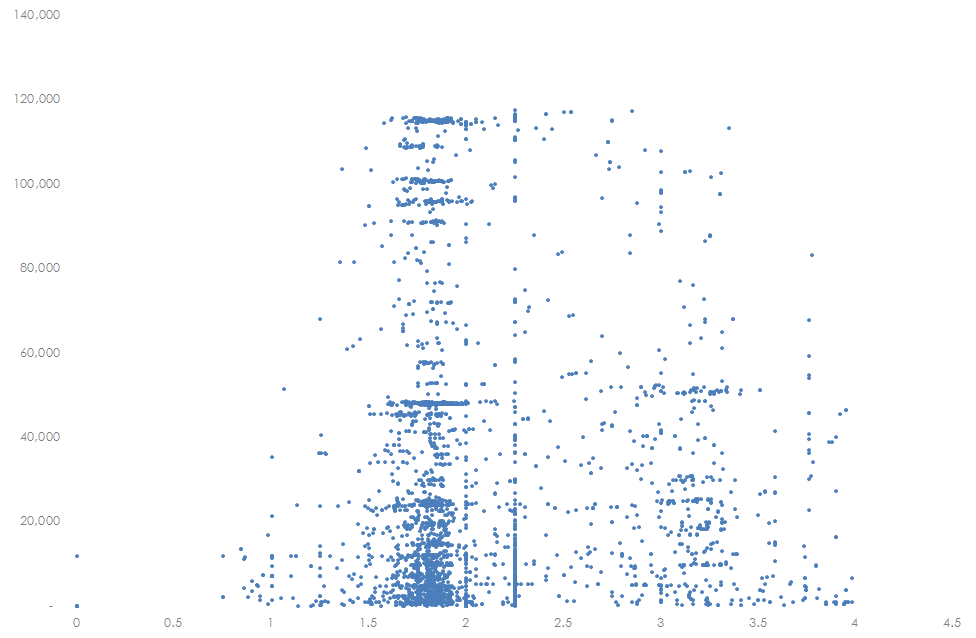
Even the human eye can clearly pick out the MAC coupon. I’ll leave it to the Clarus users to continue interrogating the data to pick out other patterns.