Back in August, I had a look at the wealth of commodity data on the US Swap Data Repositories. The general takeaways were:
- There’s lots of data
- Much of it is murky. Describing many OTC commodity trades require lots of details that are missing.
- Case in point, we found the second most active commodity to be one called “MASKED”.
I ended up looking specifically at the data relating to the gold market because that was the largest by trade count. The data spanned exotics, forwards, options and swaps, and we were able to roughly corroborate the data to BIS data.
We have had many requests for the energy side of the business, so I thought I’d open up Pandora’s box again. Let’s begin.
Which SDRs
To start, we look at all four SDRs in America. DTCC, ICE, CME and Bloomberg. Bloomberg does not report any commodities, leaving us with just three.
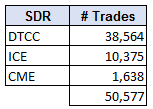
So we pulled a full month of data (January 2017) from each SDR. And of course we only limit our world to NEW trading activity, and we account for all of the cancellations & corrections. This leaves us with the trade counts you see to the right, for all Commodity trades reported to SDRs in January 2017, totalling roughly 50,000.
So there’s quite a lot of data. Before I went any further, I thought I needed some guidance. So I turned to the futures market to see if I could glean what products are the most liquid there.
Futures data
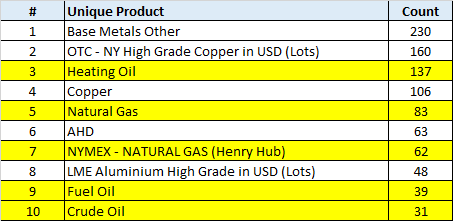
I found the 5 most active CME, and 3 most active ICE energy futures, and determined the volume of contracts in January. This should be a good guide of what to look for on the SDR. I have summarized this below.
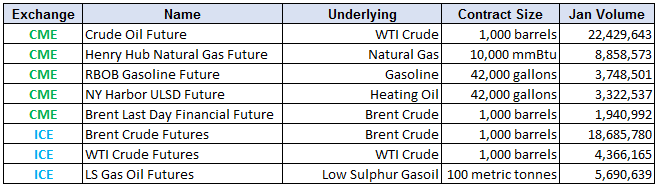
Notably, none of the Power futures at CME were in their top 10 most active Energy products. Likewise at ICE, the most active contracts were all in Oil and Gas products. So, I steered in that direction.
SDR Data
So I went back to the SDR data and had a look at some of the most common taxonomies, along with their trade counts, per SDR. Remember this is a month of data (Jan 2017).
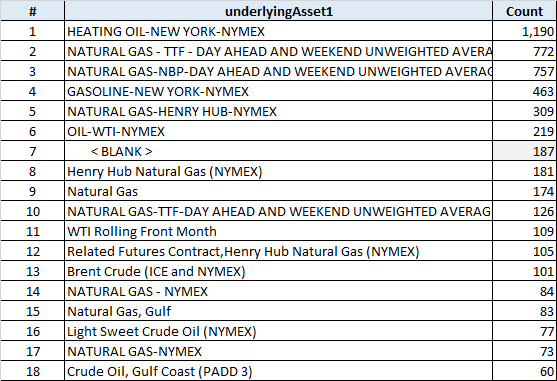
First, DTCC, which has a total of 45 taxonomies. Here are the top 16. I have highlighted the Oil and Nat Gas contracts:
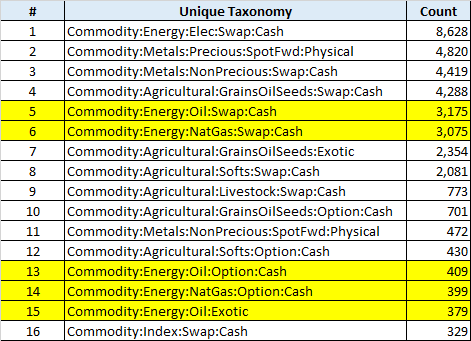
Interestingly, the most common taxonomy on the DTCC SDR is an electric swap, despite the fact that the futures data had led me elsewhere. Further, the next couple most active are metals (which we covered back in August). But fear not, there are indeed a good amount of Oil and Nat Gas swaps.
Next, ICE SDR:
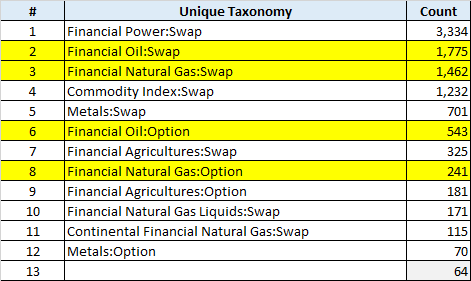
Once again, lots of power swaps. Hmm. As for Oil and Nat Gas, there is a decent amount of data, looking like roughly ½ the amount of Oil and Nat Gas as on DTCC.
And finally, CME:
Which seems rather insignificant in the order of things.
Swaps-Specific Data
So with that ammunition, we can go poke around the SDR to see if we find the OTC variants of these popular contracts. I limited our search to just “Oil” and “Natural Gas” swaps, and again looked at how much data we could find.
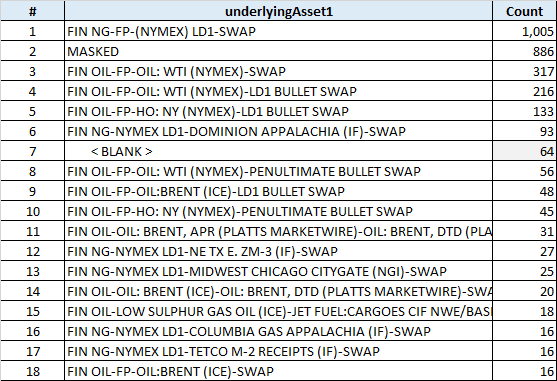
Starting with DTCC, the trade counts for each asset:
Here we can determine the most common Heating Oil and Natural Gas contracts. A keen eye will, however, see that there are various Nat Gas contracts. And they’re not all good:
- TTF – A Dutch virtual delivery point
- NBP – A UK physical delivery point
- Henry Hub – A US delivery point
- And then some more repeats and vaguer-versions of these, including “Henry Hub Natural Gas (NYMEX)”, “Natural Gas”, TTF but with no spaces in the asset name, “NATURAL GAS – NYMEX”, and then again with no spaces in the name.
It’s this last point that highlights two things:
- These products need to be normalized around specific delivery points / settlement methods
- Firms are getting away with being too vague in the description!
And for good measure, the corresponding (truncated) list at ICE for all oil and Nat Gas swaps:
This looks a bit cleaner, and the various “NG” classifications would seem to be denoting these are basis swaps between the liquid NYMEX contract and the relevant other locations.
What can we do with this data?
So there are two things I wanted to do once getting this far:
- Relate the OTC volumes in swaps to related Futures contracts
- Get some idea of our ability to get some price and size transparency out of the SDR
One slight problem here is that out of the 3,000+ Oil & Nat Gas swaps on the ICE SDR, nearly 900 of them have a “MASKED” commodity. Not great for transparency. Sure, they have a price notation in MMBtu, so you might be able to assume that they are one of the key standard contracts for a particular pricing/delivery point, but it does not seem to keep in the spirit of what the SDR is trying to do.
But if we press on, and try to get some feel for the total size of the Nat Gas market in this month, we need some normalized units. Because the Nat Gas futures are in MMBtu, I converted all of the Nat Gas taxonomies from their respective units (mostly MMBtu, but many THERM and MWH, and a few gallons) into MMBtu.
By doing so, we come up with a total monthly volume of just over 1 billion MMBtu’s in DTCC swaps and 936 million MMBtu’s of ICE swaps. In futures terms (at 10,000 MMBtu’s per contract), that’s 105,000 and 94,000 contracts respectively, or 200,000 total Nat Gas swap contract equivalents. Compare that to the nearly 9 million of contracts on the CME in January, and you start to think the energy swaps world is tiny by comparison to their futures brethren. I might just have an answer for this in the next section.
Of course, if this data existed in a cleaned, normalized format, then as a dealer or broker you can see where the market is trading in OTC, and find any missed trades. And as a real hedger/consumer, you should also be able to use this pricing data as leverage in a price negotiation. Let’s look at a snippet of trades in NBP Nat Gas to see if this might be useful:
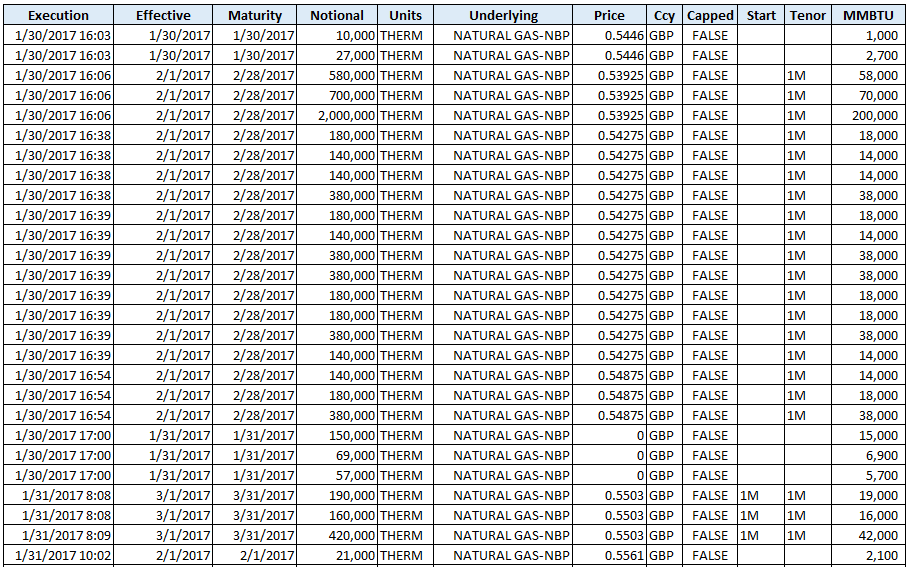
A few things jump out at me looking at the data in any detail:
- When the data is clean, it can be quite useful
- The price notation is not rounded beyond oblivion (good)
- We can readily make out forward starting contract prices and prices for different maturities
- We do actually find some block trades (though not in this snippet, but they do exist)
- Some prices (the zeros) need some work as that leaves a bit too much to the imagination!
Just What Is On The SDR?
I’m guilty of seeing trade data on the SDR and thinking that roughly half of the business is client-driven and the other half is dealer activity. Just seems like a good rule of thumb. However, one of the lessons I learned in some discussion with people in this market is that the SDR data generally represents client activity. That is, the actual customers that need to hedge their physical positions tend to transact in the OTC market. The banks, in turn, tend to then hedge these positions in the futures market.
Summary
As with any of the data on the SDR, if you zone in close enough, there’s some useful nuggets of information. We were able to come up with some yardstick of how the energy swaps market compares to the futures world, and we can see trade activity in some contracts. We had to throw away some data in the process (masked, zero prices, vague-names, etc) but frankly some data is better than no data.
And of course the CFTC will be making new rules to have this data cleaned up, right?