This blog reviews 2025 full-year cross-currency swap volumes, their split between on- and off-platform, and the market shares of platform groups.
We focus on the cross-currency basis swaps in the top five currencies, using SDRView and SEFView to aggregate volumes, DV01, and trade count by month and year.
Key takeaways
For the top five currencies’ cross-currency basis swaps in 2025:
- 2025 saw the highest ever full-year notional volumes, traded risk, and trade counts.
- CAD overtook GBP as the third-largest currency by notional volume, behind EUR and JPY in first and second place.
- GBP had the highest average trade risk, driven by its longer average tenor.
- JPY overtook EUR for the highest trade count.
- Changes over time in volume metrics, average trade size, and risk were different for each currency.
- Volumes shifted from D2D platforms to off-platform.
- D2D volumes shifted towards TP and BGC and away from ICAP, BGC, and BrokerTec, which exited the product.
- Tradition focused heavily on JPY trades.
Read on for the charts and data created in SDRView and SEFView.
Volume context
2025 cross-currency swap volumes were split as follows.

Chart 1: SDR-reported cross-currency swap volumes by product type (notional USD billions). Source: SDRView
Chart 1 shows that total cross-currency swap volumes in 2025 were $14.0 trillion, which was split:
- 94.1 percent basis swaps.
- 3.4 percent fixed-fixed swaps.
- 2.5 percent fixed-float swaps.
We also see from its invisibility in the chart that cleared volumes remained limited (0.16 percent). Drilling down shows that this was dominated by HKD basis trades and CNY fixed-float trades, which probably cleared at OTC Clear.
We will focus on cross-currency basis swaps for the rest of this blog.

Chart 2: SDR-reported cross-currency basis swap volumes by currency (notional USD billions). Source: SDRView
Chart 2 shows that the five major currencies had 90.7 percent of 2025 cross-currency basis swap volumes:
- EUR was largest with $3.71 trillion (31 percent).
- JPY was next with $3.07 trillion (26 percent).
- CAD was third with $1.81 trillion (15 percent).
- GBP was next with $1.40 trillion (12 percent).
- AUD had $837 billion (7.0 percent).
- The next seven currencies (CHF, SEK, NOK, MXN, NZD, SGD, and HKD) made up a further $1.00 trillion (8.4 percent).
- The remaining 13 currencies (CLP, COP, ZAR, ILS, KRW, THB, DKK, BRL, PLN, TRY, HUF, INR, RON) made up a further $101 billion (0.8 percent).
We will focus on those five major currencies for the rest of this blog.
Cross-currency basis swap volumes by major currency
We start with notional volumes.
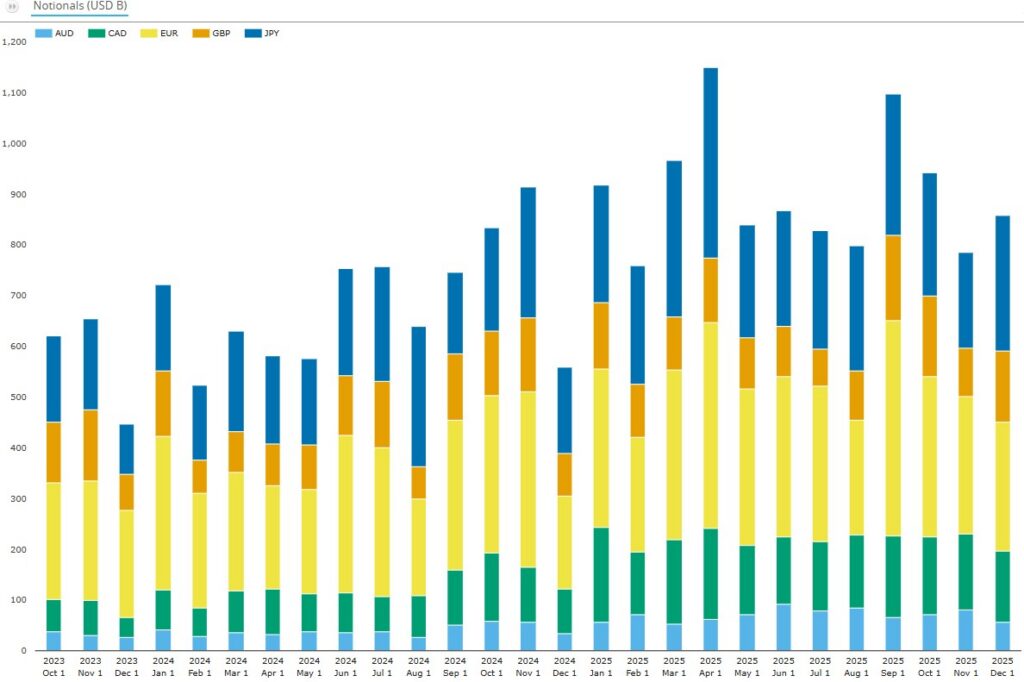
Chart 3: SDR-reported cross-currency basis swap volumes by major currency (notional USD billions). Source: SDRView
Chart 3 shows that cross-currency basis swap volumes in the five major pairs peaked at $1.15 trillion in April 2025 – the highest ever month.
- Each month in 2025 exceeded the same month in 2024 except for November 2024, the month of the US presidential election.
- 2025 had the highest ever full-year volumes at $10.8 trillion – up 31 percent on 2024, the previous full-year high.
- Ranking volumes by currency: first was EUR, second JPY, third CAD, and fourth GBP.
- Ranking full-year volume growth by currency: first was CAD – up $759 billion (72 percent), second was JPY – up $689 billion (29 percent), third was EUR – up $603 billion (19 percent), and fourth was AUD – up $364 billion (77 percent).
For comparison, let’s look at the same activity measured by gross trade DV01.

Chart 4: SDR-reported cross-currency basis swap risk traded by major currency (gross trade DV01 USD millions). Source: SDRView
Chart 4 shows that cross-currency basis swap risk traded in the five major pairs also peaked at $165 million DV01 in April 2025 – the highest ever month.
- 2025 had the highest ever full-year trading of cross-currency basis swap risk at $1.70 billion – up 25 percent on 2024, the previous high.
- Ranking 2025 risk traded by currency: first was EUR, second GBP, third JPY, and fourth CAD.
- Ranking 2025 growth in risk traded by currency: first was EUR – up $105 million (18 percent), second was JPY – up $82 million (32 percent), third was CAD – up $64.6 million (56 percent), fourth was GBP – up $58.0 million (18 percent), and fifth was AUD – up 32.8 million (48 percent).
We can also look at the same activity by trade count.
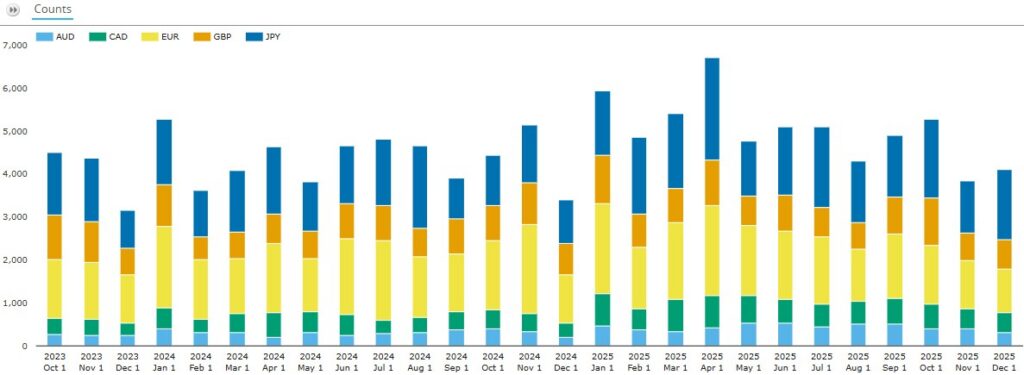
Chart 5: SDR-reported cross-currency basis swap activity by major currency (trade count). Source: SDRView
Chart 5 shows that SDR-reported cross-currency basis swaps traded in the five major pairs also peaked at 6,716 trades in April 2025 — the highest ever month.
- 2025 had the highest ever trade count at about 60,400 trades – up 15 percent on 2024, the previous full-year high.
- Ranking 2025 trade count by currency: first was JPY, second EUR, third GBP, and fourth CAD.
- Ranking 2025 growth in trade count by currency: first was JPY – up 3,700 trades (23 percent), second was CAD – up 1,900 trades (37 percent), third AUD – up 1,600 trades (44 percent), fourth was GBP – up 770 trades (8.5 percent), and fifth was EUR – down 87 trades (0.5 percent).
I included all three charts given the unusually divergent dynamics between them, and because I wanted to calculate average trade notional and risk by currency.

Table 1: SDR-reported cross-currency basis swap average trade size and risk. Source: SDRView
In 2023, 2024, and 2025, table 1 shows that there was continuous growth in average trade size for all five currencies, while average trade risk was a mixed picture. In 2025:
- AUD had limited growth in average risk while it grew fastest in trade count and second fastest in average size.
- CAD had the largest and fastest growing average size. In combination with second fastest trade count growth, this led CAD to overtake GBP for third place in notional traded (see chart 3).
- EUR average risk and trade count were flat versus 2022, leaving trade size increases as the main volume growth driver (see chart 3).
- GBP had the largest average risk but the lowest average size and low growth versus 2024 in average size and risk.
- JPY average size growth was low versus 2024 but the highest of the five currencies versus 2022, while its average risk declined by 19 percent. Combined with the largest absolute increase in trade count, this led JPY to outgrow EUR in notional traded (see chart 3).
We can use SEFView to examine tenor profiles to explain disjoint trade size and risk movement – as we see for GBP above.
2025 SEF cross-currency basis swap volumes (notional USD millions). Source: SEFView
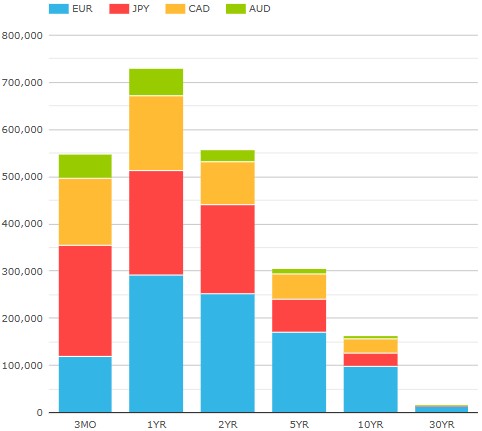
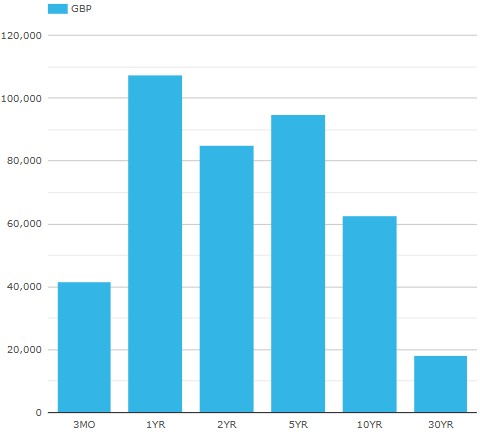
Charts 6a and 6b show the contrast in 2025 tenor profiles of cross-currency basis swaps:
- AUD, CAD, EUR, and JPY combined had the typical tenor profile, dominated by up to two-year trades.
- GBP had more volume in five-, ten-, and thirty-year trades combined than in three-month and 1-year trades combined. (Note that the charts have different y-axis scales.)
I’m interested in your views on the reasons for this divergence in tenor profile.
On versus off platform
What’s the trend here?
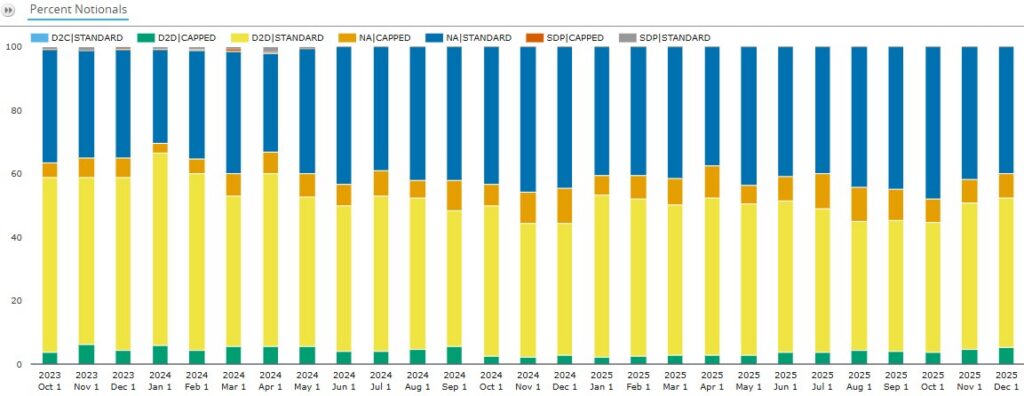
Chart 7: SDR-reported major currency cross-currency basis swaps shares by platform type and whether capped (percentage of notional). Source: SDRView
Chart 7 shows a gentle shift of cross-currency basis swap activity away from D2D platforms and towards off-platform (NA). For the whole of 2025:
- Off-platform activity (blue and orange) averaged 50.4 percent – up YoY from 47.2 percent. Note off-platform activity could be both D2D or D2C trades.
- D2D platforms (yellow and green) averaged 49.6 percent – down YoY from 52.4 percent.
- Single-dealer platforms (SDP) (both standard and capped) had zero volume, having had 0.5 percent in 2024.
- D2C platforms (not visible) had what look like a couple of $1 million test GBP trades from Tradeweb (TREU) in July 2025.
We can also see that the capped share for D2D platforms was smaller than the capped share for off-platform – indicating that off-platform trades had a larger average trade size.
As the D2D platforms are partly or fully voice-based, the observed shift here is mainly from brokered to bilaterally executed rather than from electronic to voice.
D2D market share
We move on to look at D2D platform market shares. Here we use DV01 as the metric as broker revenue is usually risk-based.
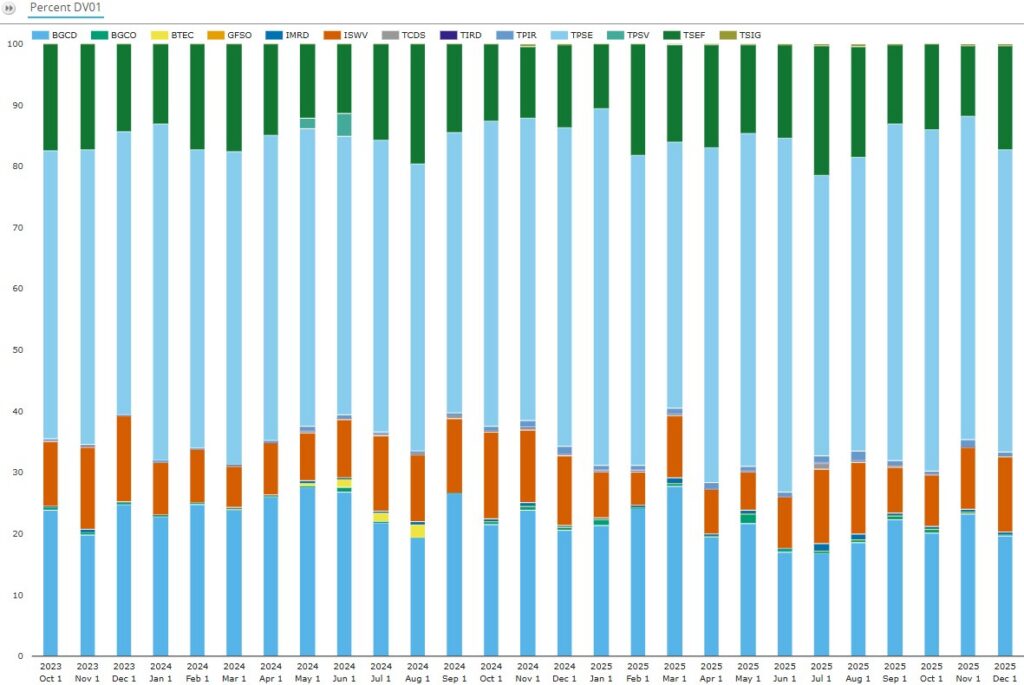
Chart 8: Platform share of SDR-reported D2D platform cross-currency basis swap risk traded (percentage of DV01). Source: SDRView
Chart 8 shows that cross-currency basis swap market share of DV01 remained mostly steady over the period. 2025 full-year shares by platform group were as follows:
- TP (led by TPSE) led with 53.3 percent in 2025 – up YoY from 50.3 percent.
- BGC (led by BGCD) had 21.5 percent – down YoY from 24.0 percent.
- Tradition (led by TSEF) saw 15.8 percent – up YoY from 14.7 percent.
- ICAP (led by ISWV) took 9.4 percent – down YoY from 10.5 percent.
CME’s BrokerTec (BTEC) had zero market share – down YoY from 0.46 percent. In summary, in 2025 TP gained 3.0 percent, Tradition gained 1.1 percent, ICAP lost 1.1 percent, and BGC lost 2.6 percent. To find more reference information about each platform, Google MIC code XXXX, where XXXX is the four-character platform ID above.
The same DV01 analysis can be done on SEFView, resulting in the following summary: TP gained 2.0 percent, Tradition gained 1.8 percent, ICAP lost 0.9 percent, and BGC lost 2.9 percent. These results are directionally identical and numerically similar to those from SDRView above.
The slight differences are because the data scope varies between the platforms. SDRView includes non-US platforms, unlike SEFView, while SEFView includes trades on SEFs where neither party is US, unlike SDRView. Non-US platforms include those in the four main groups above, and Tradeweb Europe (hence the appearance of D2D volume in chart 7).
Before we finish, it’s worth having a quick look at the currency mix by platform.
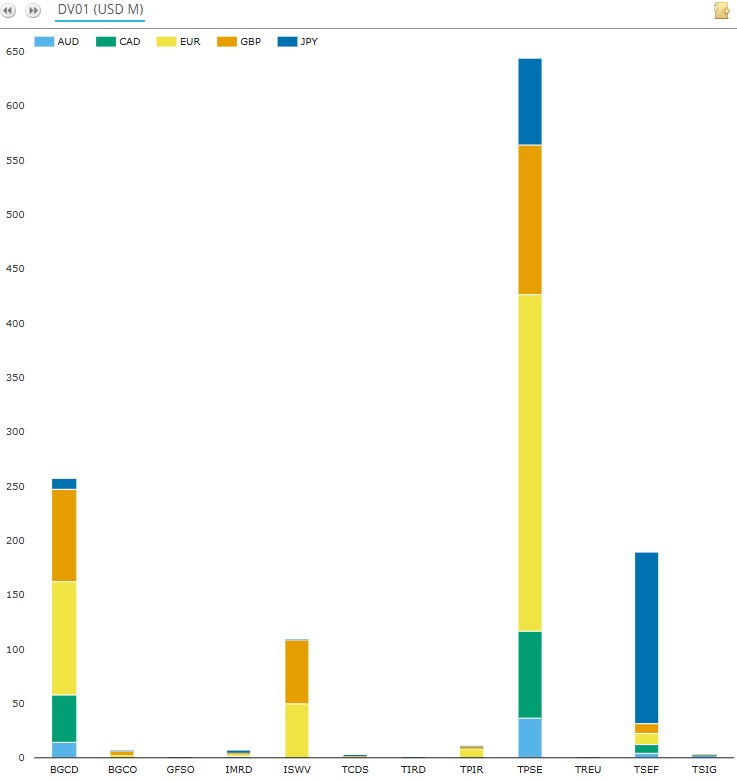
Chart 9: Currency mix of D2D platform cross-currency basis swap risk traded (DV01 USD millions). Source: SDRView
Chart 9 shows the different currency mix of each platform:
- TP’s and BGC’s activities were spread across all five currencies in proportion to market size.
- Tradition’s activity focused on JPY, of which it had over 60 percent.
- ICAP’s activity focused on EUR and GBP.
End note
Skip back to the top to reread the key takeaways if you like.
We used nine charts and one table for a complete overview, but there is a lot more data in SDRView and SEFView.
Please contact us for information on our data products, or for more details on any of the above analysis.