This blog follows the recent pattern of intra-year SOFR swaps SEF volumes blogs to complement the full-year reviews in 2023 and 2024. Given recent market dynamics, I was curious about the activity levels so far in 2025.
Please note: SDRView includes MTFs and OTFs as well as SEFs in its platform scope. For brevity, we reference all three types as SEF throughout this piece.
Summary
SOFR swaps at D2D venues trade as spreadovers, butterflys, curve switches, or CCP switches.
- Spreadovers were the largest, with ICAP leading.
- Butterflys were next, with Dealerweb leading.
- Curve switches follow, with ICAP and BGC neck and neck.
- CCP switches were least, with Tradition leading.
On D2C venues, outrights are the most common trade.
- Outright volumes in trade count and DV01 were much higher than D2D, with Bloomberg leading in trade counts while Tradeweb mostly led in DV01.
- Unlike for D2D, forward starting, IMM, and MAC subtypes of SOFR swaps were traded in significant numbers.
- D2C SEF compression volumes were huge, with Tradeweb dominant.
Continue reading for the charts, tables, and details.
D2D SEF volumes in SOFR swaps
First, using SDRView, we show a chart and table of trade counts for 01 January to 31 May 2025, for spot starting USD SOFR swaps on dealer-to-dealer (D2D) SEFs. In the table, the columns are the SEF platform IDs, and the rows are package types (as identified by Clarus).
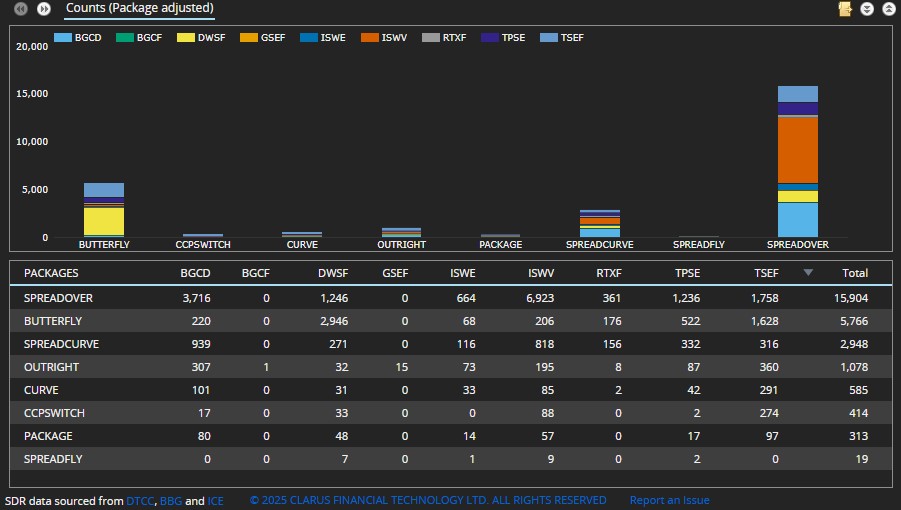
Figure 1: Trade counts for SOFR swaps on D2D SEFs for 2025 up to the end of May.
Spreadovers were by far the most common type, with 15,904 trades – up 2,637 trades or 16.6 percent on the same period of 2024.
- The ICAP venues (ISWE, ISWV) with 7,587 trades represented 47.7 percent share – up 3.3 percent.
- The BGC’s activity (now streamlined into BGCD) with 3,716 trades made up 23.4 percent share – up 1.8 percent.
- Otherwise, Tradition (TSEF) had 11.1 percent – down 1.9 percent, Tullet (TPSE) was 7.8 percent – down 3.1 percent, Dealerweb (DWSF) took 7.8 percent – up 0.4 percent, and RTX got 2.3 percent – up 1.6 percent.
Butterflys, shown in Figure 1 as BUTTERFLY or SPREADFLY, were next largest with 5,785 packages – down 373 (package-adjusted with three trade legs per package).
- Dealerweb led with 2,953 packages, a 51.0 percent share.
- Tradition, with 1,628 out of the 2,832 packages not on Dealerweb, had 28.1 percent.
Curve switches, shown in Figure 1 as SPREADCURVE or CURVE, were next with 3,533 trades – up 586 (also package-adjusted with two trade legs per package).
- ICAP led, with 1,052 packages representing a 29.8 percent share – down 4.2 percent.
- BGC was close behind, with 1,040 packages representing a 29.4 percent share – up 8.3 percent.
- Otherwise, Tradition was 17.2 percent – up 1.3 percent, Tullet took 10.6 percent – down 5.5 percent, Dealerweb held 8.5 percent – down 1.8 percent, and RTX formed 4.4 percent – up 3.6 percent.
CCP switches, with 414 trades – up 179 (also package-adjusted with two trade legs per package).
- Tradition led with 274 trades or 66.2 percent – up 4.2 percent, with ICAP next with 88 trades or 21.3 percent – down 1.7 percent.
The Outright and Packages rows in Figure 1 represent a small volume of trades unattributed to specific package types by our logic. We can ignore these without making a material difference to our analysis.
Next, instead of trade count, we can change the metric to DV01 (package adjusted).
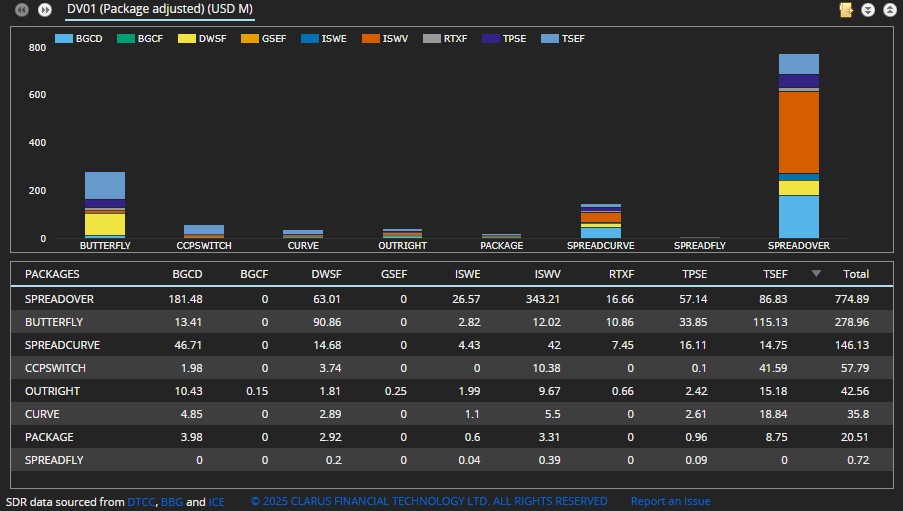
Figure 2: DV01 in $ millions for SOFR swaps on D2D SEFs for 2025 up to the end of May.
Note that, in addition to volume increases, these figures were increased relative to early 2024 by the effect on our gross trade DV01 calculation of the raising by CFTC of trade caps in late 2024.
Recalculating the shares from Figure 1 in DV01 terms shows a few small differences:
- Spreadovers were over $770 million of DV01, up $130 million or 21 percent on the same period of 2024. ICAP had 47.7 percent of spreadovers, and BGC 23.4 percent.
- Butterflys saw Tradition lead, with 41.2 percent. Dealerweb was next, with 32.5 percent.
- Curve switches were led by ICAP with 25.8 percent. Then came BGC with 28.3 percent, Tradition 18.4 percent, and Tullet 8.9 percent.
- CCP switches were led by Tradition with 72.0 percent. ICAP was next with 18.0 percent.
DV01 has the advantage of being a better proxy for the brokerage revenue earned and share of wallet.
D2C SEF volumes in SOFR swaps
Next, again using SDRView, we show a chart and table of trade counts for 2025 YTD for USD SOFR swaps (spot starting) that are on SEF and the SEF is dealer-to-client (D2C).
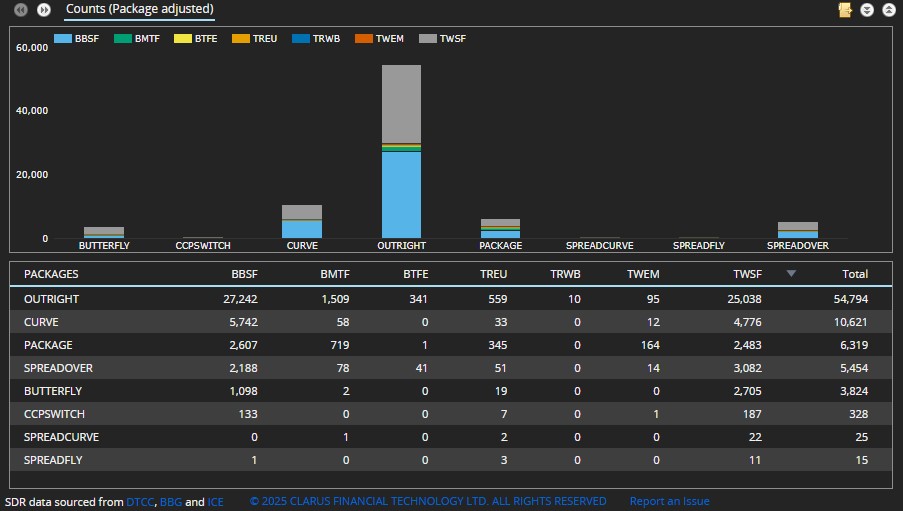
Figure 3: Trade counts for SOFR swaps on D2C SEFs for 2025 up to the end of May.
Outrights were by far the most common trade type with 54,794 trades (comparable to the 15,904 spreadovers on D2D SEFs).
- Bloomberg venues (BBSF, BMTF, BTFE) had 29,092 trades – a 53.1 percent share.
- Tradeweb venues (TREU, TRWB, TWEM, TWSF) held the balance of 25,702 trades or 46.9 percent.
Curve switches showed 7,542 packages (comparable to the 3,533 curve switches in D2D SEFs).
- Bloomberg had 5,801, or 54.5 percent share.
- Tradeweb had 4,845, or 45.5 percent.
Spreadovers had 5,454 trades (compared to 15,904 spreadovers on D2D SEFs), which were split between Tradeweb at 57.7 percent and Bloomberg at 42.3 percent.
Butterflys had 3,839 packages (compared to 5,785 on D2D), split between Tradeweb at 71.3 percent and Bloomberg at 28.7 percent.
Next, as before, we change the metric to DV01 (package adjusted).
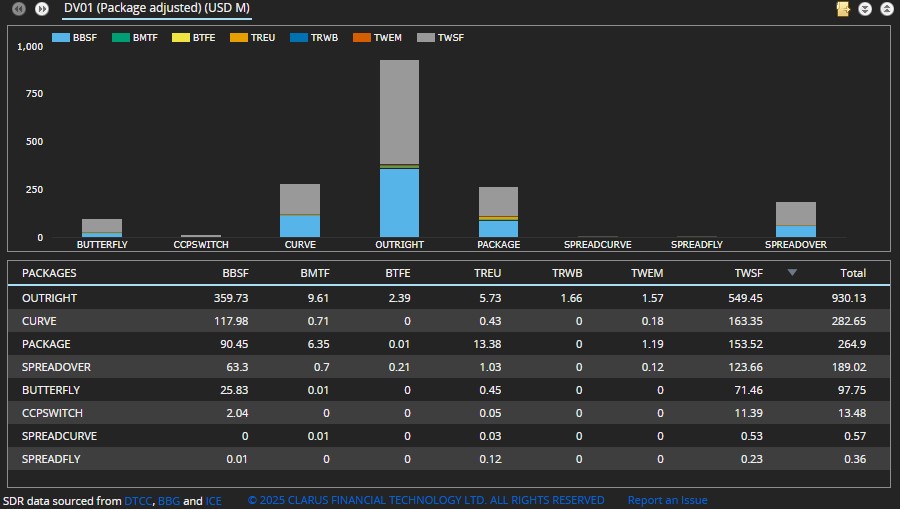
Figure 4: DV01 in $ millions for SOFR swaps on D2C SEFs for 2025 up to the end of May.
Outrights and Spreadovers combined represented over $1,100 million of gross DV01 – much higher than the $770 million-plus DV01 on D2D SEFs. Recalculating the shares in DV01 terms shows Tradeweb usually leading where Bloomberg led in trade counts:
- Outrights were split between Tradeweb at 60 percent and Bloomberg at 40 percent (reversed from trade count share).
- Curve switches saw Bloomberg at 57 percent and Tradeweb at 43 percent.
- Spreadovers came in with Tradeweb at 58 percent and Bloomberg at 42 percent.
- Butterflys were divided between Tradeweb at 74 percent and Bloomberg at 26 percent.
Next forward-starting, IMM and MAC SOFR swap subtypes which all trade in significant volume on D2C venues (unlike on D2D venues). Here the rows are combinations of package type and swap subtype.
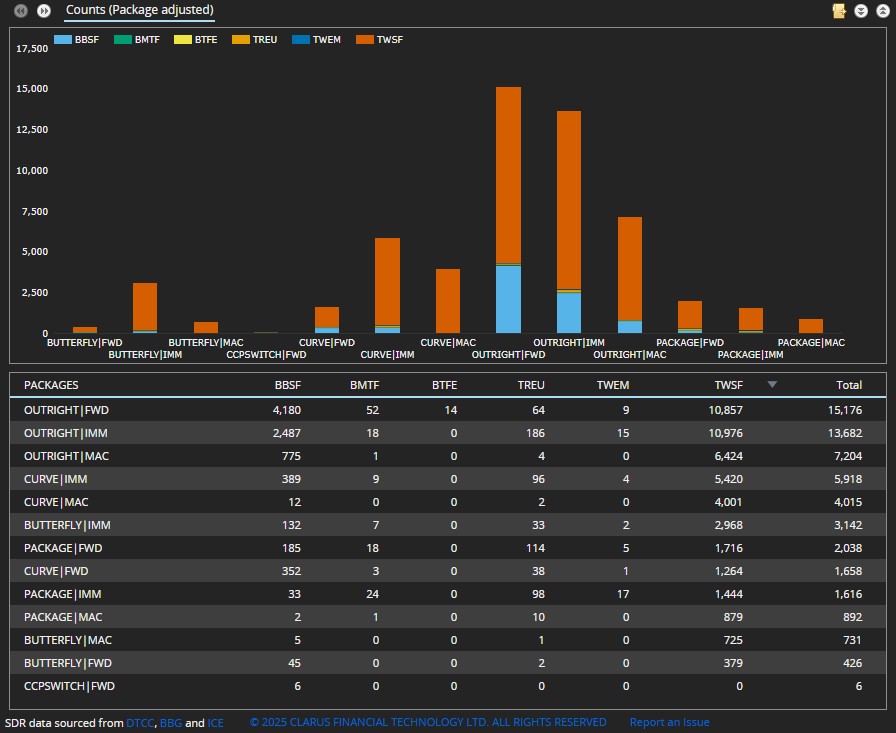
Figure 5: Trade counts for SOFR forward-starting/IMM/MAC swaps on D2C SEFs for 2025 up to the end of May.
Outrights were the largest package type across the three subtypes, with 36,062 trades.
- Outright forward starts (shown as FWD) were the largest group, with 15,176 trades.
- Outright IMM swaps were next, with 13,682 trades.
- Outright MAC (market coupon) swaps followed, with 7,204 trades.
Curve switches across the three subtypes accounted for 11,591 packages.
Butterflys across the three subtypes represented 4,295 packages.
In the interests of brevity, we will skip the count share percentages and DV01 table here. You may wish to calculate share percentages with the counts in figure 5.
Finally, we look at SEF compression trades on D2C SEFs. For more on SEF compression, please refer to our recent post entitled 2024 US SDR-Reported IR Compression.
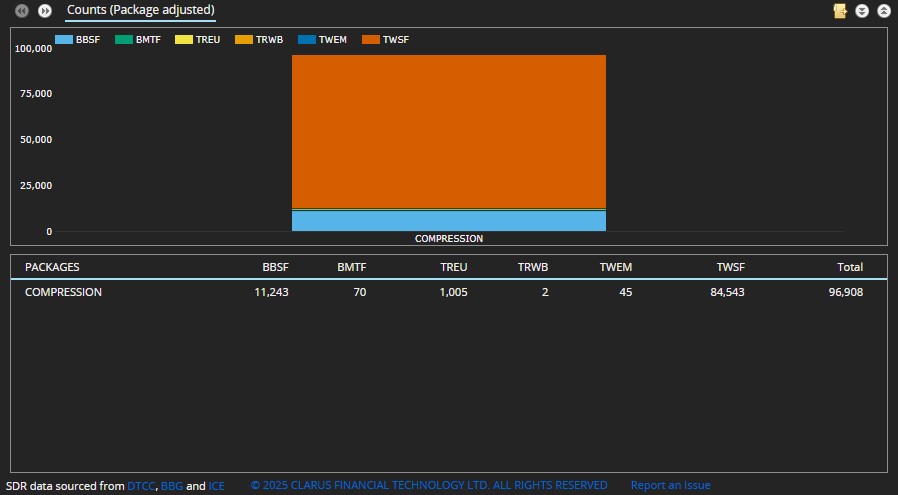
Figure 6: Trade counts for SOFR SEF compression trades on D2C SEFs for 2025 up to the end of May.
There were 96,908 SOFR swap compressions in total – far higher than anything else in D2C:
- Tradeweb had 85,595 trades, which is an 88.3 percent share.
- Bloomberg had 11,313 trades, or an 11.7 percent share.
That’s it
Six charts and tables to cover SOFR swap volumes and market share.
There is a lot more data in SDRView and SEFView.
The different metrics (trade counts, notionals, or DV01) can be aggregated daily, weekly, monthly, and so on; by platform type (D2D, D2C, SDP, or off venue) and platform ID (individual SEF, OTF, or MTF); and by currency, product, subtype, package type and many more.
Please contact us if you are interested in a subscription.