SOFR Swaps at D2D venues were usually spreadover, butterfly, curve switch or CCP switch packages.
- 2024 spreadovers grossed over $1.5 billion DV01 traded from more than 32,236 packages – of which ICAP had 43% and BGC 22%.
- Butterflys were over 15,000 packages, of which Dealerweb had 58% and Tradition 25%.
- Curve switches were over 6,000 packages, of which ICAP had 34%, BGC 20.9% and Tradition 20.7%.
- CCP switches were over 700 packages of which Tradition had 64% and ICAP 21%.
On D2C venues, spot-starting SOFR swaps were dominated by outright trades.
- 2024 outrights grossed over $1.6 billion DV01 traded from close to 105,000 trades – of which Bloomberg had 55% and Tradeweb 45%.
- Curve switches were over 20,000 packages – Bloomberg 57%, Tradeweb 43%.
- Butterflys were over 7,000 packages – Tradeweb 69%, Bloomberg 31%.
- Spreadovers were also over 7,000 packages – Tradeweb 55%, Bloomberg 45%.
As well as spot-starters, forward, IMM and MAC SOFR swaps also trade in significant numbers on D2C venues (unlike D2D venues).
- 2024 outright forwards were over 37,000 trades and outright IMMs exceeded 23,000 trades.
Continue reading for the charts, tables, and details.
Background
This post iterates, for 2024, the coverage of our prior blog: 2023 SEF volumes and share in SOFR swaps using SDRView for charts and data.
Note, SDRView includes all trades either or both of the parties are US, including some executed on non-US venues such OTFs and MTFs.
D2D SEF volumes in SOFR swaps
First, we show a chart and table of package counts for the year 2024, for spot starting USD SOFR Swaps (OIS) that are on SEFs with platform type D2D. The table columns are SEF platform ids and table rows are package types (as identified by Clarus) excluding compressions.
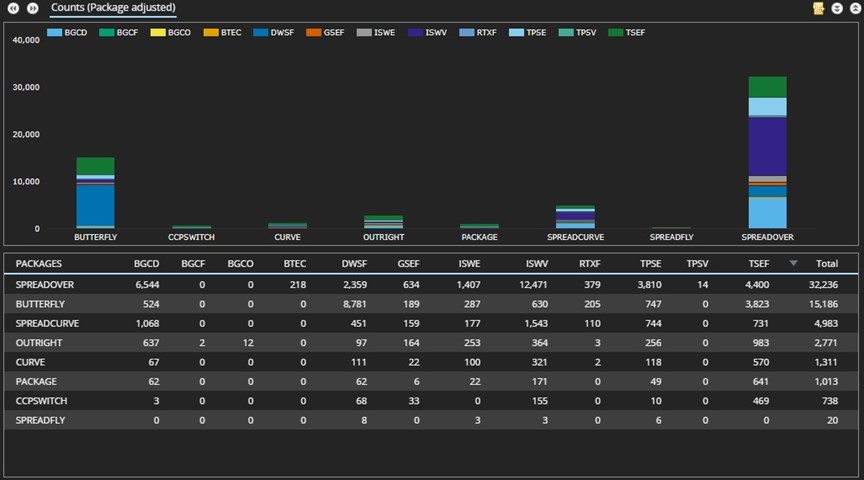
Chart 1 – package counts of spot-starting SOFR Swaps in 2024 on D2D SEFs
Spreadovers remain the most common type with 32,236 packages in 2024, up 7% from 2023.
- The ICAP venues (ISWE, ISWV) had 13,878 packages – a share of 43.1%, down from 48.1%.
- BGC venues (BGCD, BGCF, BGCO, GSEF) had 7,178 packages or 22.9%, a similar share to 2023.
- Tradition (TSEF) was 13.6%, Tullet (TPSE, TPSV) was 11.8%, and Dealerweb (DWSF) was 7.3%.
Butterflys, shown above as BUTTERFLY or SPREADFLY, totaled 15,206 packages in 2024, up from 11,438 packages in 2023.
- Note: this is a package adjusted count, so 3 reported trade legs for each butterfly are adjusted to 1 package.
- Dealerweb led with 8,789 packages – a 57.8% share.
- Tradition had 3,823 packages – a 25% share.
Curve switches, shown above as SPREADCURVE and CURVE, totaled 6,295 packages.
- Note: this is also package adjusted, so 2 reported trade legs for each curve switch are adjusted to 1 package.
- ICAP had 2,141 packages – a 34% share.
- Other shares were BGC 20.9%, Tradition 20.7%, Tullet 13.7% and Dealerweb 8.9%.
CCP switches, shown above as CCPSWITCH, totaled 738 packages.
- Tradition led with 469 packages – a 64% share, while ICAP had 155 packages – a 21% share.
The OUTRIGHT and PACKAGE rows above represent noise in the data and we will exclude from the analysis as they are not that material. The former are most likely spreadovers that we have not identified, while the later should be one of the other types or a granular type we do not identify.
Next, instead of package count, we can change the above table to show gross package DV01 – calculated as the absolute value of the DV01 aggregated across the 1, 2 or 3 trade legs that comprise the package.
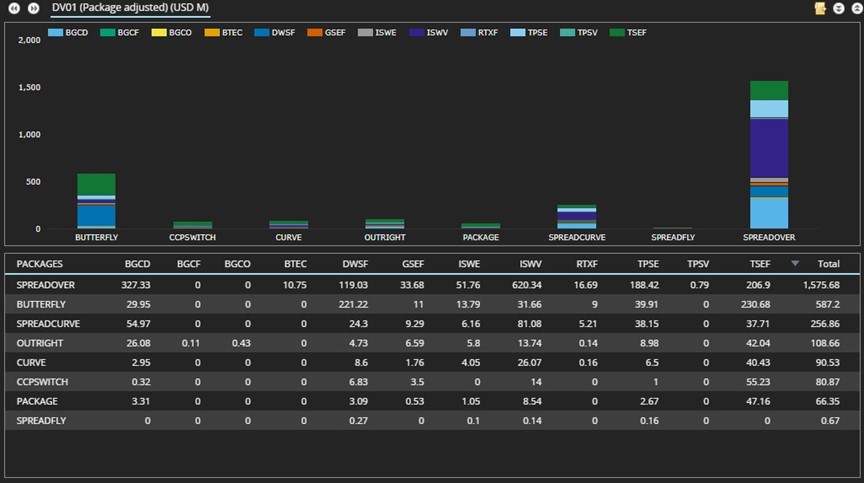
Chart 2 – gross package DV01 in USD millions for spot-starting SOFR Swaps in 2024 on D2D SEFs
Spreadovers were more than $1.5 billion of trade DV01 in 2024. (Note: that SDR capped notional rules mean this figure is under-stated, possibly by up to 30%). Re-calculating the shares in DV01 terms shows some differences from the package-count-based shares, especially in the butterflys.
- Spreadovers: ICAP had 42.7%, BGC 22.9%, Tradition 13.1%, Tullet 12% and Dealerweb 7.6%.
- Butterflys: Tradition had 39.2%, Dealerweb 37.7%, ICAP 7.8%, BGC 7% and Tullet 6.8%.
- Curve switches: ICAP had 33.8%, Tradition 22.5%, BGC 19.8%, Tullet 12.9% and Dealerweb 9.5%.
- CCP switches: Tradition had 68.3%, ICAP 17.3%, Dealerweb 8.4%, BGC 4.7% and Tullet 1.2%.
Package DV01 shares have the advantage that they are a better proxy to brokerage revenue earned and share of wallet.
D2C SEF volumes in SOFR swaps
Next, we look at the same analysis as before but for where the SEFs are D2C for all packages except compressions.
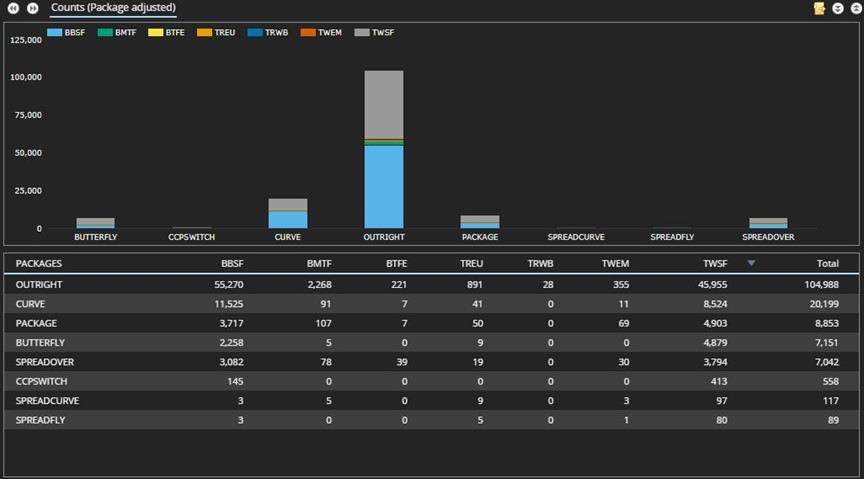
Chart 3 – package counts for spot-starting SOFR Swaps in 2024 on D2C SEFs
Outrights are by far the most common package type with 104,988 trades in 2024.
- Compare this to the 32,236 Spreadovers on D2D SEFs.
- Bloomberg venues (BBSF, BMTF, BTFE) had 57,759 outright trades – a 55% share.
- Tradeweb venues (TREU, TRWB, TWEM, TWSF) with 47,229 trades – a 45% share.
Curve switches, shown above as curve or spreadcurve were 20,316 packages.
- Compare this to the 1,312 curve switch packages on D2D SEFs.
- Bloomberg had 11,631 packages – a 57.3% share.
- Tradeweb had 8,685 packages – a 42.7% share.
Butterflys, shown as butterfly or spreadfly were 7,240 packages (compared to 15,206 on D2D SEFs).
- Tradeweb had 68.7% and Bloomberg 31.3%.
Spreadovers with 7,042 packages (compared to 32,236 on D2D).
- Tradeweb had 54.6% and Bloomberg 45.4%.
Package trades are individual trades marked as part of a package by the reporting bank. At 8,853 trades, these are higher than we would like and represent a future task to further categorize into a specific package type.
Next, as before, we change the above table to show DV01 (package adjusted).
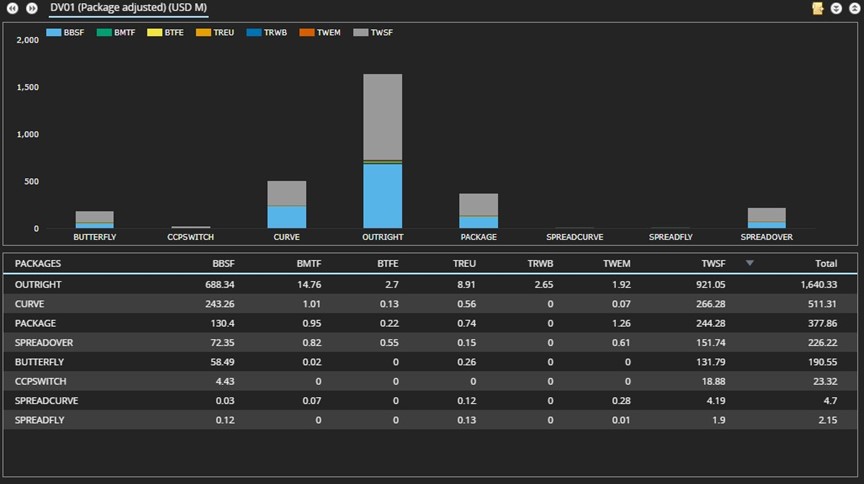
Chart 4 – gross package DV01 in USD millions for spot-starting SOFR Swaps in 2024 on D2C SEFs
- D2C SEF outrights and spreadovers were over $1.8 billion of gross package DV01, a similar amount to those on D2D SEFs.
- Re-calculating the D2C SEF shares in package DV01 terms shows material differences.
- Outrights were Tradeweb 57% and Bloomberg 43%.
- Curve switches were Tradeweb 52.6% and Bloomberg 47.4%.
- Spreadovers were Tradeweb 67.4%, Bloomberg 32.6%.
- Butterflys were Tradeweb 69.6%, Bloomberg 30.4%.
Next, unlike on D2D venues, D2C venues saw forwards, IMM and MAC SOFR swaps trade in similar volume to the spot-starters shown above. SDRView allows us to break these down by both package and subtype.
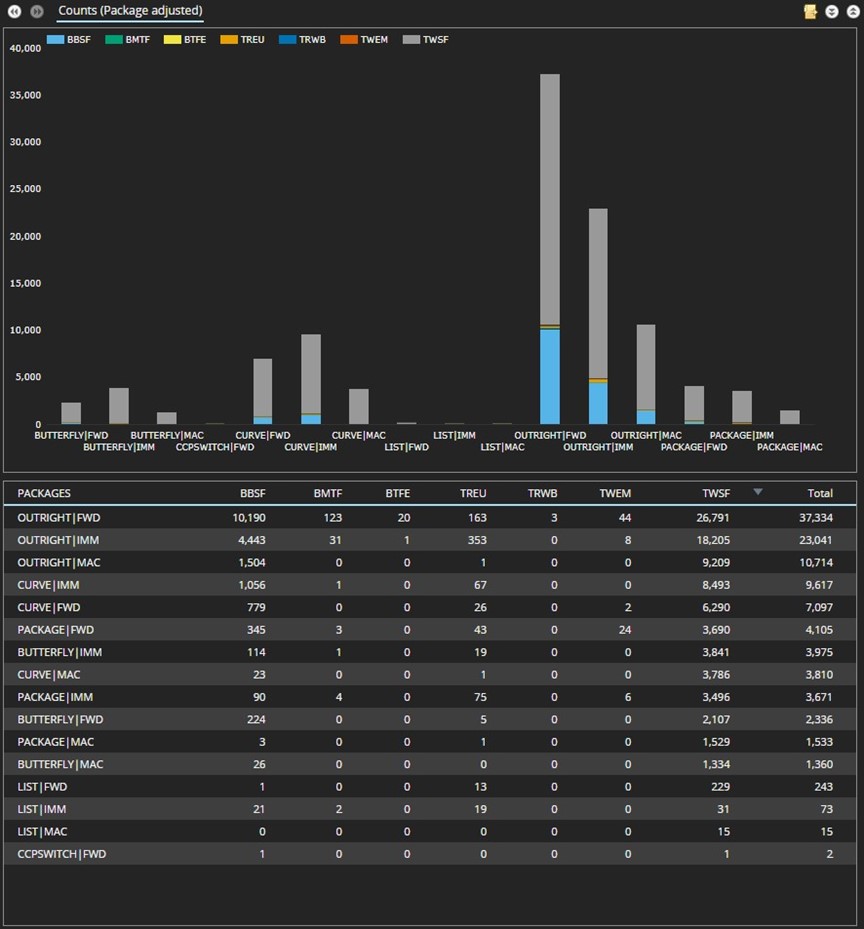
Chart 5 – package counts for SOFR Forward/IMM/MAC Swaps in 2024 on D2C SEFs
We see TradeWeb leading all package types, while Bloomberg is mainly focused on outrights. Among the package types:
- Outrights were the largest of which the forward subtype was largest with 37,334 trades, then IMM with 23,041 and MAC with 10,714.
- Curve switches were next largest of which the forward subtype was largest 4,105 packages, then IMM with 3,975 and MAC with 3,810.
- The volumes showing PACKAGE above are most likely to be Invoice Spreads (vs CME SOFR Futures).
In the interests of brevity, we will skip both the DV01 table for the above and analysis of SEF market share percentages (which can be calculated using SDRview or using the data above).
That’s It
Five charts and tables to cover SOFR Swap volumes and share.
There are a lot more data in SDRView and SEFView.
- Daily, weekly, monthly, quarterly, and annual.
- Currency, Product, Subtype and Package type.
- Trade counts, notionals, dv01.
- Venue type (D2D, D2C, SDP, Off Venue).
Please contact us if you are interested in a subscription.