SOFR First as a prioritization of interdealer trading in SOFR over LIBOR, recommended that on July 26, 2021 and thereafter, interdealer brokers replace trading of LIBOR linear swaps with SOFR linear swaps.
Last week we covered Day One and Day Two of SOFR First, so today I will review week one.
Increase in SOFR Swaps
In SDRView Res, we can easily see the increase in SOFR Swaps traded last week.

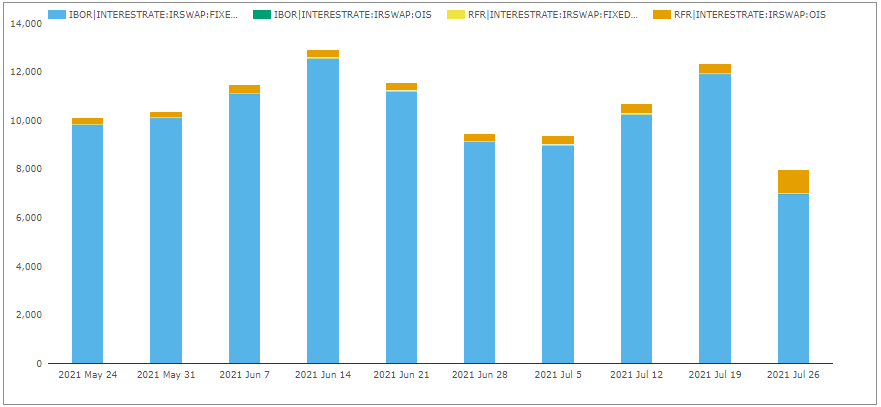
- A sharp increase in SOFR OIS Swaps, from 250-400 per week to 985 trade counts
- While USD Libor Swaps fell from 9000-12,000 per week to 7,000 trade counts
- This covers both ON and Off SEF and Cleared and Uncleared
- In percentage terms 12.3% of trades were SOFR Swaps, up from 2.5% to 4% in prior weeks
Our preferred measure is DV01 and more specifically in SDRView we can work out a packaged adjusted DV01, as we have the legs of a Curve or Butterfly trade and chart the percentage of DV01 by product type.

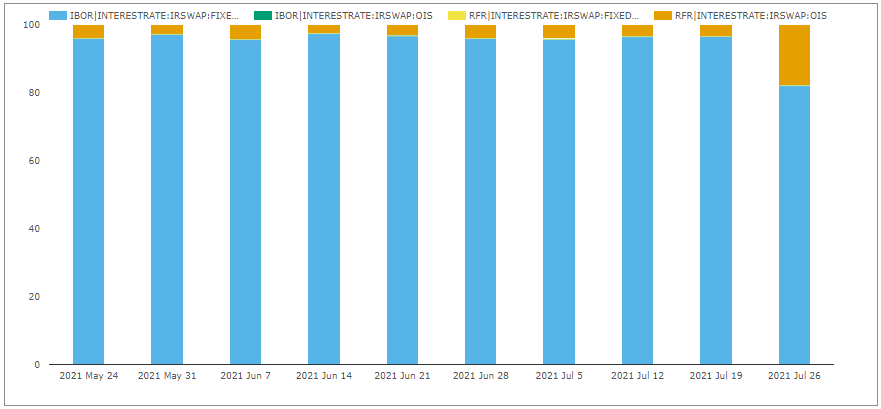
- SOFR Swaps DV01 jumping to 18% from the 3% to 4% range in prior weeks
- In DV01 terms $41.6 million of SOFR risk as traded in the week of 26 July and we know this is an under-estimate because of capped notional rules
Basis Swaps
In SDRView Res, we can also look in detail at Basis Swaps that reference SOFR.

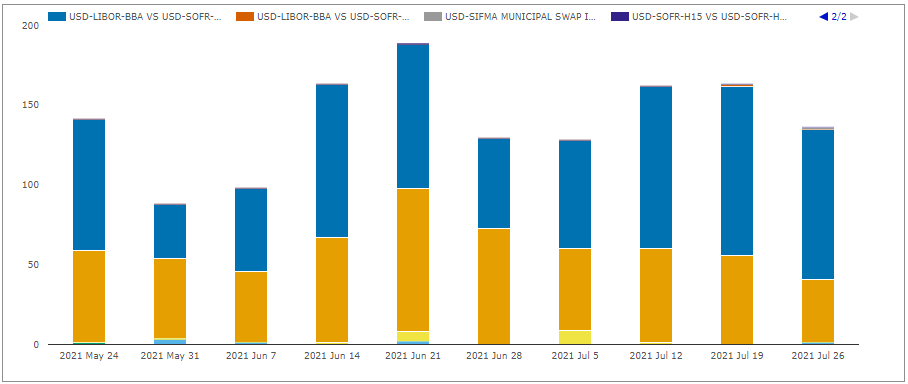
- SOFR vs Libor, blue bar, with 94 trades last week, similar to prior weeks
- SOFR vs FF, orange bar, with 40 trades, similar to prior weeks
- A single BSBY vs SOFR trade, of-course this is not clearable at any CCP yet
- A single SIFMA Muni vs SOFR trade, also not clearable
No obvious drop-off in SOFR vs Libor Basis trades, as that would be another sign that dealers were no longer relying on Libor liquidity for hedging client SOFR risk, by swapping from SOFR into Libor.
SOFR SpreadOvers
In SDRView Pro, we can focus on SOFR SpreadOvers, which as the main inter-dealer product was at the heart of the change postulated to happen on July 26th. Let’s look at the trades on Friday 30th July, the highest volume day last week.

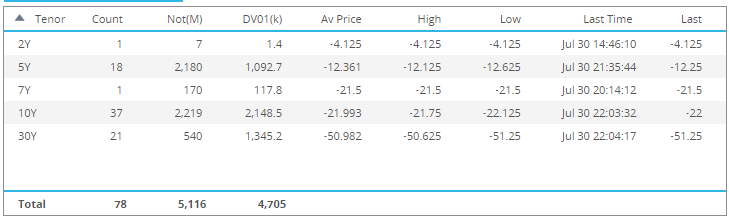
- 78 trades with $5.1 billion notional and $4.7 million dv01
- 10Y with 37 trades, $2.2b notional and $2.1m dv01
- 30Y with 21 trades, $540m notional and $1.3m dv01
- 5Y with 18 trades, $2.2b notional and $1.1m dv01
Compare that to the 3 trades on July 30th that were Libor SpreadOvers!
And during the week of 26-30 July, we saw 231 SOFR Spreadovers, $15b notional and $13m dv01, compared to just 58 Libor Spreadovers, $2.4b notional and $2m dv01.
Unequivocal to say the least, the Spreadover Swap market has moved from Libor to SOFR.
The numbers of trades and risk transacted demonstrating the liquidity and price formation for the 5Y, 10Y and 30Y points on the SOFR Swap curve.
And looking just at Spreadovers that are Curves (not in the data above).
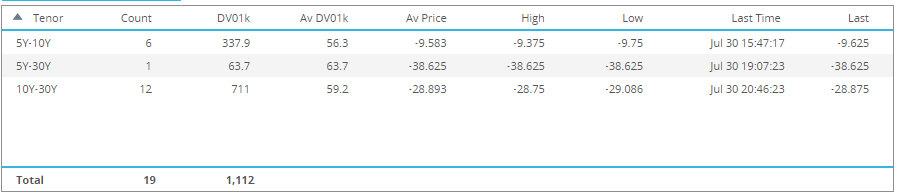
- 5Y-10Y with 6 trades and $340k dv01
- 5Y-30Y with 1 trade and $64k dv01
- 10Y-30Y with 12 trades and $700k dv01
Further establishing price formation for the middle and long end of the SOFR Swap Curve.
SOFR OIS and Basis Swaps
Next looking at all SOFR Swaps, OIS and Basis on July 30th.

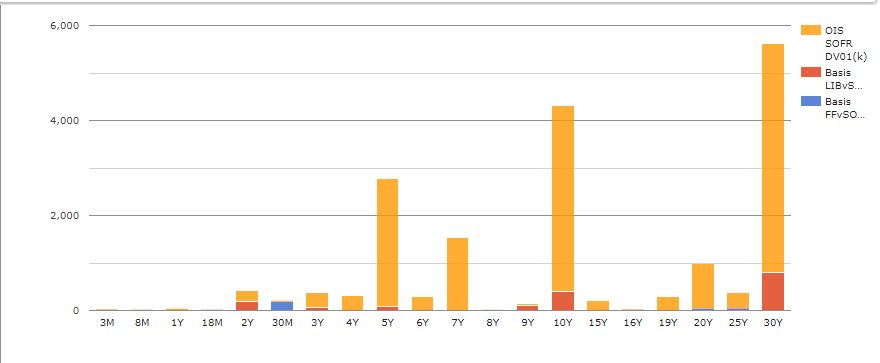
- 5Y, 10Y, 30Y OIS SOFR Swaps (Spreadover and Outright) dominating the risk profile
- OIS SOFR Swaps with 252 trades, $20b notional and $16m dv01
- Much smaller risk in SOFR v Libor Basis Swaps, in 2Y, 5Y, 10Y, 30Y
- SOFR vs Libor Swaps with 20 trades, $2.3b notional and $1.7m dv01
- SOFR vs FF with 6 trades, 3 in 30 months and on each in 8Y, 20Y, 25Y
The low number of trades and risk of Basis Swaps giving credence to the view that SOFR risk is now being traded and hedged as an outright risk at the 5Y, 10Y, 30Y points and no longer as a basis spread to Libor.
Swap Execution Facilities
Let’s now turn to SOFR products traded on SEF last week, using SEFView.

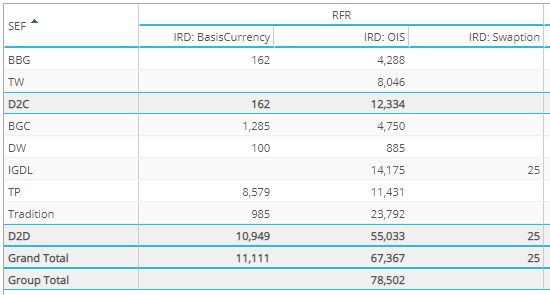
- OIS Swaps with $12b at D2C SEFs and $55b at D2D SEFs
- Tradition largest gross notional, followed by IGDL and TP
- Basis Swaps with $162m at D2C SEFs and $11b ay D2D SEFs
- TP dominant with $8.6b notional
- Swaptions, $25m at IGDL (Swaption straddle 10y10y)
In SEFView, we can also look at market share in dv01 terms, but that is one for another day.
Global Cleared Volumes
Finally, let’s look at global cleared SOFR Swap volumes in CCPView.

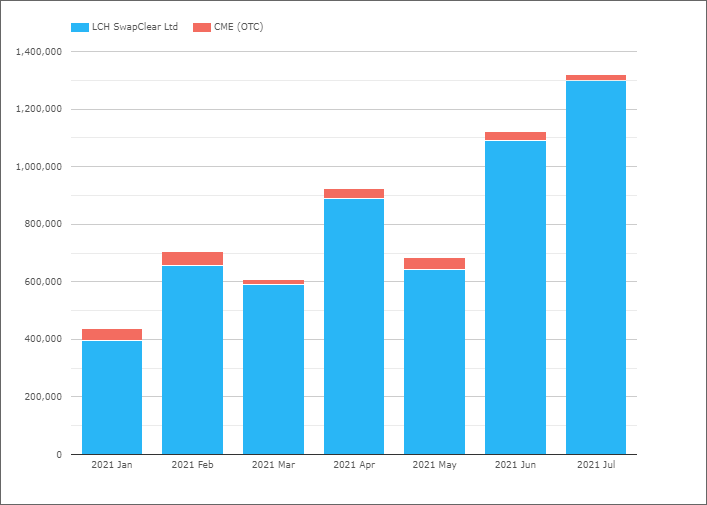
- July 2021 with a new high of $1.3 trillion gross notional (single sided)
- Up from $1.1 trillion in June 2021
Just one week after SOFR First, the increase of $200 billion notional in the month is an encouraging sign.
August a holiday month, generally has subdued volumes, so September will be the month to watch.
ISDA-Clarus RFR Adoption Indicator
Next week we will be publishing the ISDA-Clarus RFR Adoption Indicator for July.
It will be interesting to see if it exceeds the 11.7% record high for June.
My money is on that it will.
Any takers above 14%?
Remember it includes both Swaps and Futures in dv01 equivalents.
And six currencies AUD, CHF, EUR, GBP, JPY & USD.
So not a simple extrapolation from USD Swaps.