In my recent Basel III Leverage Ratio article I provided an introduction to this important new metric and today I will look at the Supplementary Leverage Ratio (SLR) disclosures published by the six largest US banks.
Background
An underlying cause of the global financial crisis was the build-up of excessive on- and off-balance sheet leverage in banks which apparently still maintained strong risk-based capital ratios. Consequently the Basel Committee on Banking Supervision (BCBS) proposed the introduction of a simple, transparent, non-risk-based leverage ratio designed to act as a credible supplementary measure to the risk-based capital requirements.
Public disclosure requirements in a prescribed format started in 2015, to allow for calibration, comparison and a smooth transition by banks prior to regulatory implementation in 2018/19.
Leverage Ratio
The definition in the BCBS document is:
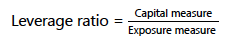
with a 3% minimum requirement, though subsequently some jurisdictions (e.g. US) have specified a buffer, resulting in higher ratios of 5% or 6% for global systemically important banks.
The Capital measure is Tier 1 Capital, which is mostly Common Equity.
The Exposure measure is the sum of on-balance sheet exposures, derivatives exposures, securities finance transaction exposures and off-balance sheet items.
Lets look at the data.
SLR Comparisons – 2016
Starting with the 2016 quarterly SLRs for the six largest US banks.
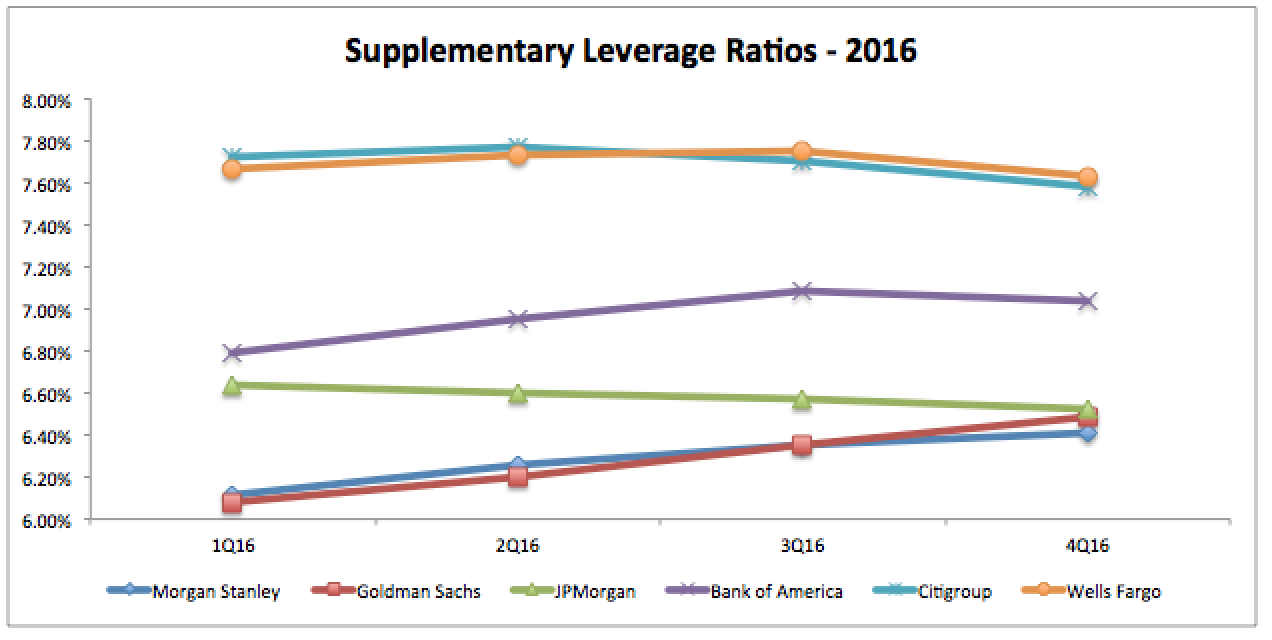
Showing that:
- All of these banks have ratios above 6%, so well above the minimum requirements
- Morgan Stanley and Goldman Sachs have increased SLRs from just above 6% to just below 6.5%
- JP Morgan Chase’s SLR was 6.64% in 1Q2016 and ended the year at 6.52%, so slightly down
- These three firms seem to have converged on the same 6.5% number
- Co-incidence or a deliberate choice?
- Bank of America SLR is up from 6.79% to 7.04% and is by itself in the middle of the other banks
- Citigroup and Wells Fargo with the highest at 7.6%, slightly down from 7.7% at the start of the year
I expect some of these trends are down to a deliberate strategy to manage SLR to a target value and some down to the business mix and the business environment that these firms are in.
Interesting though that we see three different values (choices?) with 6.5%, 7% and 7.6%.
SLR can be increased by either increasing the Capital measure or decreasing the Exposure measure and decreased by doing the opposite, so lets look at which of these has happened for the six banks.
Capital Measures – 2016
First the trend in the Capital Measures.
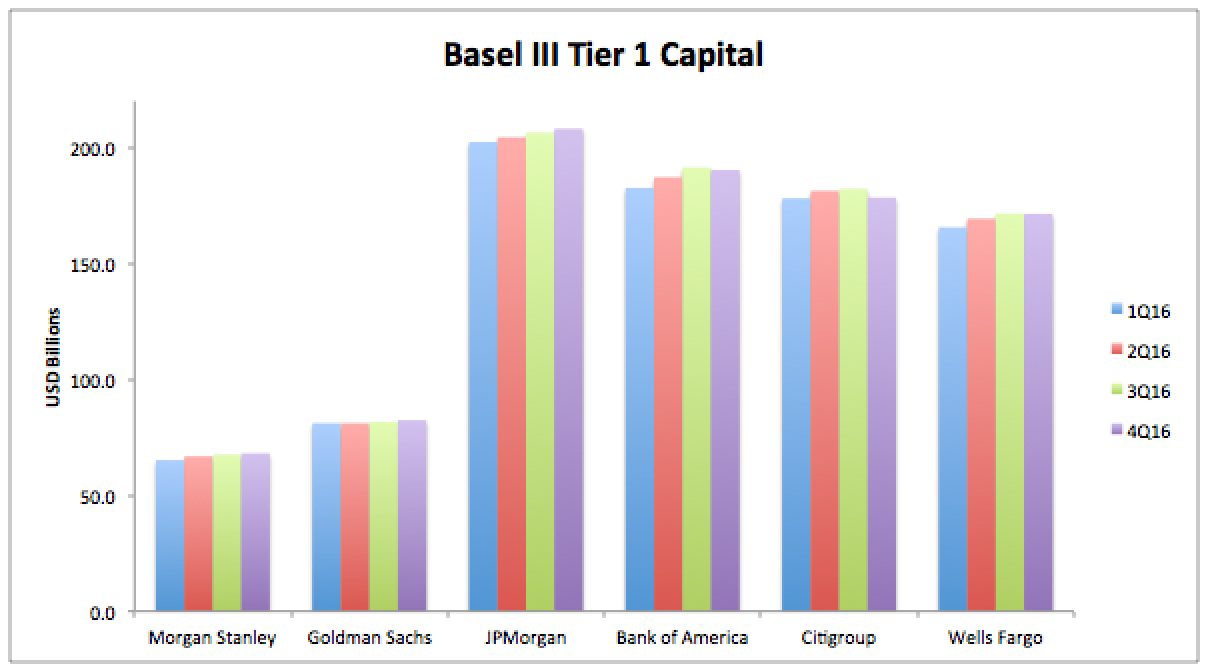
Showing:
- The relative Tier 1 Capital held by these firms
- Ranging from $68 billion to $208 billion
- Morgan Stanley’s capital is up 4.4% in the period, from $65.2 billion to $68.1 billion
- Goldman Sachs’s capital is up 1.6%, from $81.1 billion to $82.4 billion
- JP Morgan Chase’s capital is up 2.8% from $202 billion to $208 billion
- Bank of America’s capital is up 4.2% from $183 billion to $190 billion
- Citigroup’s capital is up 0.2% from $178.1 billion to $178.4 billion
- Wells Fargo’s capital is up 3.5% from $165.6 billion to $171.4 billion
So each firm has increased capital.
Citigroup by the least and Morgan Stanley and Bank of America by the most.
Exposure Measures – 2016
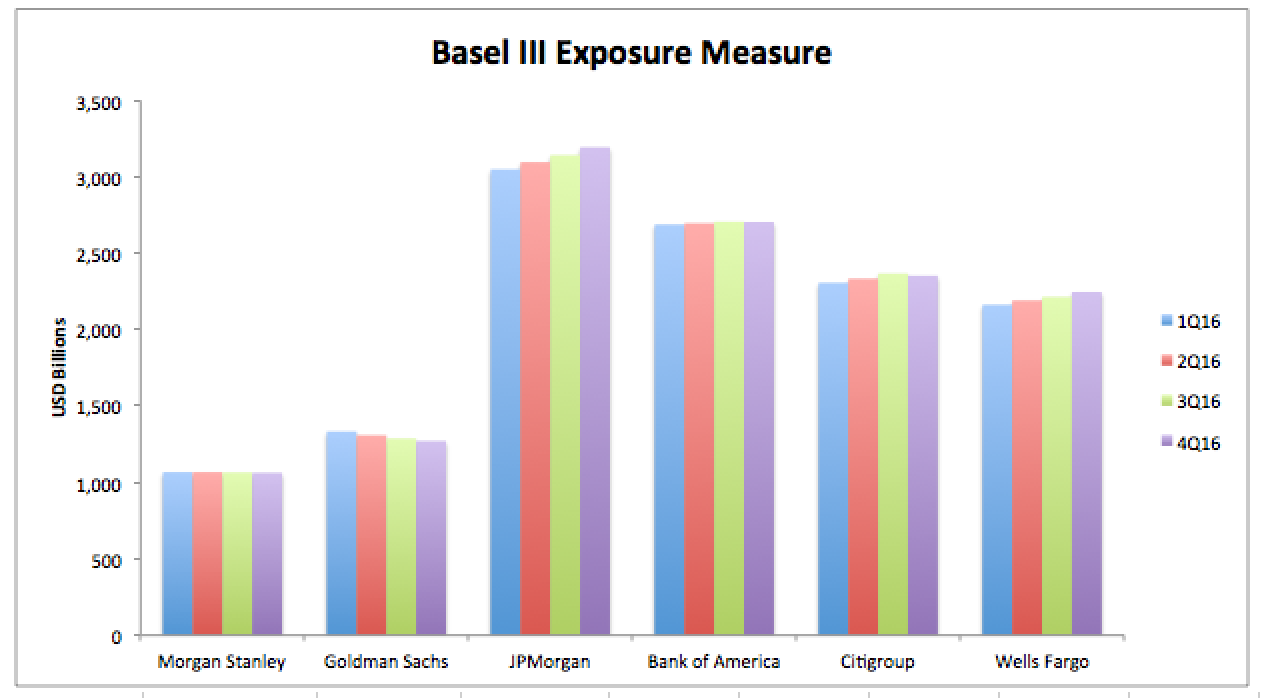
Showing that:
- The relative leverage exposures for each of the banks
- Ranging from $1 trillion to $3.2 trillion
- Morgan Stanley’s exposure is down just 0.4% to $1,063 billion
- Goldman Sachs’s exposure is down 4.7% to $1,271 billion
- JP Morgan Chase’s exposure is up 4.7% to $3,192 billion
- Bank of America’s exposure is up 0.6% to $2,703 billion
- Citigroup’s exposure is up 2% to $2,352 billion
- Wells Fargo’s exposure is up 3.9% to $2,245 billion
SLR Changes in 2016
This data on Capital and Exposure Measures tells us that:
- Morgan Stanley’s SLR has increased due to higher capital
- Goldman Sachs’s SLR has increased due to decreasing leverage
- Bank of America’s SLR has increased due to higher capital
- JPM, Citi, Wells SLRs are just down 0.1% with both higher capital and higher exposure
Interesting.
Lets now take a deeper dive into the components of the Exposure measure for one of the banks.
Morgan Stanley Disclosures
The total exposure for each quarter can be broken down as below.
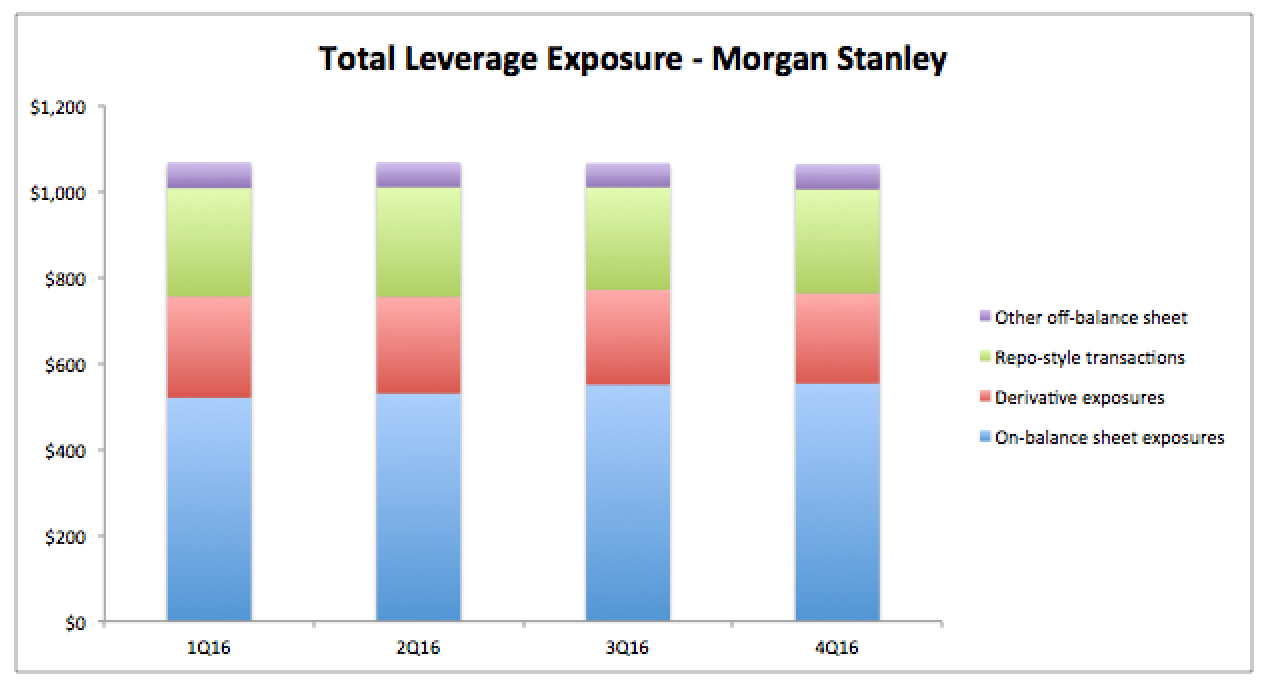
Showing that:
- On-balance sheet exposures are the largest component, just over 50%
- On-balance sheet exposures have increased from $520 billion to $533 billion
- Repo-style transaction exposures are the next largest, decreasing from $252 billion to $242 billion
- Derivatives exposures are similar in size and have decreased from $235 billion to $209 billion
- A steeper decrease of 11% compared to the 4% for repo-style transactions
- Other off-balance sheet exposures are the smallest component at $60 billion
As Derivatives is our main area of interest, lets now dig deeper into the Derivatives exposure numbers.
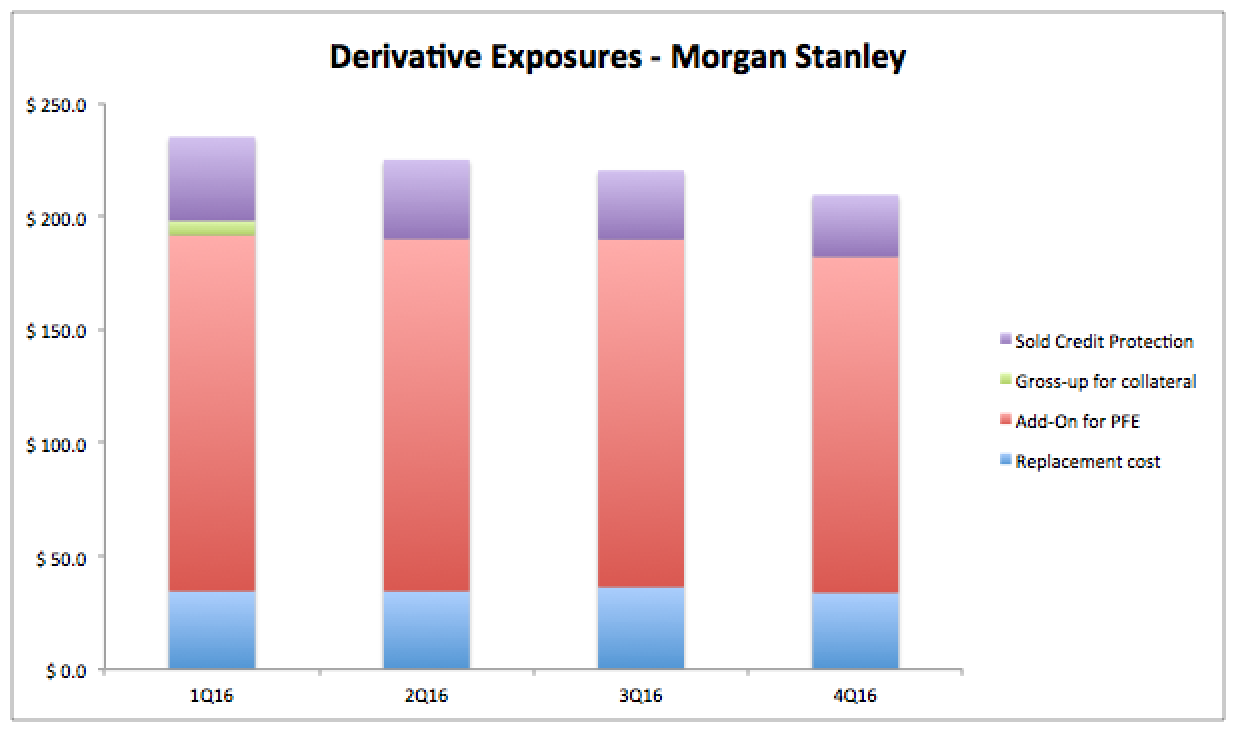
Showing that:
- Add-on amounts for Potential Future Exposure (PFE) is by far the largest component
- This has decreased from $157 billion to $143 billion
- Replacement cost is the next largest component
- This has decreased from $34.5 billion to $33.8 billion
- (See SA-CCR for details on Replacement Cost and Add-On for PFE).
- Sold Credit Protection is down from $37 billion to $27.4 billion
- (I have derived this from two numbers, the effective notional principal amount of sold credit protection minus the effective notional principal amount offsets and PFE adjustments for sold credit protection, see tables in Basel II Leverage Ratio)
Now we have an understanding of the components of the exposure measure, lets look at the key Derivatives measures for our six banks.
Derivative Exposures
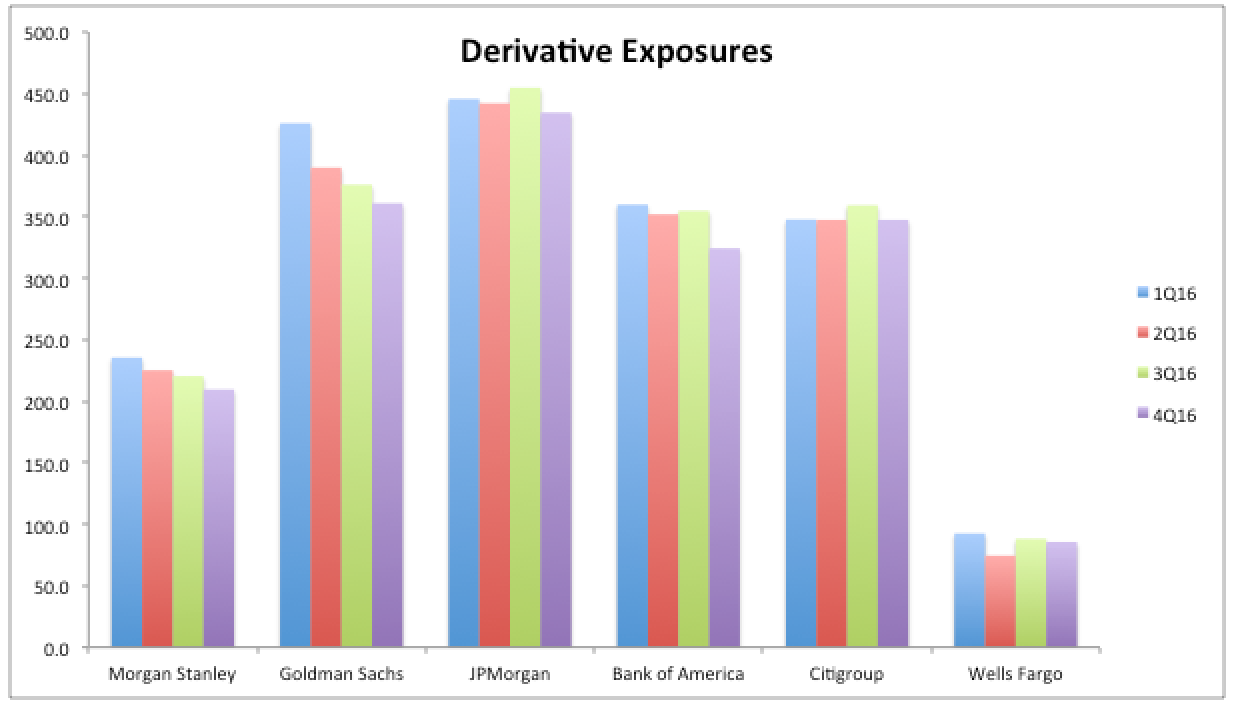
Showing that:
- Morgan Stanley’s Derivative exposure is down 11%, from $235 billion to $209 billion
- Goldman Sach’s Derivative exposure is down 15%, from $426 billion to $360 billion
- JP Morgan Chase’s Derivative exposure is down 2.5% from $446 billion to $435 billion
- Bank of America’s Derivative exposure is down 10% from $360 billion to $324 billion
- Citigroup’s Derivative exposure is unchanged at $347 billion
- Wells Fargo’s Derivative exposure is down 7.5% from $93 billion to $86 billion
So except for Citigroup, all the rest have lower Derivatives exposure.
Delving deeper into the trends of the main components; Add-on for PFE, Replacement Cost and Sold Credit Protection, we can ascertain the following:
- Morgan Stanley’s decrease is in equal amounts from Add-on for PFE and Sold Credit Protection ($9b each)
- Goldman Sachs’s decrease is from Add-on for PFE ($23b) and Sold Credit Protection ($7 billion)
- JP Morgan Chase’s decrease is from Add-on for PFE ($9b)
- Bank of America’s decrease is from Sold Credit Protection ($24 billion) and Replacement Cost ($6 billion)
- Citigroup’s no-change is from Add-on for PFE up by $7b and Sold Credit Protection down by $7 billion
- Wells Fargo’s decrease is from Sold Credit Protection down by $14b with Add-On for PFE up by $4 billion
Thoughts
Commonly we see a drop in Add-On for PFE and Sold Credit Protection for most firms.
Does this reflect a shrinking market for Derivatives?
Not necessarily.
The Add-On for PFE number utilises gross measures of notional and firms may be focused on optimising these by for instance compression of swaps, more cleared volume compared to bi-lateral, improvements in netting agreements for bi-lateral and similar notional reduction but risk neutral activities.
In-fact such management of Add-On for PFE and Leverage Ratios is becoming a more common post-trade optimisation activity and one that all firms should be doing to free up capital and leverage constraints in order to do more new business.
The reduction in Sold Credit Protection may also benefit from such optimisation, but looking at the two constituent disclosures of this number, it looks like a general reduction across the broad in selling credit protection, presumably Credit Derivatives.
That’s all for today.
Summary
SLR disclosures shed light on how these ratios are changing.
The six largest US banks are either at 6.5%, 7%, 7.6%.
Either higher capital or lower exposures has increased SLR for some firms.
Derivatives exposure is down, mainly driven by Add-on for PFE.
Most likely due to better management and optimisation of this measure.
Sold Credit Protection exposure is also down.
Possibly due to market demand and supply.
It will be interesting to look into more detail on 2017 trends.
A quick look at 1Q 2017 SLRs shows Morgan Stanley is up from 6.41% to 6.5%.
I intend to do so once we have a few quarters of 2017 SLR disclosures.