- Is the Leverage Ratio impacting Swaps Trading in Europe?
- This is a question posted by the authors of a recent ECB Working Paper, “The anatomy of the euro area interest rate swap market“.
- We provide an overview of the paper and look through the window that it provides into post-trade data in Europe.
Executive Summary
The study provides an overview of swaps trading in Europe, using Trade Repository data available only to the regulatory community. My three key take-aways from the paper were:
- EUR IRS is concentrated amongst G16 dealers and 10 core intermediaries (as well as CCPs).
- Leverage Ratio plays a key role in determining IRS activity.
- Price dispersion continues to exist in EUR IRS.
1.7 million swaps were analysed as part of a “fully identified data-set”. This swaps data should also be publicly available (in anonymised form) as part of MIFID II post-trade disclosures too – if anyone could actually access it (yes, we are still waiting).
Leverage Ratio
Interested readers can see Amir’s previous blog on the Leverage Ratio, whilst I assume that most of our readers are pretty familiar with it by now. In a nutshell, Basel III requires banks to hold capital against derivatives with a risk weight of 100%. The risk sensitivity of this measure is quite low, and many market participants, researchers and even regulators have suggested that leverage ratio is now a key determinant of trading activity.
This study from the ECB looks into whether the leverage ratio influences gross and net trading activity in IRS.
Data
The study is based on Trade Repository data as at 30th March 2018. As we’ve seen before in similar papers, the data starts with about 4 million swaps (made available only to regulators), but there are substantial problems with the data. In this paper, the authors outline the following redactions from the data-set that they had to perform:
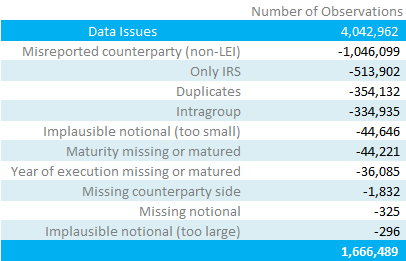
So yes, they had to throw away 59% of the data-set!
We’ve said it before and we’ll say it again. You DO NOT see this same problem with post-trade data in the US. This is because it is publicly available, for free, and readily accessible. This results in a positive feedback loop of market participants actually using the data and correcting any discrepancies. Europe – catch up. There is currently zero usable post-trade transparency in Europe.
European post-trade data needs to be:
- FREE
- UNEMCUMBERED FOR USE
- ACCESSIBLE
- TIMELY
[Sorry for shouting…]
Analysis
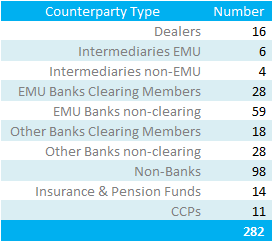
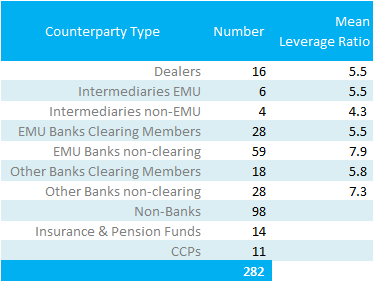
What is perhaps most surprising about the data set used in this study, is that the overall market shows a 55% to 45% split of Cleared vs Uncleared. Really? This covers an array of currencies (it is not just EUR IRS), but then we learn that there are 174 counterparties active in the cleared market….versus 55,611 in the uncleared market! The authors state that the 282 counterparties below account for 95% of the overall market exposure.
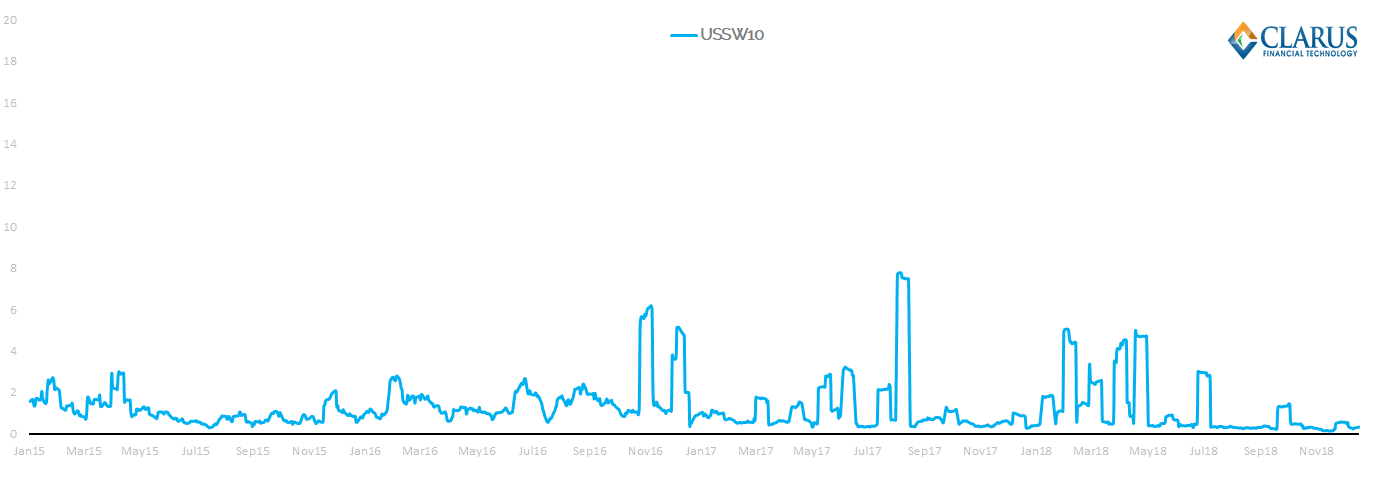
For comparison, we see over 92% of the US SDR IRS trades as cleared during 2018 (all currencies, Fixed-Float IRS):
![]()
Unfortunately for this study, the TR data is also pretty useless for price transparency. According to the analysis, they are left with only 30,775 transactions that they can use to perform price analysis (e.g. price dispersion) on. For reference, the price dispersion that I recently analysed in 10 year USD Swaps only was run on 73,209 trades!
Hypothesis: Banks’ leverage ratios are positively related to their IRS market activity
Let’s now cut to the meat of the study. Is the leverage ratio regime working? Is it having any intended/unintended consequences?
We already know from the descriptive statistics in this study that the most active counterparties in the market (Dealers and Intermediaries) have the lowest Leverage Ratios – see table below.
Therefore, the authors (very sensibly) test the hypothesis of whether trade activity is a function of both leverage ratio and total assets. They specifically test the following equation:
\( \tag {1} Trade Activity_k = α + β_j + BA_k + RWC_k + LR_k + L_k + L_k . BA_k + ε_k \)where;
BA = log of total assets of a bank (i.e. bank size).
RWC = risk-weighted capital ratio.
LR = liquidity ratio.
L =leverage ratio.
For now, I just consider α, β and ε as constants to solve for in the equation.
This allows the authors to check, statistically, whether activity in the IRS market was linked to Leverage Ratio. They found:
“Bank’s leverage ratios are negatively correlated to their IRS market activity. Banks that are more active in trading derivatives have lower leverage ratios. “
They further state that interacting the leverage ratio with bank size suggests that:
“Banks with lower leverage (i.e. higher capital to total assets) are more active in IRS”.
I reproduce the full statistical table below. You can see that the initial hypothesis has an r-squared over 78%, suggesting a very strong link between overall market activity and leverage ratio.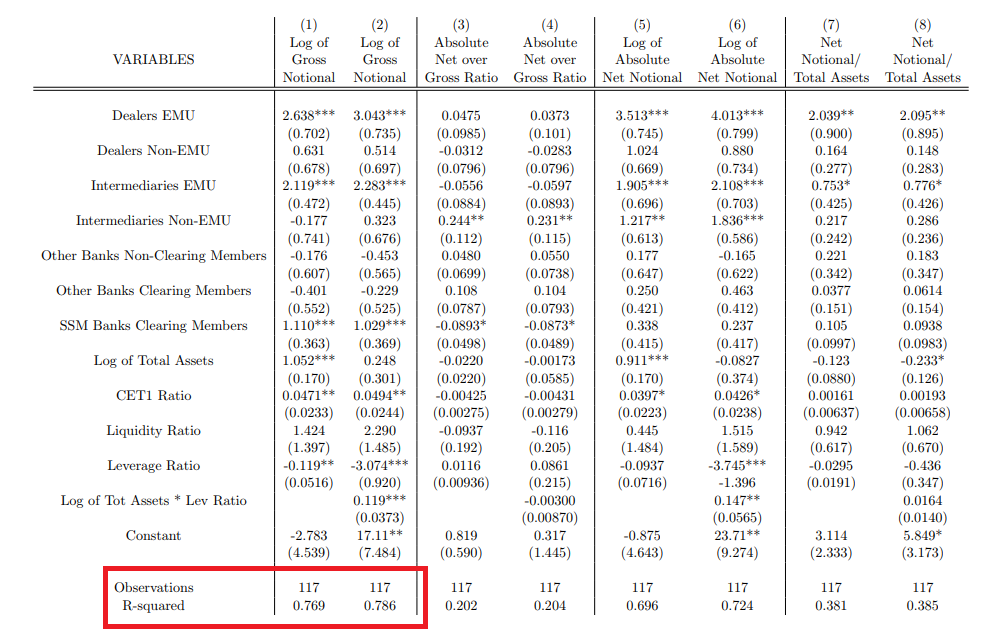
Further results in the study show that:
“IRS market activity is not significantly related to a bank’s liquidity, whereas capital indeed plays a significant role.”
Study Conclusions
Overall, the paper concludes:
- Market activity is not concentrated on a few global dealers (G16). Intermediaries (a further 10 banks) provide a significant contribution to trading activity.
- Bank size is not the only variable able to explain trading activity. Basel III capital and liquidity ratios play a significant role.
I think it remains an interesting study into European data and sheds a light where public post-trade transparency has so far failed. Please see the full paper here.