As we have now released Swaptions in SDRView Professional, I wanted to re-visit parts of my article “Swaptions Clearing, A More Detailed Look” and this time focus on trading On SEF versus Off SEF.
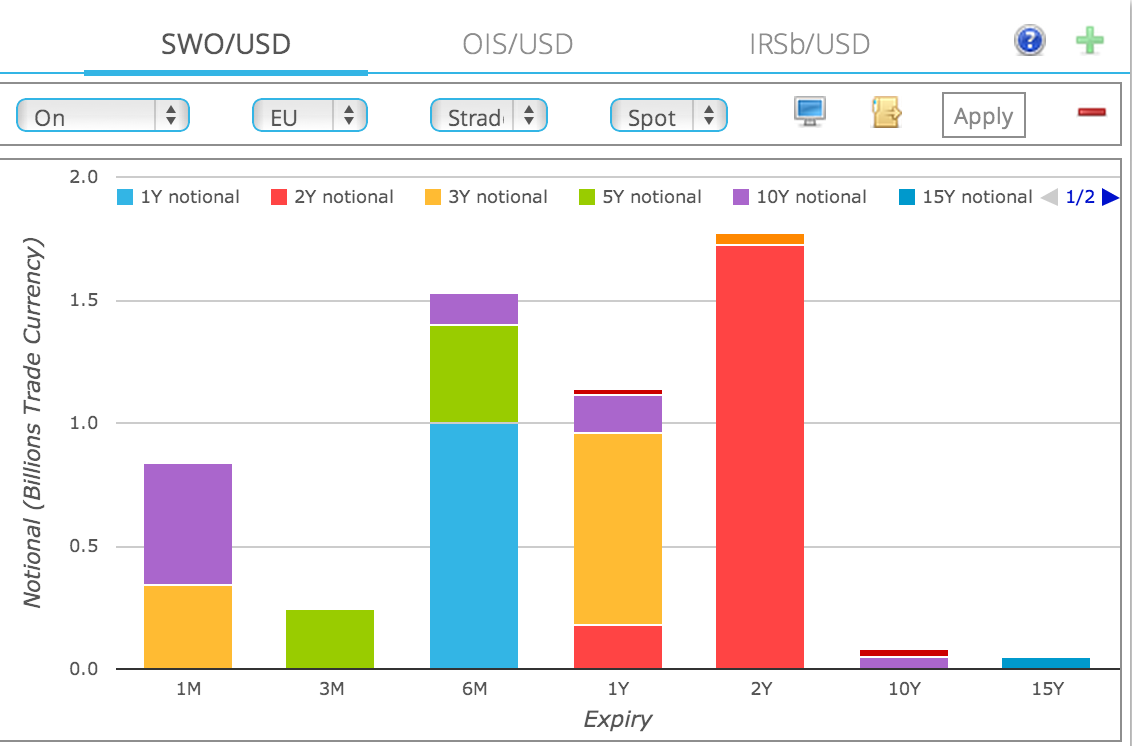
USD Straddles – ON SEF
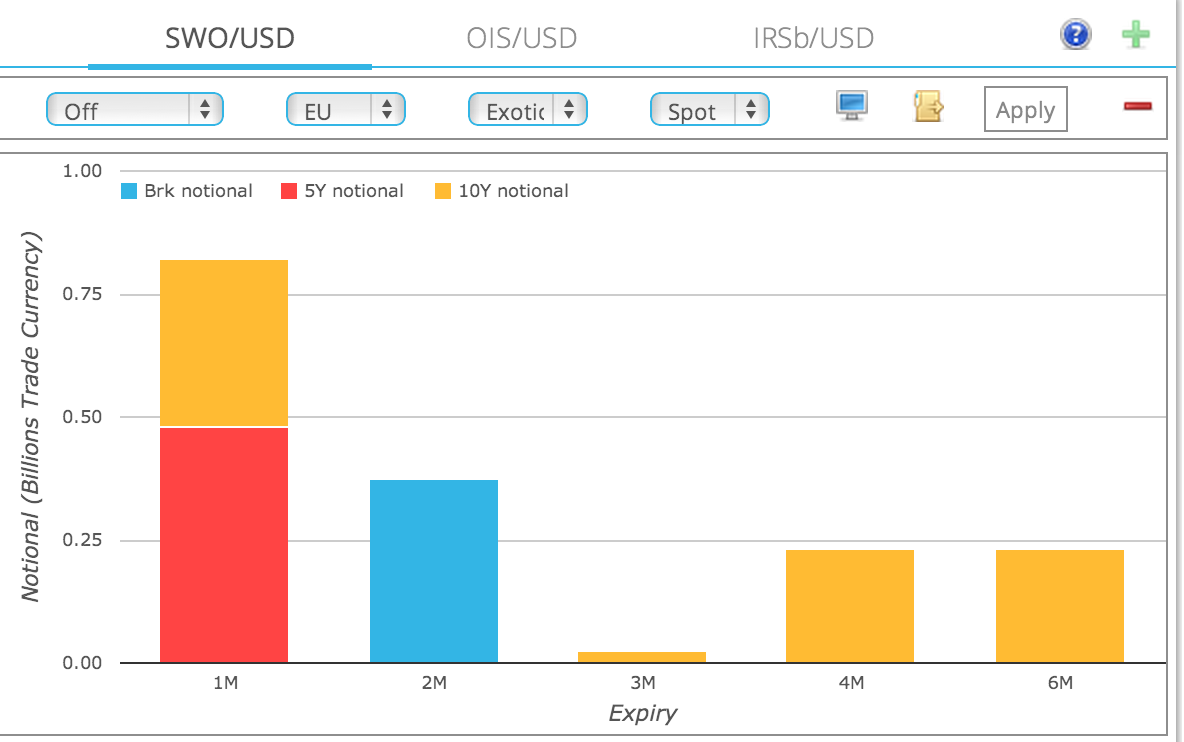
Lets start with a chart of On SEF USD Swaption Straddles showing Notional vs Expiry for the business day of 14 Jan 2014.
And then the same information in a table:
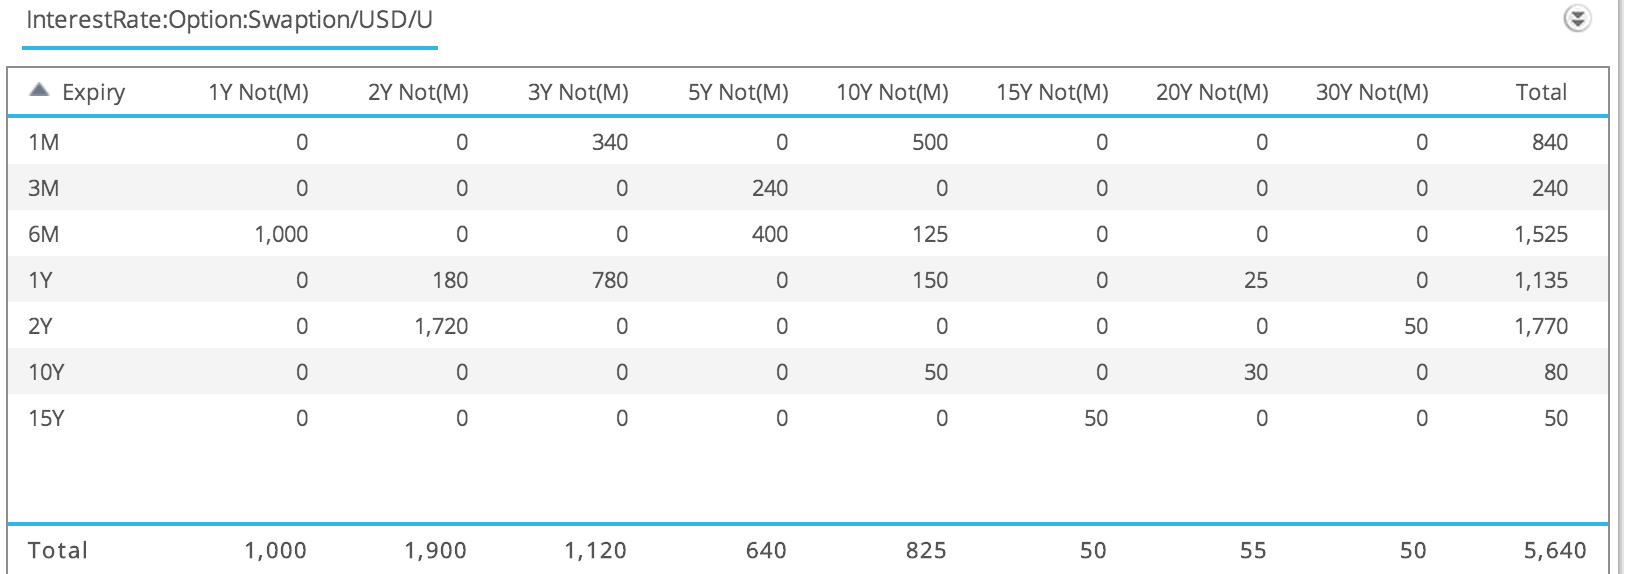
From which we can observe that on this business day:
- 2Y into 2Y has the highest volume of at least $1.72 billion.
- Drilling down on this (not shown here) would tell us there are 6 trades that make up this number
- One of $100m, two of $200m, one of $300m and two capped at $460 million
- These last two could be much higher notionals
- The next largest expiry tenor is 6M into 1Y with $1 billion (from two trades of $500 million)
- Followed by 1Y into 3Y and 6M into 5Y, …
- Total Notional traded On SEF is more than $5.64 billion with 35 trades
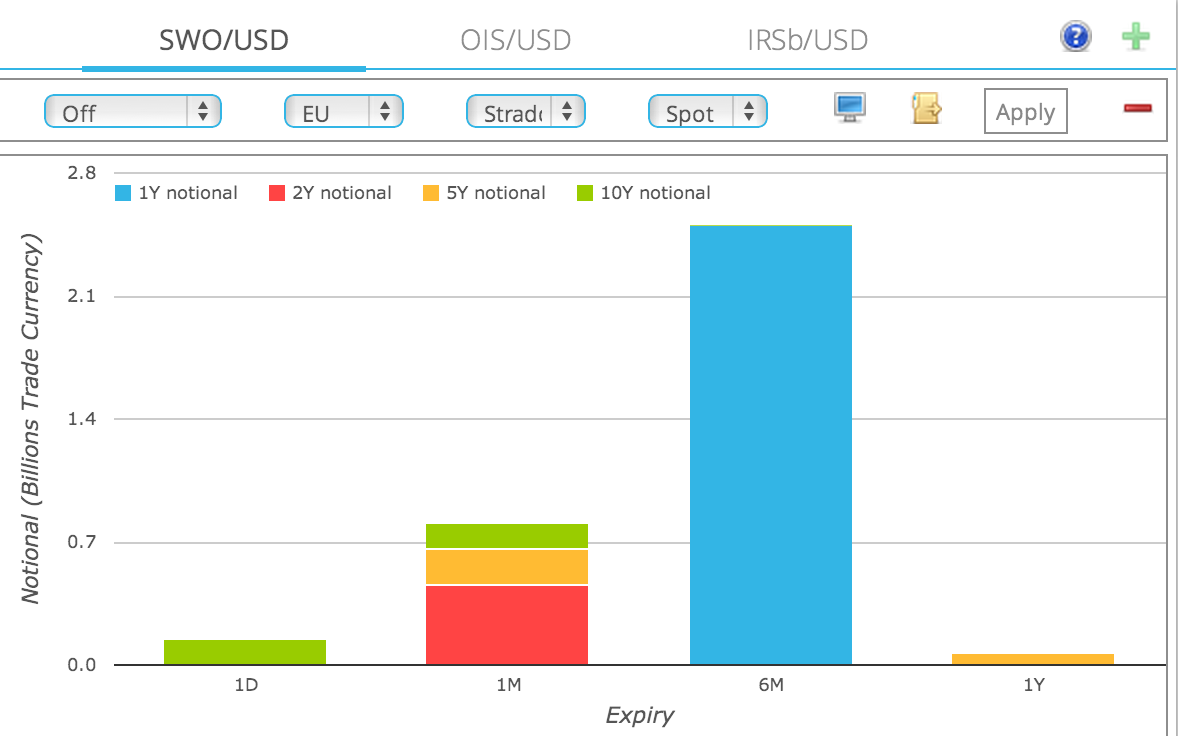
USD Straddles – Off SEF
Lets now compare with Off SEF trading on the same day.
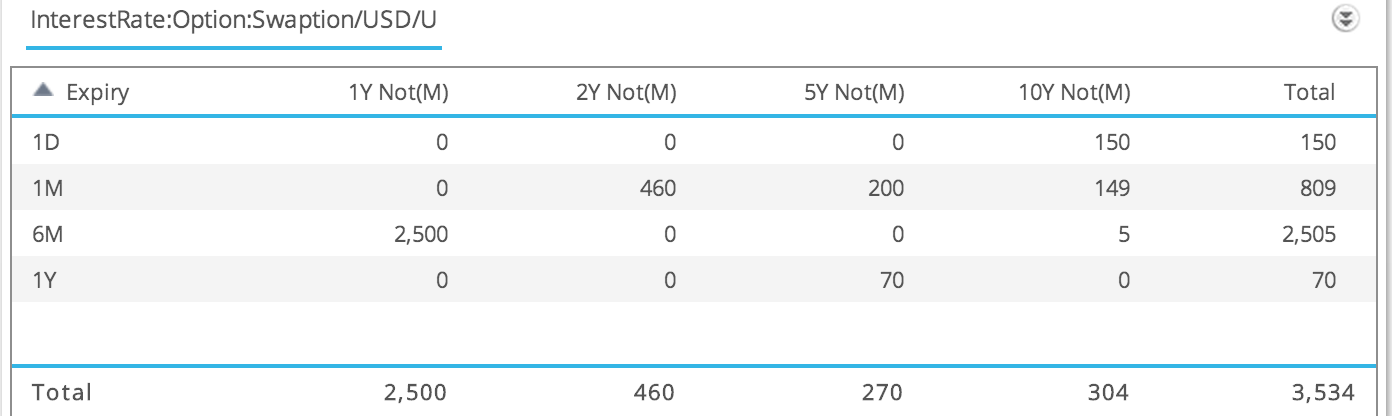
From which we can observe that:
- 6M into 1Y is the highest volume at $2.5 billion
- Drill-down would shows us that this came from four trades
- One of $1 billion and three of $500 million
- (Remember Cap sizes depend on tenor, so are larger for shorter maturities)
- The next largest expiry is 1M into 2Y, then 1M into 5Y, 1M into 10Y, …
- Total notional traded Off SEF is more than $3.5 billion with 13 trades
Straddles On SEF vs Off SEF
So on this one business day, we can see that On SEF is 60% and Off SEF is 40% of activity.
Comparing volume for the week 8 – 14 Jan, we see On SEF is $23.5b and Off SEF is $17.8b, so again close to 60% to 40%.
Looking at Expiry vs Tenor, there is more variation traded On SEF than Off SEF.
What about Payers & Receivers
We could repeat the above but selecting only Payers, only Receivers or both Payers & Receivers.
However except for presenting the table below, I will leave that to those of you who are interested to do yourself in SDRView.
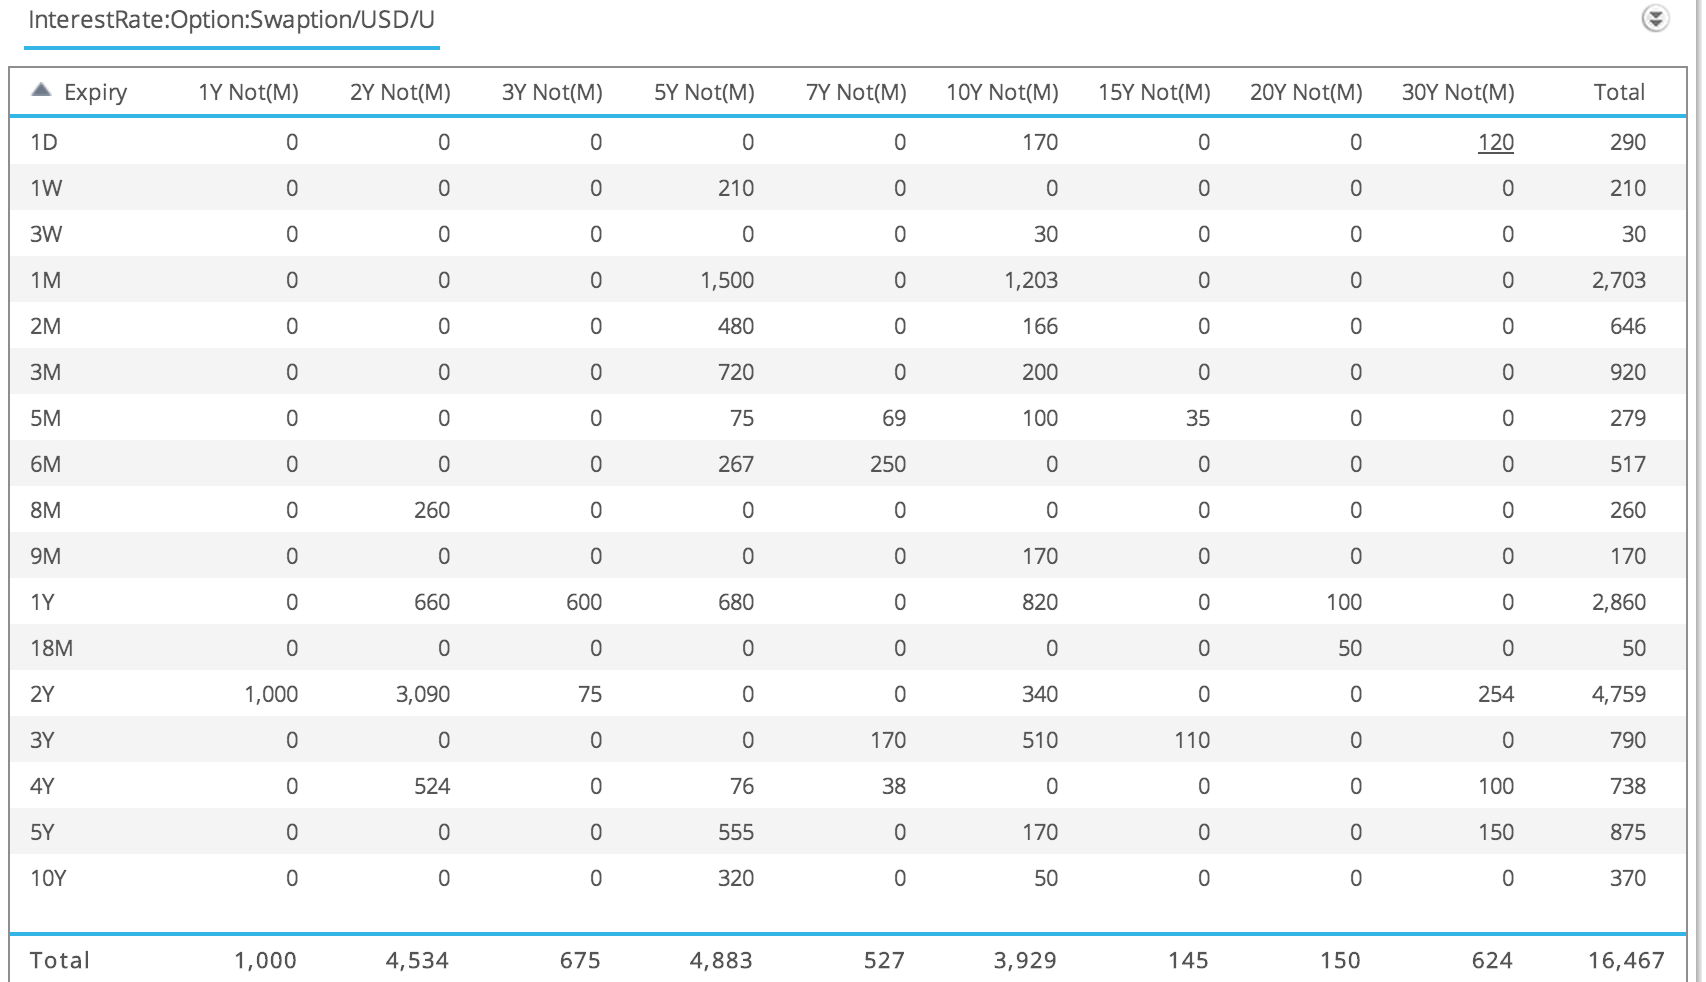
From which we can observe that for Payers/Receivers on 14 Jan:
- More than $16.4 billion is traded with 111 trades
- 2Y into 2Y is the largest with $3 billion
- 1M into 5Y and 1M into 10Y are $1.5b and $1.2 billion respectively
- There are long swap tenor trades, so 2Y into 30Y or 5Y into 30Y
- As well as long option expiry trades with 10Y into 5Y and 10Y into 10Y
Where are the Exotics?
Well un-surprisingly there are none On SEF.
But there are trades Off SEF.
In-fact on 14-Jan there are:
- 26 trades with $1.7 billion notional
- With the type label “XX” for Exotic
- Now these might be very simple exotic or second generation, but we have no way of knowing from the public feed
- Just that a reasonable amount of activity takes place in these on most business days
Summary
Well that is it for today.
USD Swaptions trading activity is now highly visible. In terms of volume, expiry, tenor and strike.
On SEF represents on average 60% of Straddles volumes.
There is much more we are working on to improve visibility into Swaptions trading.
In the meantime, I invite you to explore for yourself in SDRView.