Clearing houses have published their latest CPMI-IOSCO Quantitative Disclosures for Q2 2025.
Key takeaways
- Initial margin (IM) for major ETD CCPs was a new record $582 billion – up 14 percent QoQ and up 24 percent YoY. This exceeded the prior peak of $571 billion in Q1 2022.
- IM for our nine selected IRS CCPs was a new record $365 billion – up 7.0 percent QoQ and up 18 percent YoY. This comfortably exceeded the previous all-time high of $347 billion on 31 March 2023.
- IM for cleared CDS was $64 billion – down 4.5 percent QoQ, and up 7.5 percent YoY, but well below the peak of $77 billion in Q2 2022.
- In Q2 2025, several major CCPs show record highs in quantitative disclosures other than IM. Highlighted below are CME, DTCC, Eurex, HKEX, JSCC, LCH, OCC.
Background
Under the CPMI-IOSCO Public Quantitative Disclosures, central counterparties (CCPs) publish over 200 quantitative data fields covering margin, default resources, credit risk, collateral, liquidity risk, back-testing, and more.
CCPView has more than 8 years of these quarterly disclosures for 44 clearinghouses, each with multiple Clearing Services, covering the period from 30 September 2015 to 30 September 2025. This disclosure data provides insights into trends over time at one CCP, and comparisons between CCPs.
Let us look at the latest disclosures. I also include charts of cleared open interest (OI) or notional outstanding to compare their dynamic with that of IM.
IM for IRS

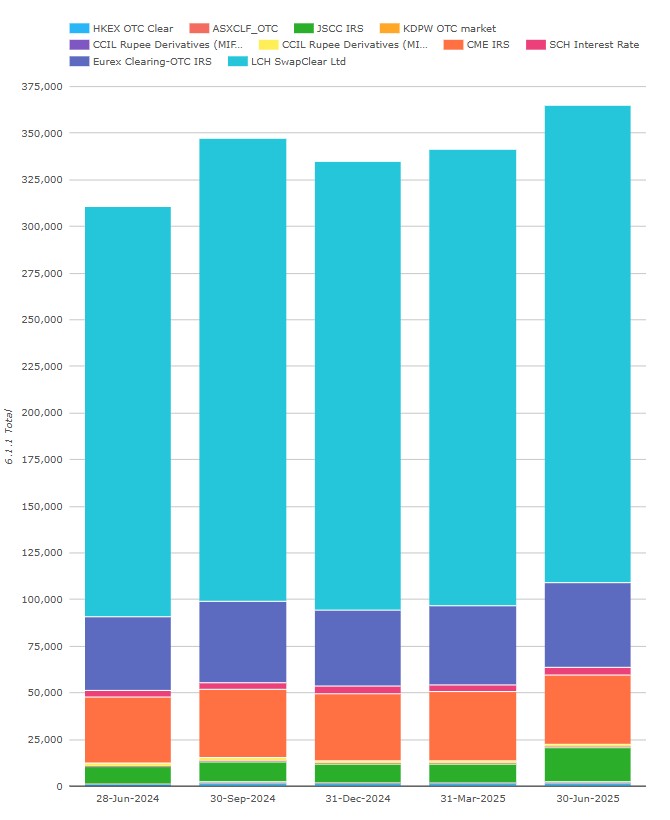
Chart 1a: IRS IM by CCP ($ millions). Source: CCPView.
Chart 1a includes five other CCPs along with the four, major IRS CCPs (which are stable at around 98 percent of the total volume). IM for all nine CCPs totaled $365 billion on 30 June 2025 – up $23.8 billion or 7.0 percent QoQ, and up $54.8 billion or 18 percent YoY. This level is a new record – comfortably exceeding the previous all-time high of $347 billion on 31 March 2023.
- LCH SwapClear reported $256 billion or £187 billion – in GBP terms, down 0.9 percent QoQ, and up 7.6 percent YoY, having peaked at £192 billion in Q2 2024.
- Eurex OTC IRS had $45.4 billion or €38.7 billion – in EUR terms, down 1.3 percent QoQ, and up 4.2 percent YoY, and well below its Q4 2022 high of €59.4 billion.
- CME IRS disclosed $37.3 billion – up 0.3 percent QoQ, and up 5.6 percent YoY, only 0.3 billion from its Q2 2022 high of $37.6 billion.
- JSCC IRS revealed $18.7 billion or ¥2,694 billion – in JPY terms, up all of 81 percent QoQ, and up 89 percent YoY.
- The five other CCPs were Shanghai Clearing (from China) with $3.84 billion, OTCClear (from Hong Kong) with $1.83 billion, CCIL (from India) with $1.42 billion across both MIBOR and MIFOR, ASX (from Australia) with $299 million, and KDPW (from Poland) with $243 million.
The JSCC IM level is a new record, exceeding its Q3 2023 high of ¥1,941 billion. For more on the recent JPY swaps volume dynamic, see our recent blog.

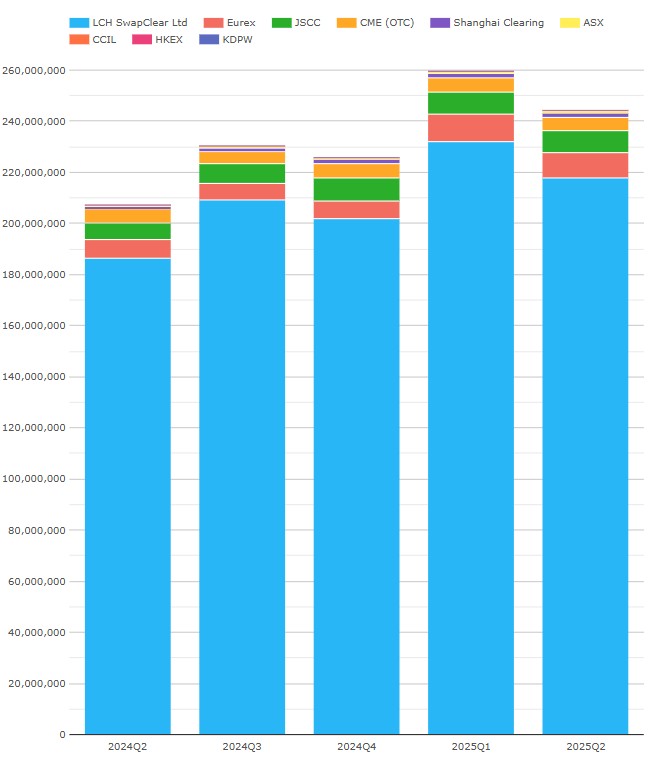
Chart 1b: IRS notional volumes by CCP ($ millions). Source: CCPView
Chart 1b shows that traded notionals in USD terms were down from the Q1 high and CCPs’ shares did not shift very much. This suggests that recent changes in JSCC margin rates drove the big shift in JSCC IM rather than trading activity.
IM for CDS

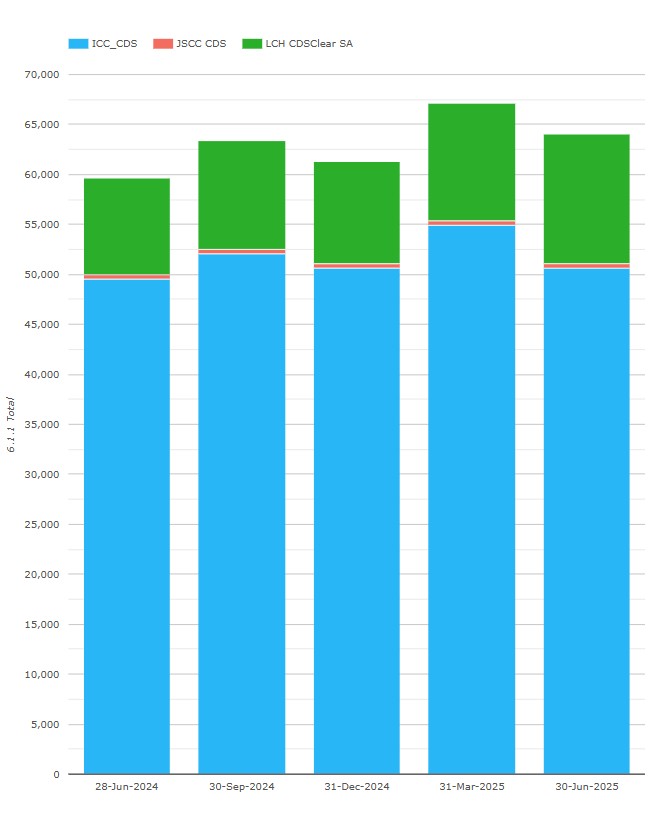
Chart 2a: CDS IM by CCP ($ millions). Source: CCPView.
Chart 2a shows that IM at major CDS CCPs totaled $64.1 billion on 30 June 2025 – down 4.5 percent QoQ, and up 7.5 percent YoY, but well below the peak just below $77 billion in Q2 2022.
- ICE Credit Clear disclosed $50.7 billion – down 7.7 percent QoQ, and up 2.3 percent YoY, but below its $58.8 billion peak in Q2 2022.
- LCH CDSClear reported $13.0 billion or €11.1 billion – in GBP terms, up 1.7 percent QoQ, and up 22.4 percent YoY. This is a new record – exceeding the prior CDSClear high of €10.9 billion in Q1 2025.
- JSCC CDS reported $436 million or ¥63.0 billion – in JPY terms, up 0.4 percent QoQ, and down 2.5 percent YoY, and far below its ¥184 billion peak in Q1 2020.

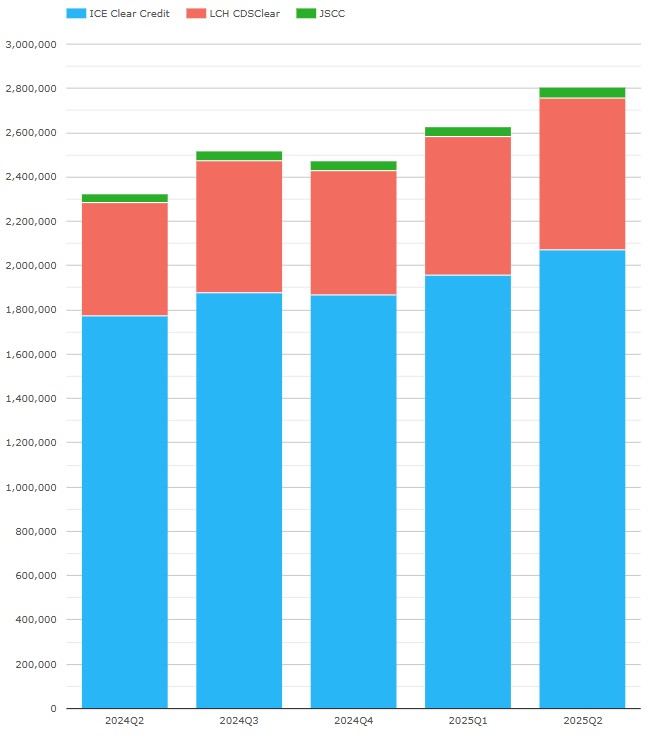
Chart 2b: CDS OI by CCP ($ millions). Source: CCPView.
Chart 2b shows CDS OI moving up while, JSCC excepted, IM moved down in Q2 2025. I am interested in views on the cause of this disjoint movement.
IM for ETD


Chart 3: ETD IM by CCP ($ millions).
IM at our selected ETD CCPs was $582 billion on 30 June 2025 – up QoQ by 14 percent ($70.7 billion), and up YoY by 24 percent ($112 billion). This is a new record, exceeding the prior peak of $571 billion all the way back in Q1 2022. (The chart shows higher totals as Eurex includes OTC IRS IM, which I exclude).
- CME disclosed $254 billion – up 12 percent QoQ, and up 29 percent YoY.
- OCC had $142 billion – up 20 percent QoQ, and up 32 percent YoY.
- ICE Europe F&O declared $83.7 billion – up 7.1 percent QoQ, and up 3.8 percent YoY.
- Eurex divulged $44.3 billion – up 19 percent QoQ, and up 21 percent YoY.
- ICE US F&O showed $20.4 billion – up 17 percent QoQ, and up 20 percent YoY.
- JSCC OSE Listed ETP reported $12.6 billion – up 2.1 percent QoQ, and down 1.6 percent YoY.
- SGX-DC had $9.29 billion – up 8.8 percent QoQ, and up 24 percent YoY.
- HKEX HKCC declared $9.3 billion – up 28 percent QoQ, and up 69 percent YoY.
- ASX CLF ETD and ASX CL ETD combined divulged $6.17 billion – up 8.5 percent QoQ, and up 16 percent YoY.
- LCH Listed Rates reported IM of $6 million – up 50 percent QoQ. This represents clearing of FMX’s interest rate futures, which went live in 2024.
Other disclosures of interest
We can use a CCPView feature to highlight metrics that change significantly more than 10 percent. Let us use this to scan Q2 2025 disclosures for the major clearinghouses.
- CME Base reported kccp (4.2.1) was 37 – down from 66 QoQ, and from 161 YoY.
- CME reported maximum total variation margin paid to the CCP on any business day was a record $30.8 billion – up 84 percent from the prior record of 16.8 billion in Q4 2024.
- DTCC GSD (providing UST bond and repo clearing as discussed in my ION Markets Blogs) reported their total IM required (6.1.1) was steady at $65.4 billion – up 4.0 percent QoQ, nearly at the $65.5 billion level at the end of Q4 2024. This suggests a pause on buy-side repo clearing expansion, after the SEC-announced one-year delay in the UST repo go-live to 30 June 2027.
- DTCC MBSCC (providing mortgage-backed securities clearing) disclosed kccp (4.2.1) at 88 after being 17 for the prior quarter, still shy of 93 in Q3 2024.
- DTCC NSCC (providing equities and corporate bond clearing) reported total IM required of a record $19.7 billion – up 60 percent QoQ, and 92 percent YoY, exceeding the prior record of $13.7 billion set in Q2 2022.
- Eurex 6.1.1 total IM had some large percentage moves for services not mentioned before in this blog: their fixed income service showed €5,788 million – up 20 percent QoQ, their precious metals service was €208 million – up 247 percent QoQ, and their “remaining products” showed €12.1 billion – up 28 percent QoQ.
- Eurex OTC IRS clearing excesses of marked-to-market exposure above margin coverage (6.5.1.1) further increased to 484 – up QoQ from 415, and up YoY from 58.
- Eurex group maximum VM (6.7.1) received on any business day settled back down to €9,703 million from €15,066 million the prior quarter.
- HKEX SEOCH (providing options clearing) 16.2.17 estimate of risk on investment portfolio rose to 1.866 million (presumably 99% one-day VAR) – up QoQ from 0.434 million. Also, total IM required (6.1.1) was USD 3.18 billion – up 9.7 percent QoQ and 172 percent YoY.
- JSCC JGB 6.1.1 total IM required jumped to $22.1 billion – up 25 percent QoQ, and up 41 percent YoY.
- LCH SwapClear’s 19.1.2 “number of direct members that clear for clients” was 69 – higher than the previous peak of 64, last seen in Q4 2021.
- LCH ForexClear 6.1.1 total IM required rose to £11.6 billion – its highest ever level exceeding the £10.7 billion in Q4 2024.
- LCH CDSClear SA’s 19.1.3.1 “percentage of client transactions attributable to the top 5 clearing members – Peak” was 100 percent up from 76 percent while the “- Average” remained close to 50 percent. The CDSClear 6.8.1 maximum aggregate IM call on any business day was €1,228 million – up 80 percent QoQ, and up 280 percent YoY.
- OCC’s mean over 12 months largest aggregate stress loss (4.4.3) was $6,932 million – up 5.2 percent QoQ and 67 percent YoY, while their maximum aggregate IM call on any day in the period (6.8.1) was $25,169 million – up 88 percent QoQ and 666 percent YoY.
- OCC’s USD options average daily volumes (23.3.1) was 57.2 million contracts – down 2.2 percent QoQ, but up 24 percent YoY.
There are a lot more disclosures for non-major clearinghouses, but we will stop there for today and leave those of you with CCPView access to analyze further.
End note
Flip back to the start of the blog to recap the takeaways.
CCPView has disclosures from 44 clearinghouses, each with many Clearing Services covering equities, bonds, futures, options, and OTC derivatives – with over 200 quantitative data fields with supporting notes each quarter covering Q3 2015 to Q2 2025. CCPView can be used to select a subset of CCPs and disclosures, chart the quantitative disclosures over several quarters, and highlight QoQ changes above a percentage which you can configure. In addition to a Web UI, we offer an API to access this data programmatically.
If you are interested in using CCPView, get in touch.