Clarus CCPView has daily volume and open interest data published by each CCP, which is filtered, normalized, and aggregated to allow meaningful volume comparisons.
Today, we look at 2025Q1 CCP volumes and market share in IRD for:
- USD Swaps (FF, SOFR)
- EUR Swaps (Euribor, EONIA, €STR)
- GBP Swaps (SONIA)
- JPY Swaps (IBOR, TONA)
- AUD Swaps (BBSW, AONIA)
- CAD Swaps (CDOR, CORRA)
- EMEA Swaps (OIS, IRS)
- AsiaPac Swaps (OIS, IRS)
- LatAm Swaps (all types)
Onto the charts, data, and details.
Volumes and market share
For major currencies and regions, vanilla swaps referencing IBORs and OIS Swaps referencing RFRs, using single-sided gross notional volume over a month, a quarter, or a year.
USD OIS (FF, SOFR)
Swaps referencing either Fed Funds or SOFR indices.
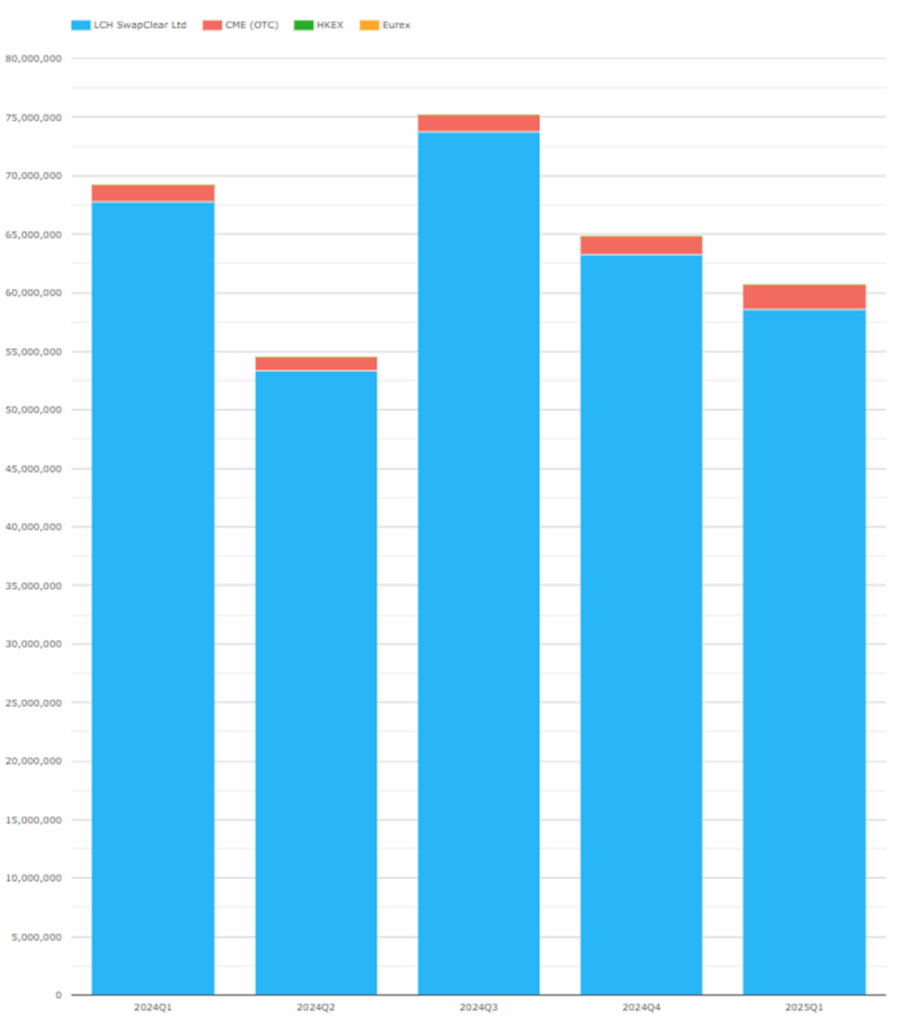
Chart 1: USD OIS single-sided gross notional in USD millions.
- The 2025Q1 total of $60.7 trillion is down 12 percent, compared to $69.2 trillion in 2024Q1.
- LCH SwapClear: $58.6 trillion in 2025Q1, down from $67.8 trillion in 2024Q1.
- CME OTC: $2.13 trillion in 2025Q1, down from $1.45 trillion in 2024Q1.
- 2025Q1 Share is LCH 96.5 percent and CME 3.5 percent, compared to 97.9 percent and 2.1 percent in 2024Q1.
Overall, 2025Q1 is down from the 2024Q3 all-time high of $75 trillion.
EUR Swaps (Euribor)
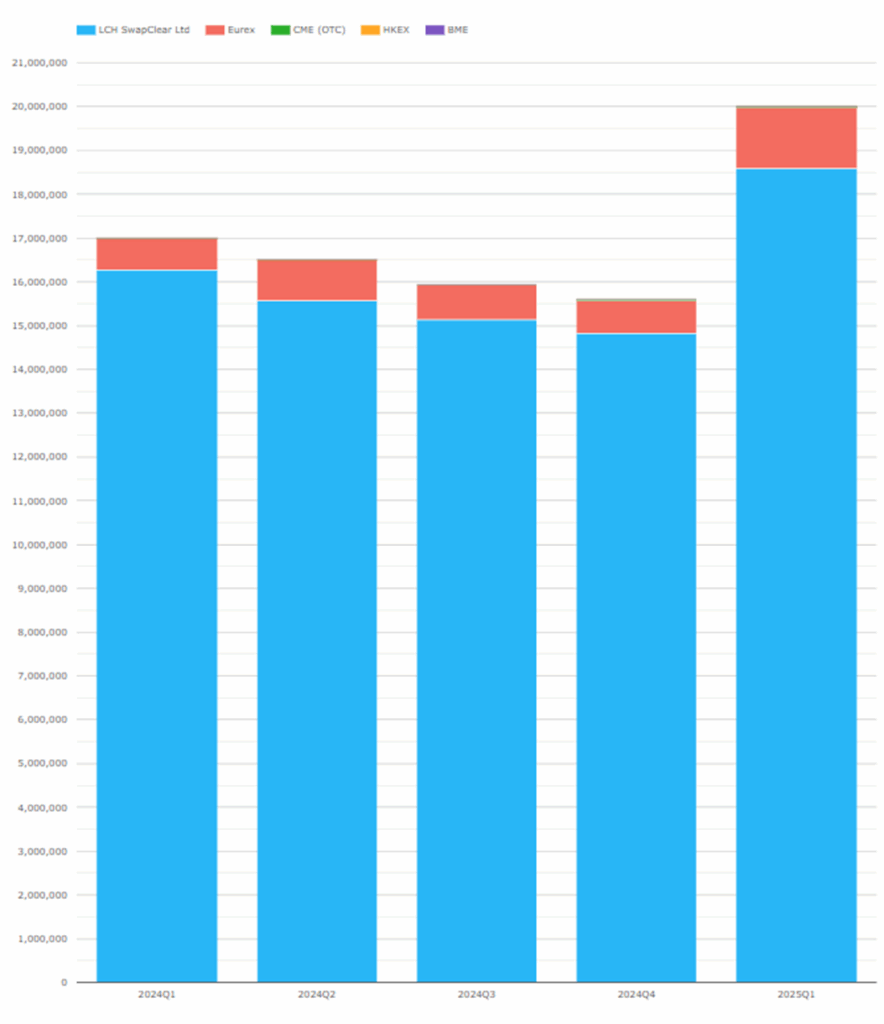
Chart 2: EUR IRS single-sided gross notional in EUR millions.
- 2025Q1, at €20 trillion, is up 18 percent compared to €17 trillion in 2024Q1.
- LCH SwapClear: €18.6 trillion in 2025Q1 up from €16.3 trillion in 2024Q1.
- Eurex: €1.39 trillion in 2025Q1 up from €0.73 trillion in 2024Q1.
- 2025Q1 market share shows LCH at 92.9 percent and Eurex at 6.9 percent (2024Q1 share was LCH 95.4 percent and Eurex 4.5 percent).
2025Q1 is the highest volume on record, with 2024Q1 the prior high.
EUR OIS (EONIA, €STR)
Referencing either EONIA or €STR, though in recent quarters all will be €STR.
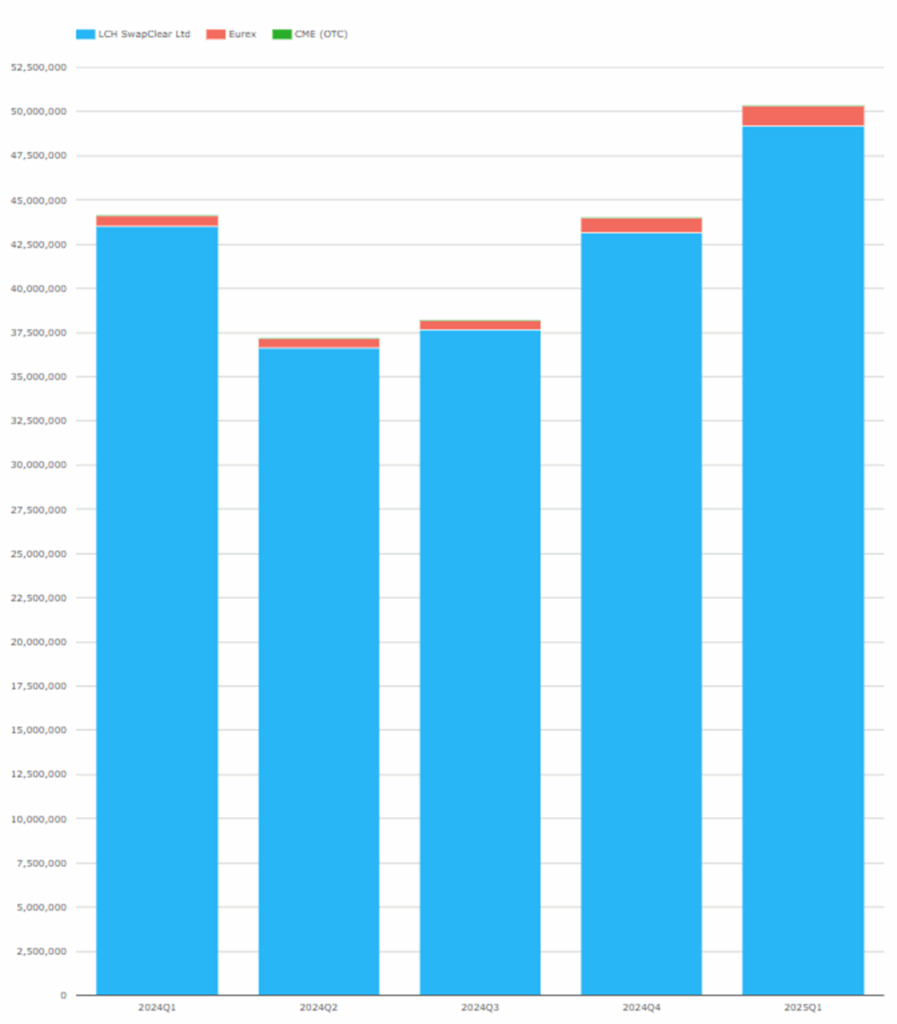
Chart 3: EUR OIS single-sided gross notional in EUR millions.
- 2025Q1, at €50.3 trillion, is up 14 percent compared to €44.1 trillion in 2024Q1.
- LCH SwapClear: €49.2 trillion in 2025Q1, up from€43.5 trillion in 2024Q1.
- Eurex: €1.1 trillion in 2025Q1, up from €0.64 trillion in 2024Q1.
- 2025Q1 market share shows LCH 97.8 percent and Eurex 2.2 percent.
2025Q1 is again the highest volume on record, with 2024Q1 the prior high.
The combined EUR IRS and OIS volume of €70.3 trillion in 2025Q1, at an FX rate of 1.095, is equivalent to $77 trillion, exceeding the USD OIS volume of $60 trillion.
GBP Swaps (SONIA)
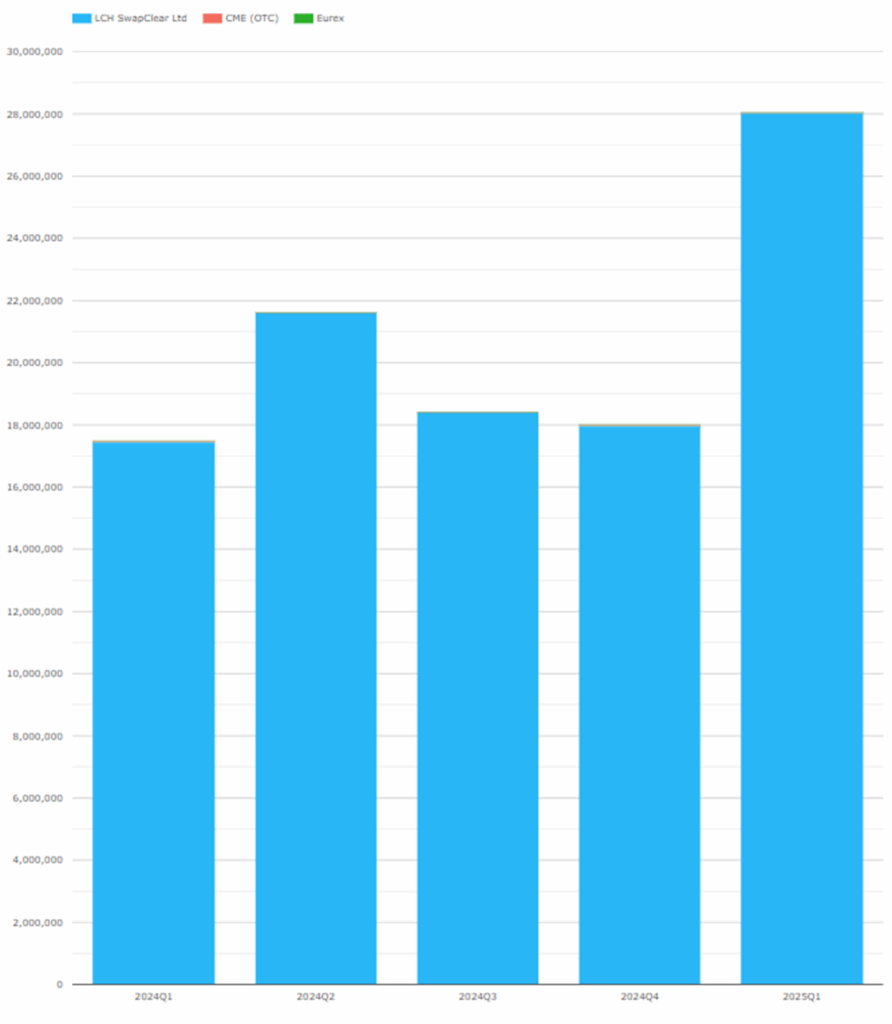
Chart 4: GBP OIS single-sided gross notional in GBP millions.
- The 2025Q1 total of £28.1 trillion is up 60 percent compared to £17.5 trillion in Q12024.
- LCH SwapClear had a 99.98 percent share.
2025Q1 volume is a new record, beating the prior high of £21.6 trillion in 2024Q2.
JPY OIS (TONA)
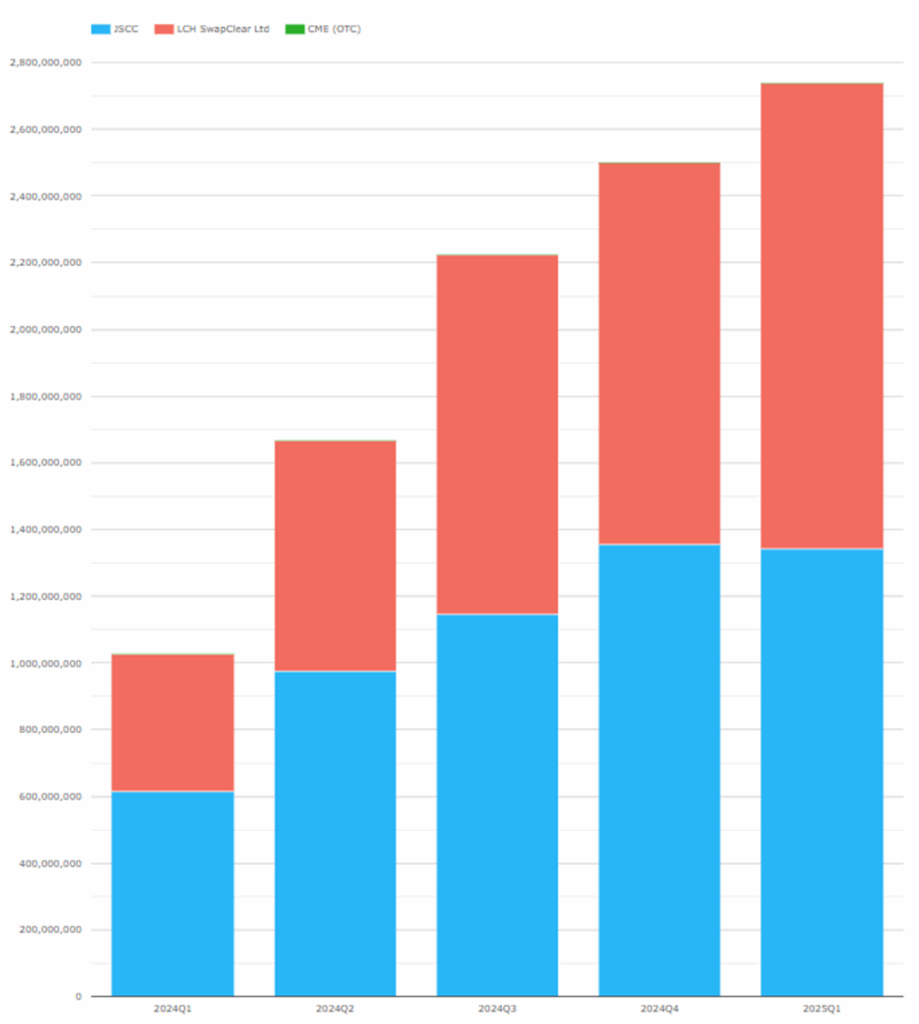
Chart 5: JPY OIS single-sided gross notional in JPY millions.
- The 2025Q1 total of ¥2,738 trillion is up 166 percent compared to ¥1,028 trillion in 2024Q1.
- JSCC: ¥1,343 trillion in 2025Q1, compared to ¥616 trillion in 2024Q1.
- LCH SwapClear: ¥1,394 trillion in 2025Q1, compared to ¥411 trillion in 2024Q1.
- 2025Q1 market share shows LCH at 50.9 percent and JSCC 49.1 at percent, compared to 40.1 percent and 59.9 percent respectively in 2024Q1.
2025Q1 volumes are a record high, exceeding the prior high in 2024Q4.
At an FX rate of 147, the ¥2,738 trillion is equivalent to $18.6 trillion.
AUD Swaps (BBSW, AONIA)
Referencing either AONIA or BBSW, so both OIS and IRS.
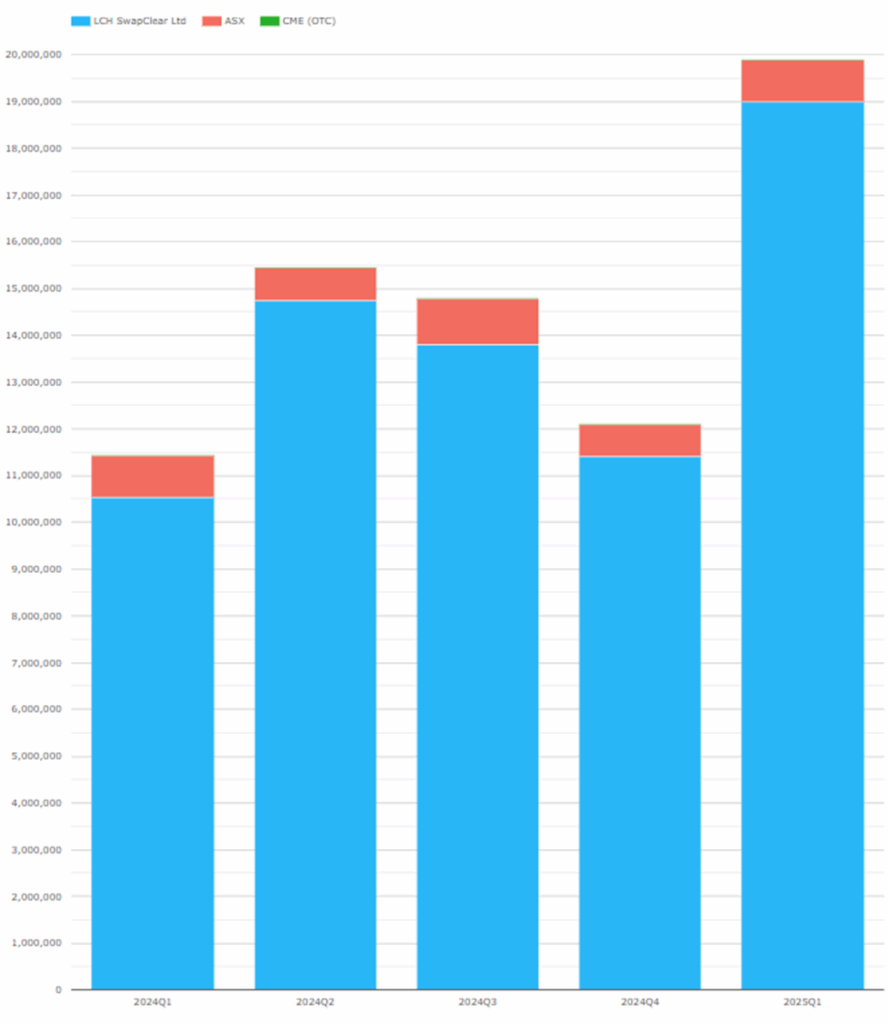
Chart 6: AUD IRS and OIS single-sided gross notional in AUD millions.
- The 2025 total of A$19.9 trillion is up 74 percent compared to A$11.4 trillion in Q12024.
- LCH SwapClear: A$19.0 trillion in 2025Q1, up from A$10.5 trillion in 2024Q1.
- ASX: A$0.91 trillion in Q12025, a marginal increase on A$0.89 trillion in 2024Q1.
- 2025Q1 market share shows LCH at 95.4 percent and ASX at 4.6 percent, compared to 92.2 percent and 7.8 percent respectively in 2024Q1.
CAD Swaps (CDOR, CORRA)
Referencing either CORRA or CDOR, so both OIS and IRS.
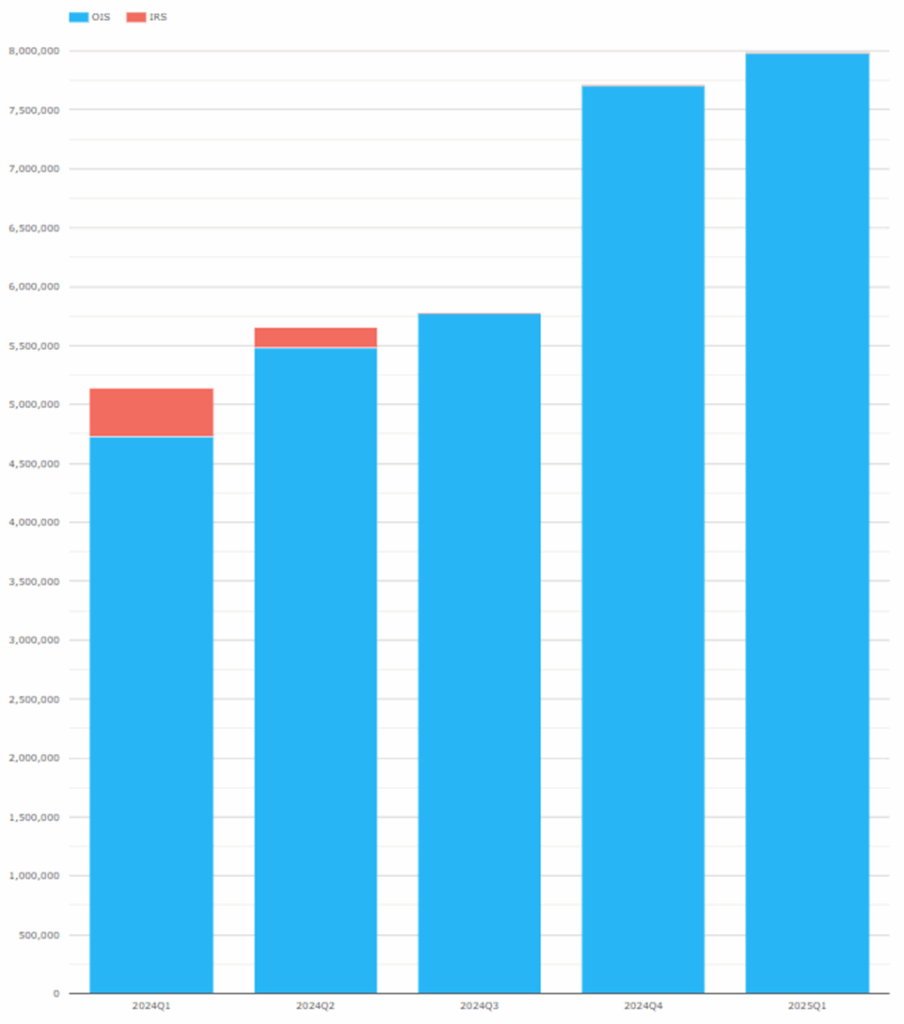
Chart 7: CAD IRS and OIS single-sided gross notional in CAD millions.
- The 2025Q1 total of C$8.0 trillion up from C$5.1 trillion in 2024Q1 – a new record high exceeding the C$7.7 trillion total in 2024Q4.
- IRS was down to zero volume in the last two quarters after the completion of the move to CORRA.
- LCH SwapClear had 99.9 percent of the volume.
EMEA Swaps (OIS, IRS)
Now let us switch to EMEA Swaps (OIS and IRS) volumes by currency.
Chart 8: EMEA Swaps single-sided gross notional in USD millions.
- The 2025Q1 total of $6.4 trillion is up 26 percent from $5.1 trillion in 2024Q1.
- ZAR was the largest in 2025Q1 at $2.22 trillion, up from $1.76 trillion in 2024Q1.
- CHF was next largest at $1.43 trillion, up from $1.16 trillion.
- SEK had $752 billion, up from $565 billion.
- NOK had $652 billion, up from $369 billion.
- PLN had $477 billion, up from $436 trillion.
- CZK had $360 billion, down $420 billion.
- ILS had $309 billion, up from $196 billion.
- HUF had $181 billion, up from $158 billion.
- DKK had $58 billion, up from $47 billion.
Volumes were up in all currencies from a year earlier, except for CZK.
Not shown in the chart is 2025Q1 market share by CCP, where LCH had more than 99.5 percent in every currency except for:
- CZK, LCH at 98.6 percent, and CME at 1.4 percent.
- PLN, LCH at 97.8 percent, KDPW at 1.2 percent, and CME at 1.0 percent.
- HUF, LCH at 98.9 percent, and CME at 1.1 percent.
AsiaPac Swaps (OIS, IRS)
Now let us switch to AsiaPac Swaps (OIS, IRS) and volumes by currency.
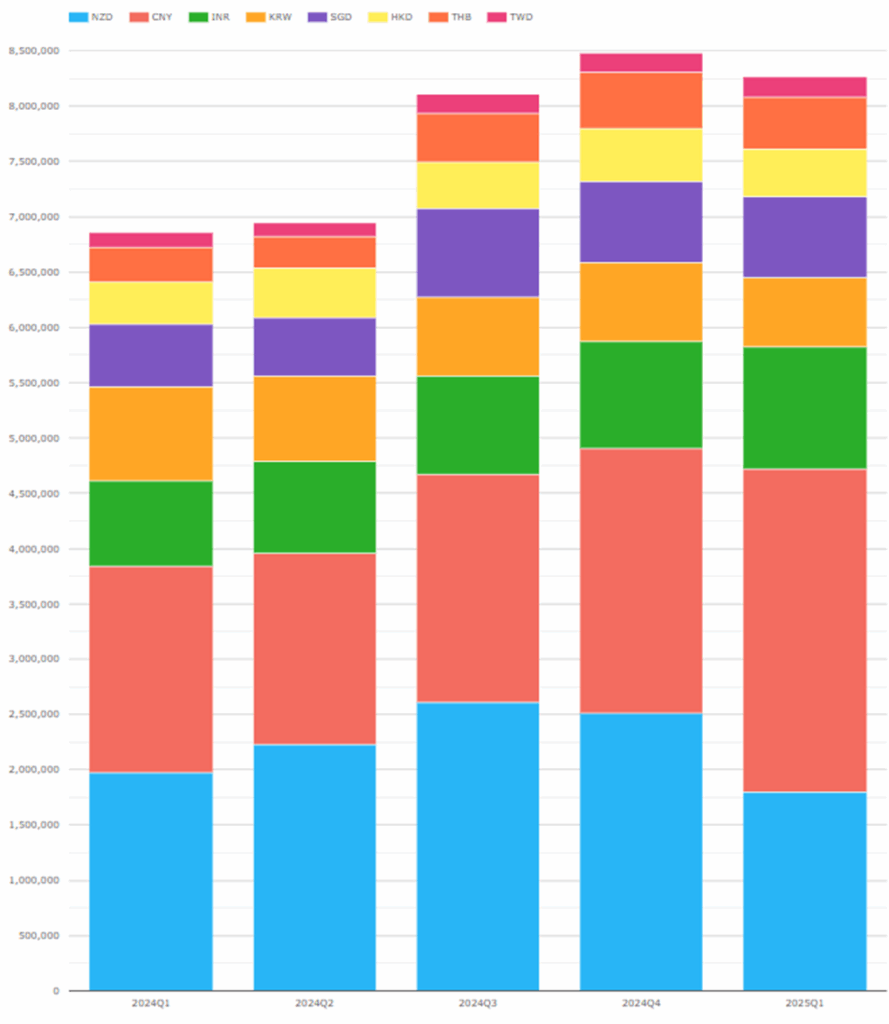
Chart 9: APAC Swaps single-sided gross notional in USD millions.
- The 2025Q1 total of $8.3 trillion is up 20 percent from $6.9 trillion in 2024Q1.
- CNY was the largest at $2.9 trillion in 2025Q1, up 57 percent from $1.9 trillion in 2024Q1.
- NZD came next at $1.8 trillion, down from $2.0 trillion.
- INR had $1,106 billion, up from $774 billion.
- KRW had $630 billion, down from $850 billion.
- SGD had $726 billion, up from $567 billion.
- HKD had $439 billion, down from $381 billion.
- THB had $465 billion, up from $314 billion.
- TWD had $181 billion, down from $140 billion.
So, some ups and downs by currency with CNY the standout increase.
Not shown in the chart is market share by CCP, where LCH has 100.0 percent share for 2024Q1 in every currency except for:
- CNY, Shanghai at 60.4 percent, and LCH with 39.6 percent.
- INR, LCH at 67.2 percent, and CCIL with 32.8 percent.
- HKD, LCH at 99.7 percent, with HKEX 0.3 percent.
LatAm Swaps (all types)
Next, let us look at LatAm Swaps (all types).
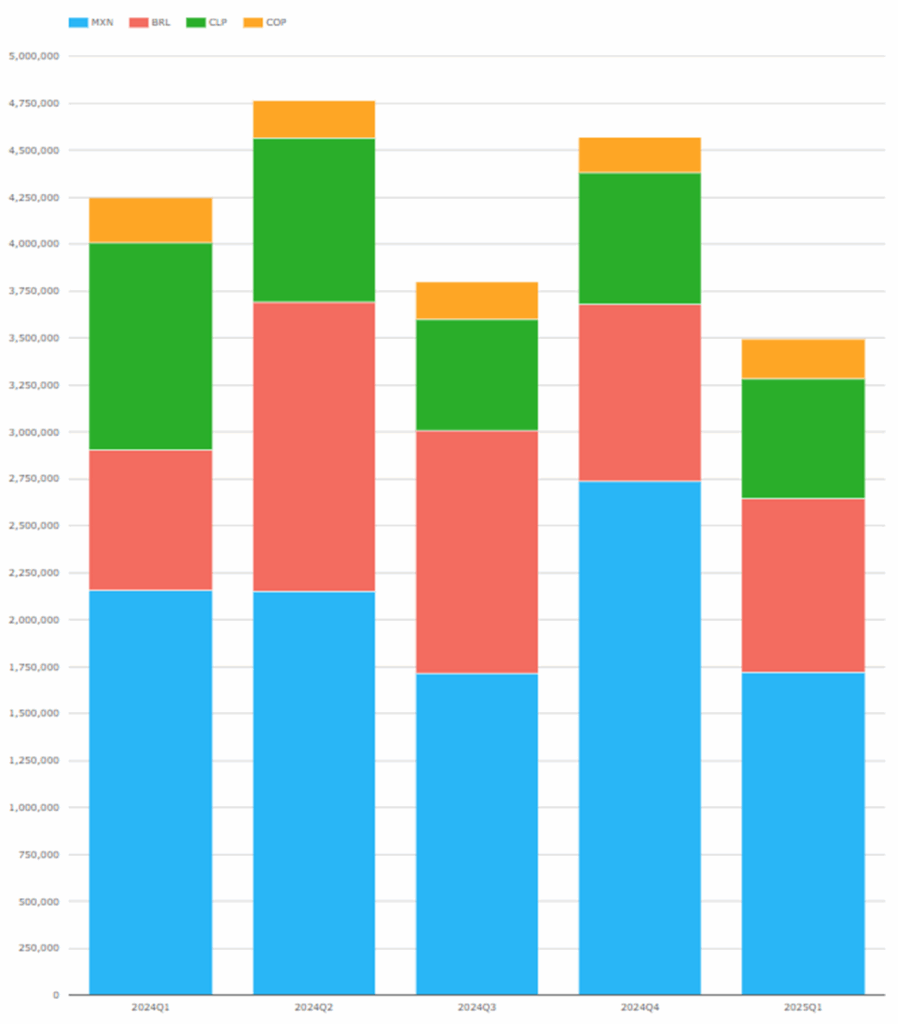
Chart 10: LatAm Swaps single-sided gross notional in USD millions.
- The 2025Q1 total, at $3.5 trillion, is down 18 percent from $4.2 trillion in 2024Q1.
- MXN was the largest in 2025Q1 with $1.7 trillion, down 20 percent from $2.2 trillion in 2024Q1.
- BRL came next with $921 billion, up 24 percent from $745 billion.
- CLP had $639 billion, down 42 percent from $1,105 billion.
- COP had $216 billion, down from $243 billion.
All decreased apart from BRL.
Not shown in the chart is market share by CCP, where CME has more than 95 percent for 2024Q1 except for:
- MXN, CME at 88.1 percent, Asigna/Mexder at 9.1 percent, and LCH at 2.8 percent.
Also not shown in the chart is the fact that BRL and CLP are dominated by zero coupon swaps, unlike most currencies which are dominated by either OIS or IRS, or both.
That’s it
10 Charts for an overview.
Still a lot more data to look at
Volume in DV01 terms and Open Interest by currency.
IR Futures in all the major currencies and US Treasury volumes.
For more details, please contact us for a CCPView demonstration.