2024 volumes and market share for OTC Derivatives in Interest Rates reported by Clearing Houses.
Clarus CCPView has daily volume and open interest data published by each CCP, which is filtered, normalised and aggregated to allow meaningful comparisons.
Contents:
- USD Swaps
- EUR Swaps (EURIBOR, EONIA, €STR)
- GBP Swaps (SONIA)
- JPY Swaps (IBOR, TONA)
- AUD Swaps (BBSW, AONIA)
- CAD Swaps (CDOR, CORRA)
- EMEA Swaps
- AsiaPac Swaps
- LatAm Swaps
- LatAm Swaps
Onto the charts, data, and details.
Volumes and Market Share
For major currencies and regions, vanilla swaps referencing IBORs and OIS Swaps referencing RFRs.
We use single-side gross notional and cleared volume over the year.
All charts are created in CCPView and exported.
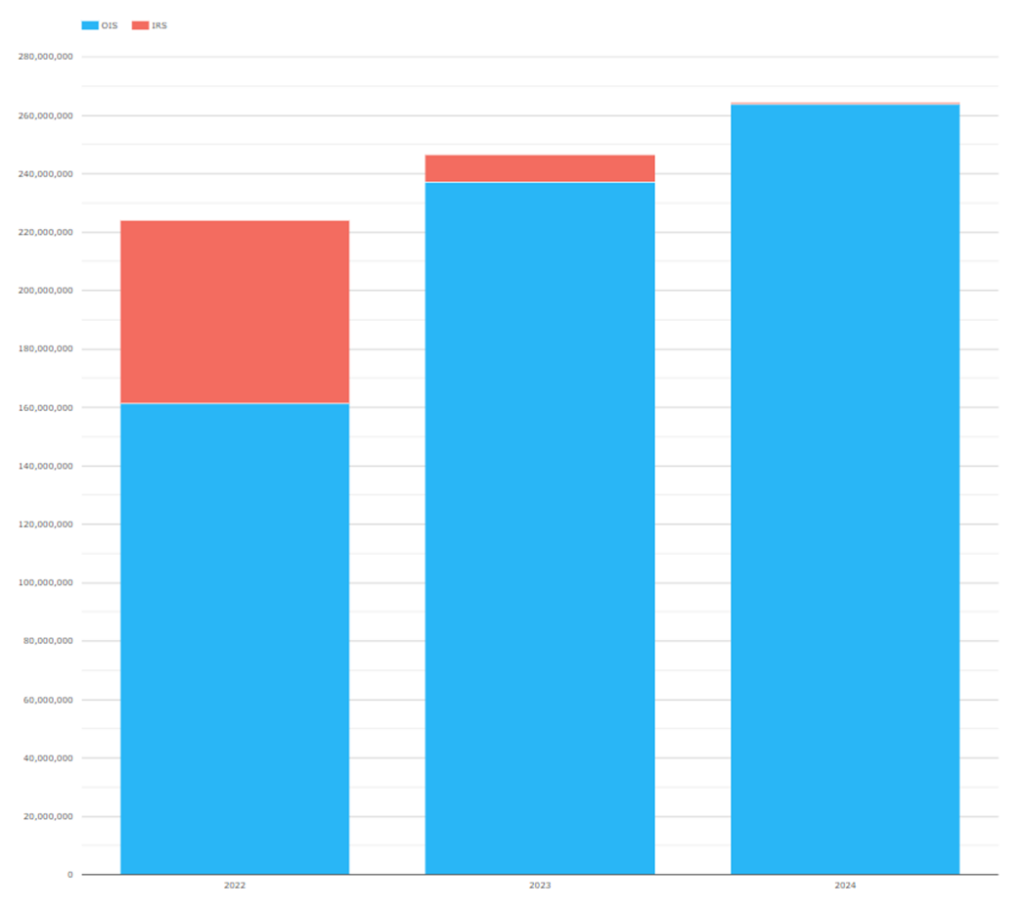
USD Swaps volume, single sided gross notional in USD millions
- IRS (Libor) volume down to $0.48 trillion, from $9.3 trillion and $62 trillion in prior years
- Showing clearly the end of Libor, with zero volume from August 2024 onwards
- OIS (FF and SOFR) volume up to $263 trillion from $237 trillion and $161 trillion in prior years
- An increase of $26.5 trillion or 11% in 2024
Switching to Open Interest (Outstanding notional):
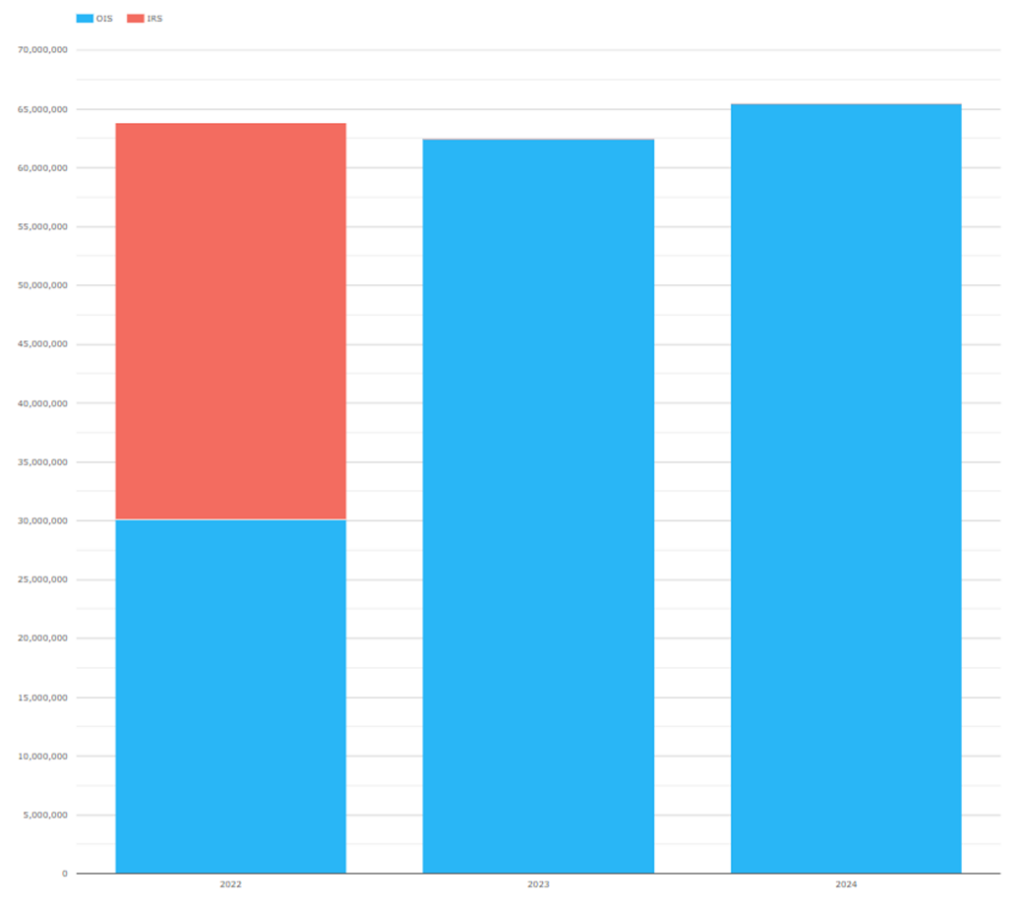
USD Swaps Open Interest – single sided gross notional in USD millions
- IRS (Libor) OI at a negligible $2.2 billion on 31Dec2024, from $2.8 billion and $30 trillion at prior year ends
- OIS (FF, SOFR) OI is $65 trillion on 31Dec2024, from $62 trillion and from $30 trillion at prior year ends
- Further confirming the end of Libor Swaps trading
Turning next to USD OIS market share:
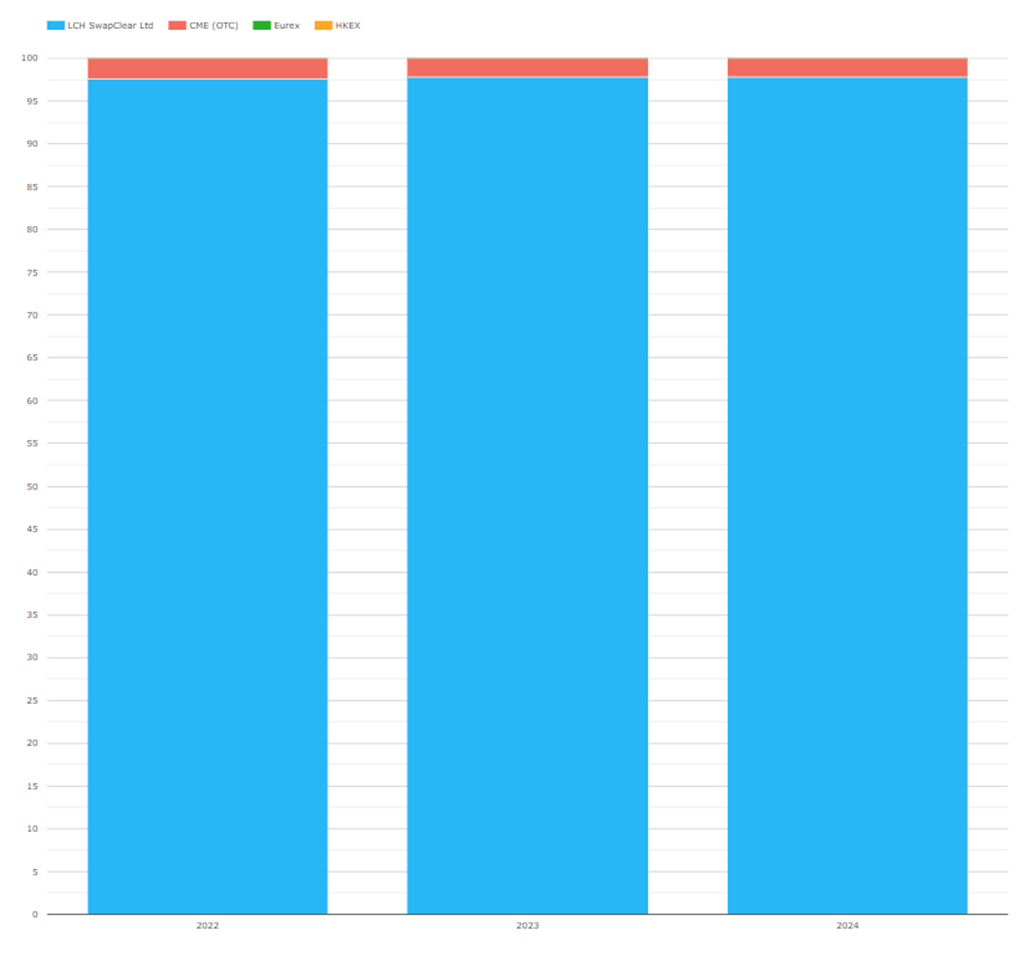
USD OIS volume market share
- LCH SwapClear with 97.85% in 2024, compared with 97.74% and 97.51% in the prior two years
- CME OTC with 2.14% in 2024, compared with 2.26% and 2.48% in the prior two years
- CME’s share of client volume was 2.66% in 2024, compared to 2.94% and 3.46% in the prior two years
In summary, OIS has been fully adopted, while cleared LIBOR is gone and CME’s small market share is slowly eroding.
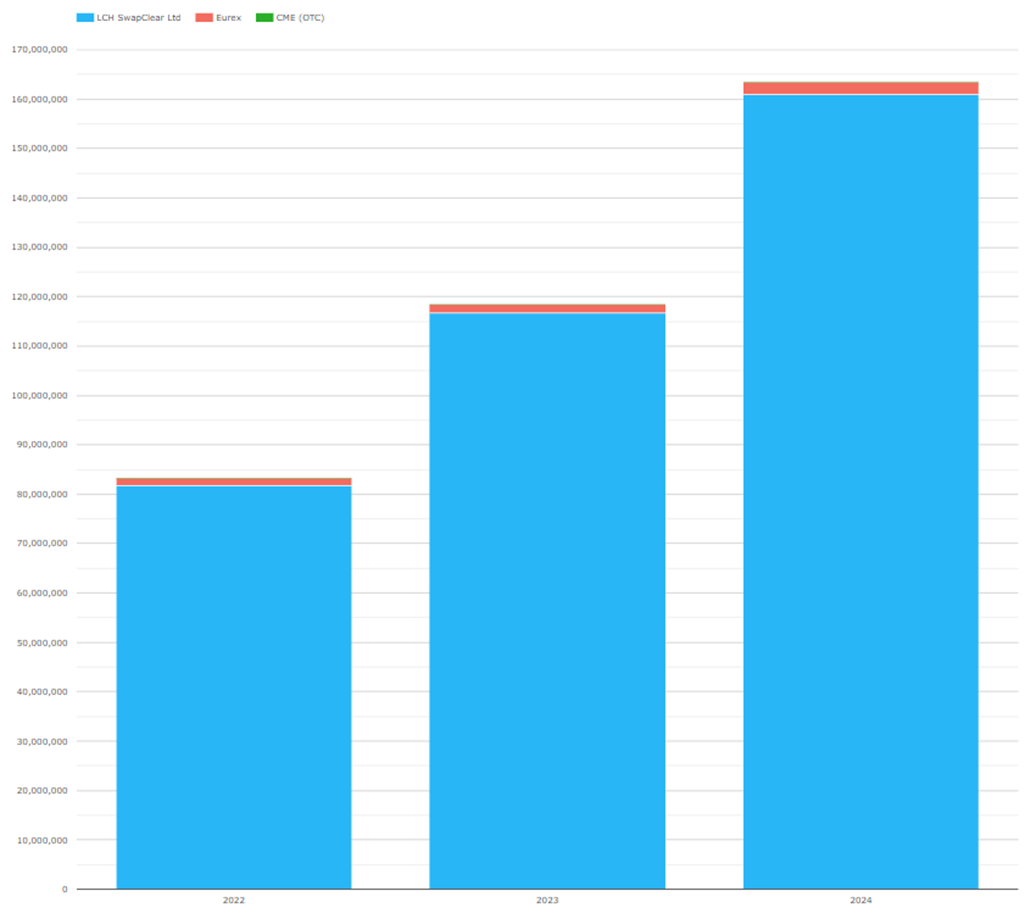
EUR Swaps (EURIBOR)
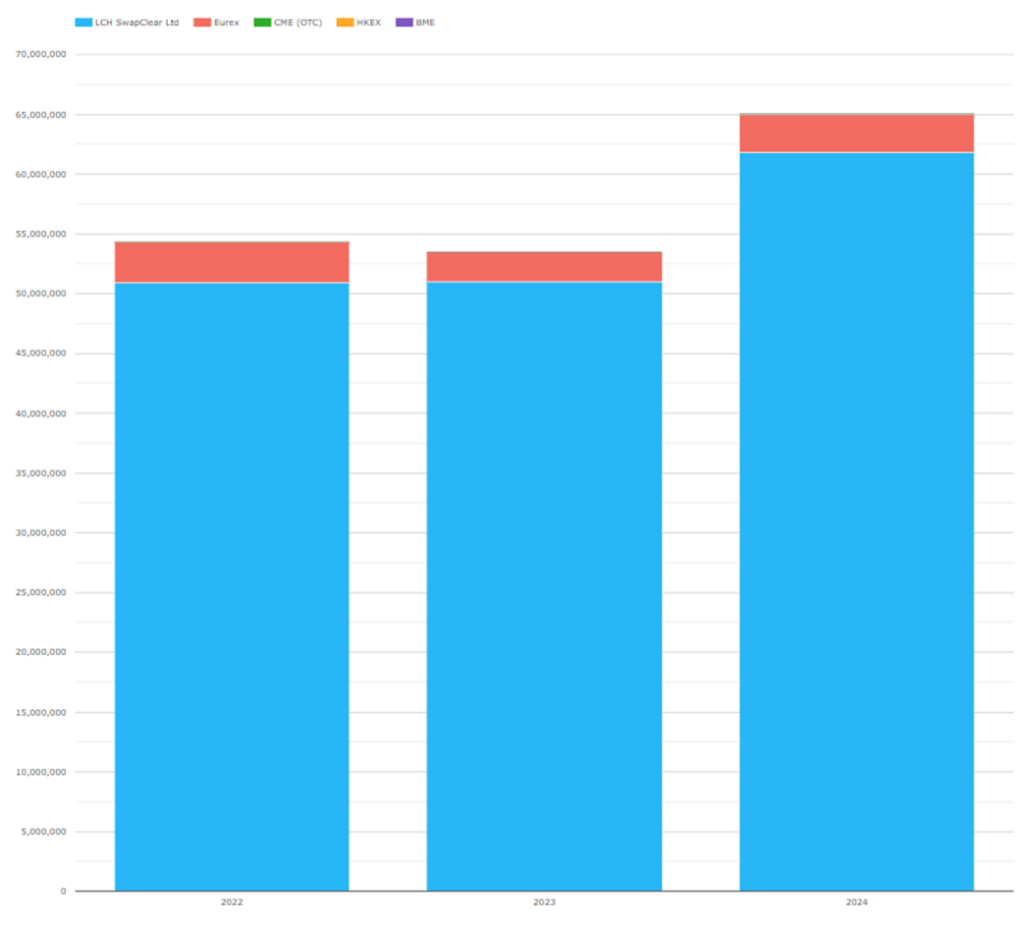
EUR IRS (Euribor) volume, single-sided gross notional in EUR millions
- 2024 with €65 trillion, up from €53.5 trillion in 2023 and €54.3 trillion in 2022
- LCH SwapClear with €61.8 trillion in 2024 and €51 trillion in 2023
- Eurex with €3.2 trillion in 2024 and €2.47 trillion in 2023
- CME with €0.052 trillion in 2024 and €0.010 in 2023
Market share is steady despite material activity increases:
- LCH SwapClear with 95.0% in 2024, 95.4% in 2023 and 93.8% in 2022
- Eurex with 4.9% in 2024, 4.6% in 2023 and 6.2% in 2022
- CME with 0.1% or more precisely 0.08% in 2024 and below 0.02% in the prior 2 years
EUR OIS (EONIA, €STR)
EUR OIS volume, single-sided gross notional in EUR millions
- 2024 with €163.5 trillion, up from €118.5 trillion in 2023 and from €83.3 trillion in 2022
- An increase of €45 trillion or 38% in 2023
- LCH SwapClear with €160.9 trillion in 2024 and €116.6 trillion in 2023
- Eurex with €2.6 trillion in 2024 and €1.9 trillion in 2023
Again, market share is steady despite material activity increases:
- LCH SwapClear with 98.41% in 2024, 98.39% in 2023 and 98.19% in 2022
- Eurex with 1.59% in 2024, 1.61% in 2023 and 1.81% in 2022
GBP Swaps (SONIA)
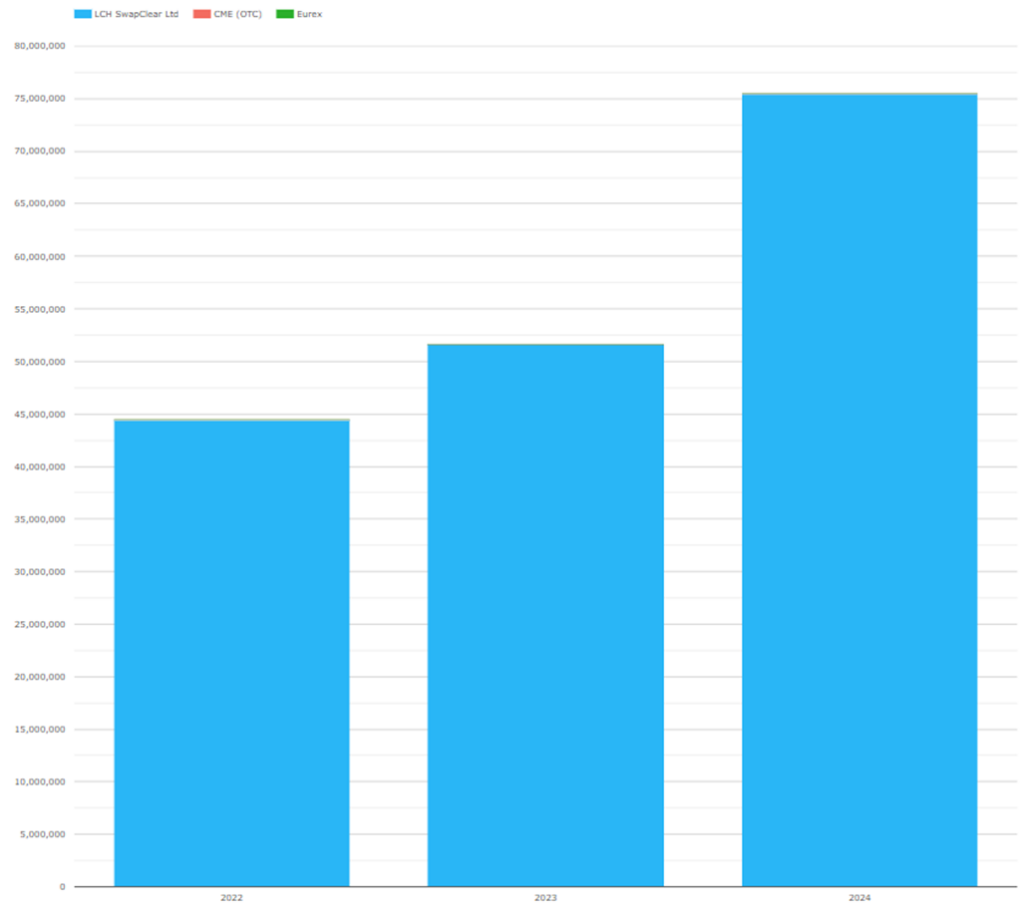
GBP Swaps volume, single sided gross notional in GBP millions
- IRS (Libor) remaining at negligible but non-zero volumes
- OIS (SONIA) volume is £75.5 trillion in 2024 – a new all-time, year-end high which bests both 2023’s £51.6 trillion and the combined LIBOR/SONIA record of £56.2 trillion in 2020
- LCH SwapClear with 99.9% market share
Open Interest (Outstanding notional) in SONIA Swaps on 31Dec2024 at £15.3 trillion up a healthy 21% from £12.6 trillion at 2023 year-end – also a new, all-time year-end high.
JPY Swaps (IBOR, TONA)
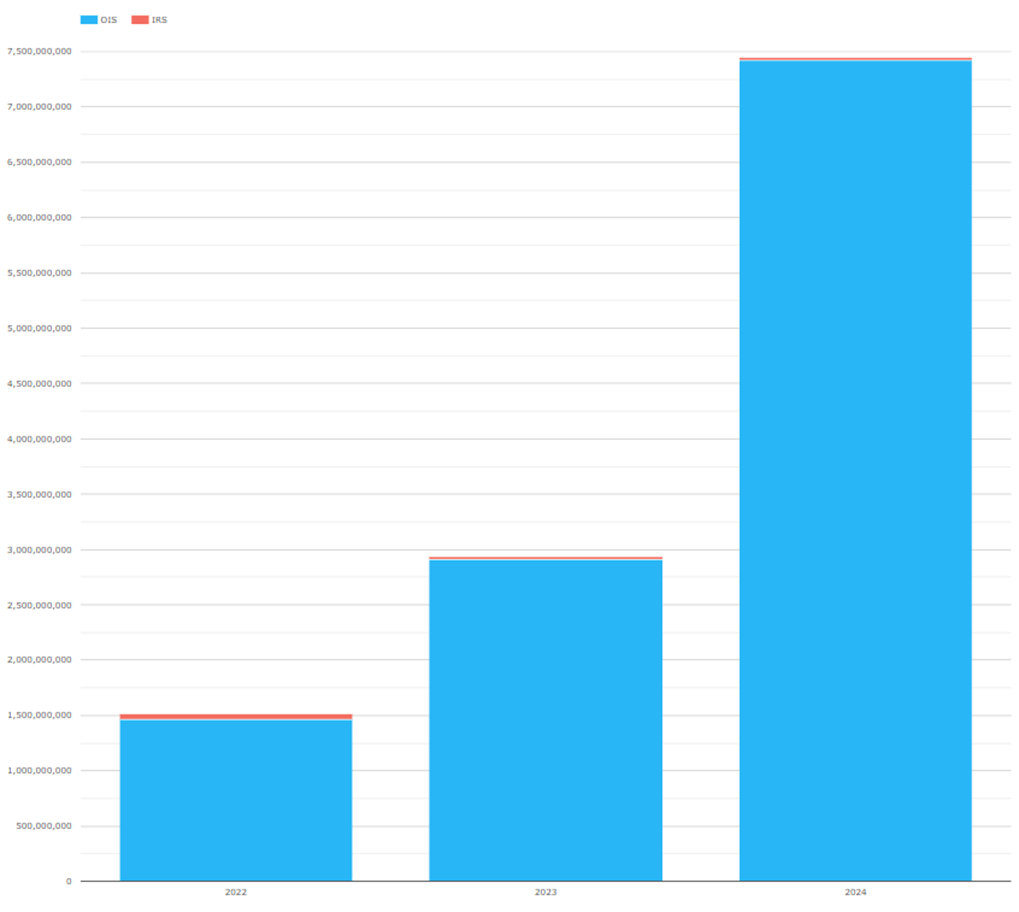
JPY Swaps volume, single sided gross notional in JPY millions
- IRS (IBOR) down to Y24.4 trillion in 2024 from Y28.0 trillion in 2023
- OIS (TONA) up to Y7,420 trillion from Y2,905 trillion the year before – a 155% increase likely driven by BOJ moving rates positive in 2024 for the first time in 17 years
Turning next to JPY OIS market share:
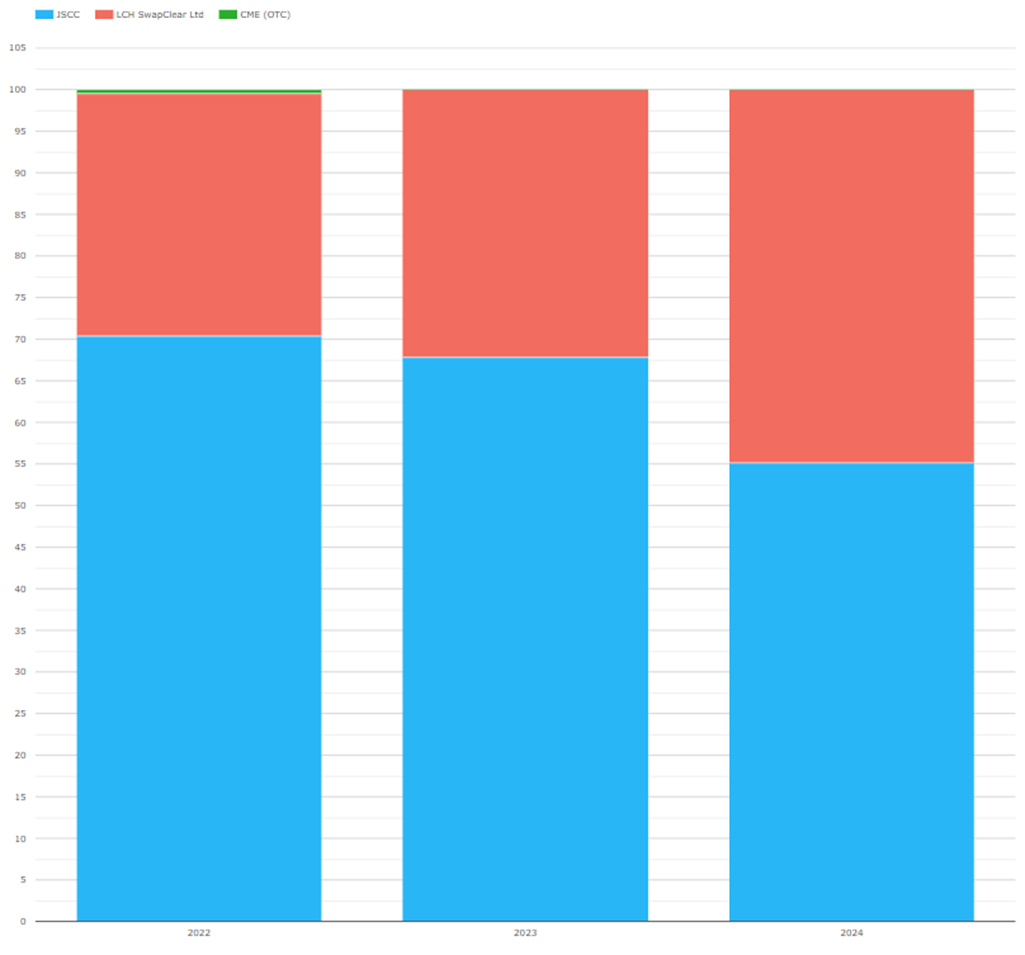
JPY OIS volume market share
- JSCC with 55.2% in 2024, 67.8% in 2023 and 70.4% in 2022
- LCH SwapClear with 44.8% in 2024, 32.2% in 2023 and 29.2% in 2022
- CME below 0.1% in 2024 and 2023 from 0.5% in 2022
LCH took a noticeably bigger share of much bigger 2024 total volume – likely because the uptick in activity in response to BOJ rate hikes focused mainly on shorter tenors.
AUD Swaps (BBSW, AONIA)
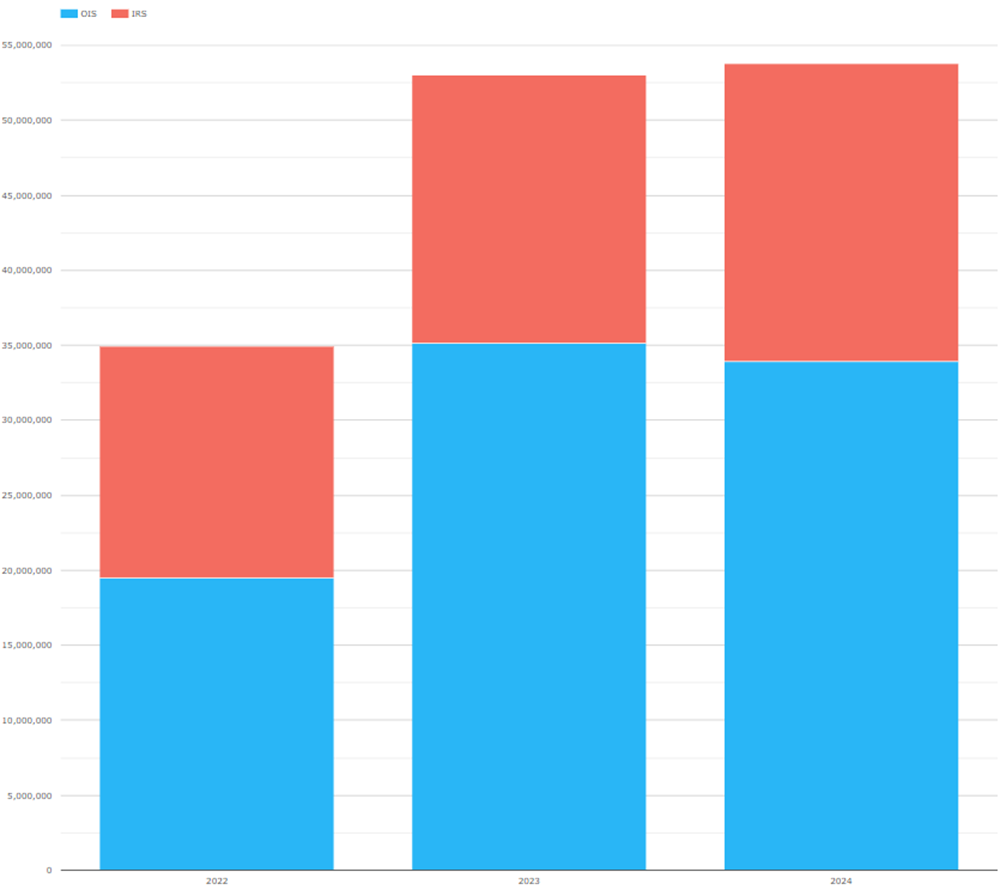
AUD Swaps volume, single sided gross notional in AUD millions
- OIS (AONIA) down to A$33.9 trillion from A$35.2 trillion a year earlier, a reduction of 3.5%
- IRS (BBSW) up to A$19.8 trillion in 2023 from A$17.8 trillion a year earlier, an increase of 11%
OIS volume is even a bit higher given we allocated all of ASX’s activity to IRS, as we do not have the breakdown between IRS & OIS. The magnitude of the OIS reduction and IRS increase would be reduced in magnitude if we had been able to allocate, say, 1-2 trillion of the IRS to OIS.
Next, market share:
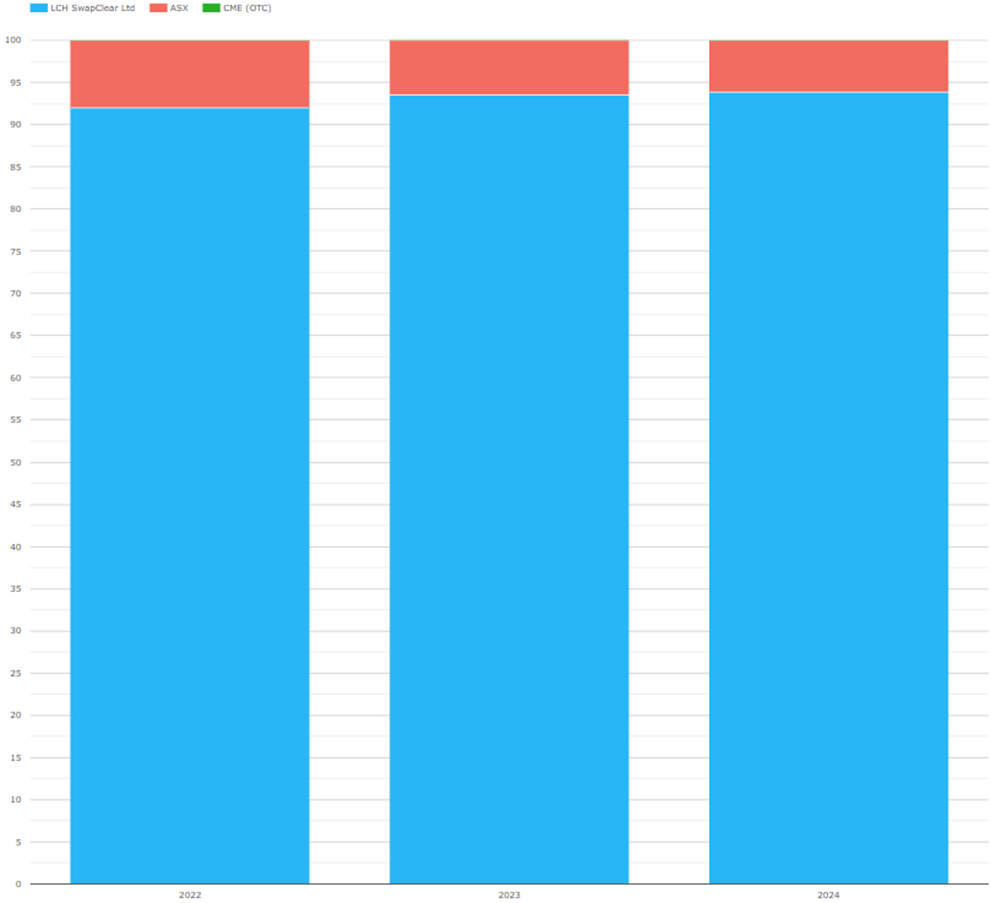
AUD Swaps volume market share
- 2024 share is LCH 93.9% and ASX 6.1%
- 2023 share was LCH 93.5% and ASX 6.5%
- 2022 share was LCH 92%, ASX 8%
LCH raising share a hair through its increased BBSW IRS volume.
CAD Swaps (CDOR, CORRA)
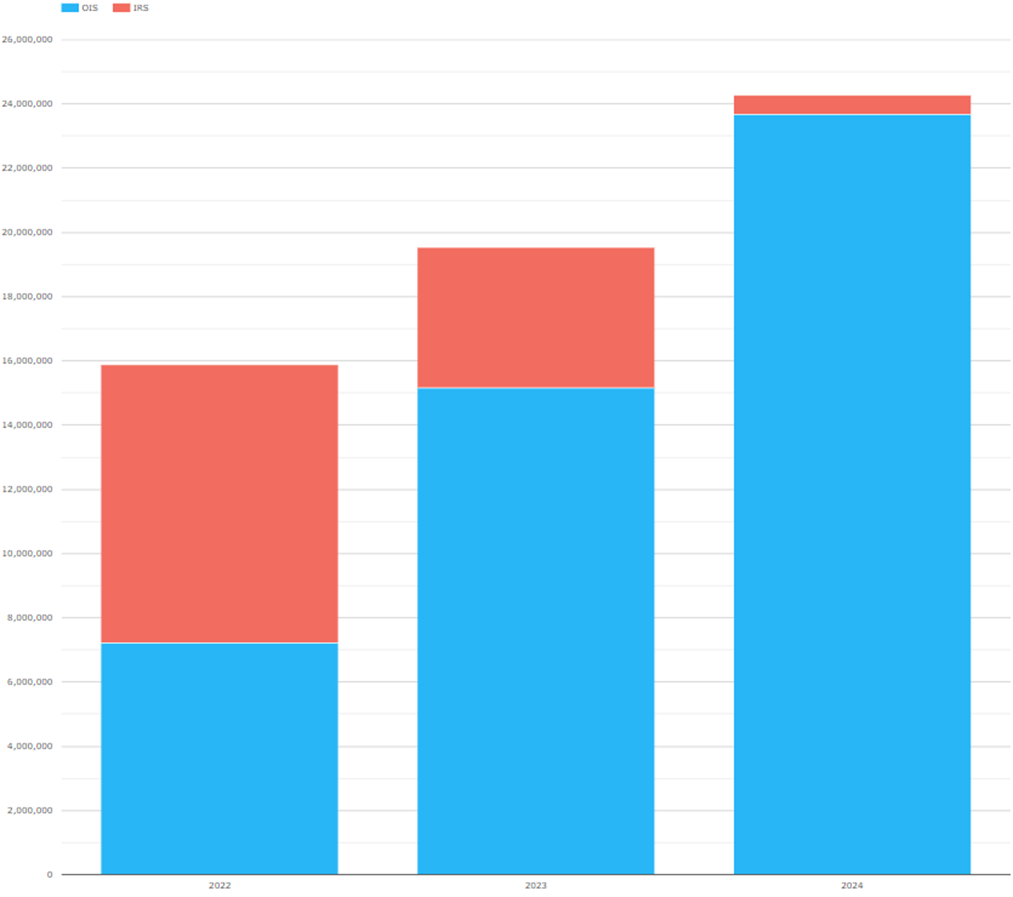
CAD Swaps volume, single sided gross notional in CAD millions
- IRS (CDOR) down to C$0.6 trillion in 2024 from C$4.4 trillion a year earlier
- OIS (CORRA) increasing to C$23.7 trillion in 2024 from C$15.2 trillion a year earlier
- CDOR cleared zero volume after July 2024 and will be zero for 2025 and beyond – a result of the CDOR-CORRA transition and LCH’s June 28 conversion.
- LCH SwapClear continuing at 99.9% of the volume
EMEA Swaps
Now let us switch to EMEA Swaps (all types) and volumes by currency.
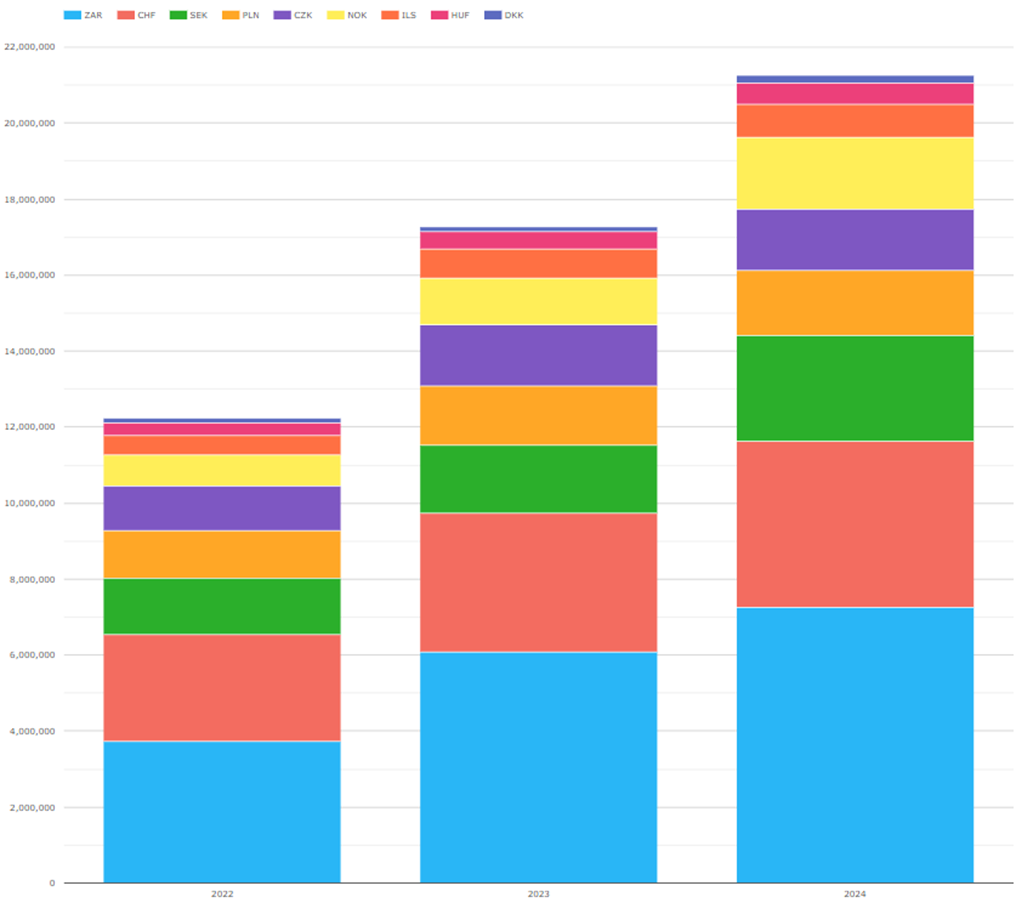
EMEA Swaps volume, single-sided gross notional in USD millions
- 2024 with $21.3 trillion, up from $17.3 trillion in 2023, an increase of 23%
- ZAR the largest currency with $7.25 trillion in 2024, up from $6.07 trillion in 2023, an increase of 19.4%
- CHF with $4.37 trillion, up from $3.66 trillion, an increase of 19.5%
- SEK with $2.79 trillion, up from $1.79 trillion, an increase of 56.1%
- CZK with $1.61 trillion, essentially flat from $1.62 trillion
- PLN with $1.70 trillion, up from $1.55 trillion
- NOK with $1.91 trillion, up from $1.22 trillion, an increase of 55.6%
- ILS with $857 billion, up from $774 billion
- HUF with $572 billion, up from $455 billion, an increase of 26%
- DKK with $255 billion, down from $121 billion, an increase of 70%
Not shown in the chart is that LCH SwapClear has 99.4% of the overall EMEA 2024 volume.
The only currencies where LCH has less than 99% share are:
- HUF, with LCH 97.1%, CME 2.9%
- PLN, with LCH 96.0%, CME 2%, KDPW 1.7%
AsiaPac Swaps
Now let us switch to AsiaPac Swaps (all types) and volumes by currency.
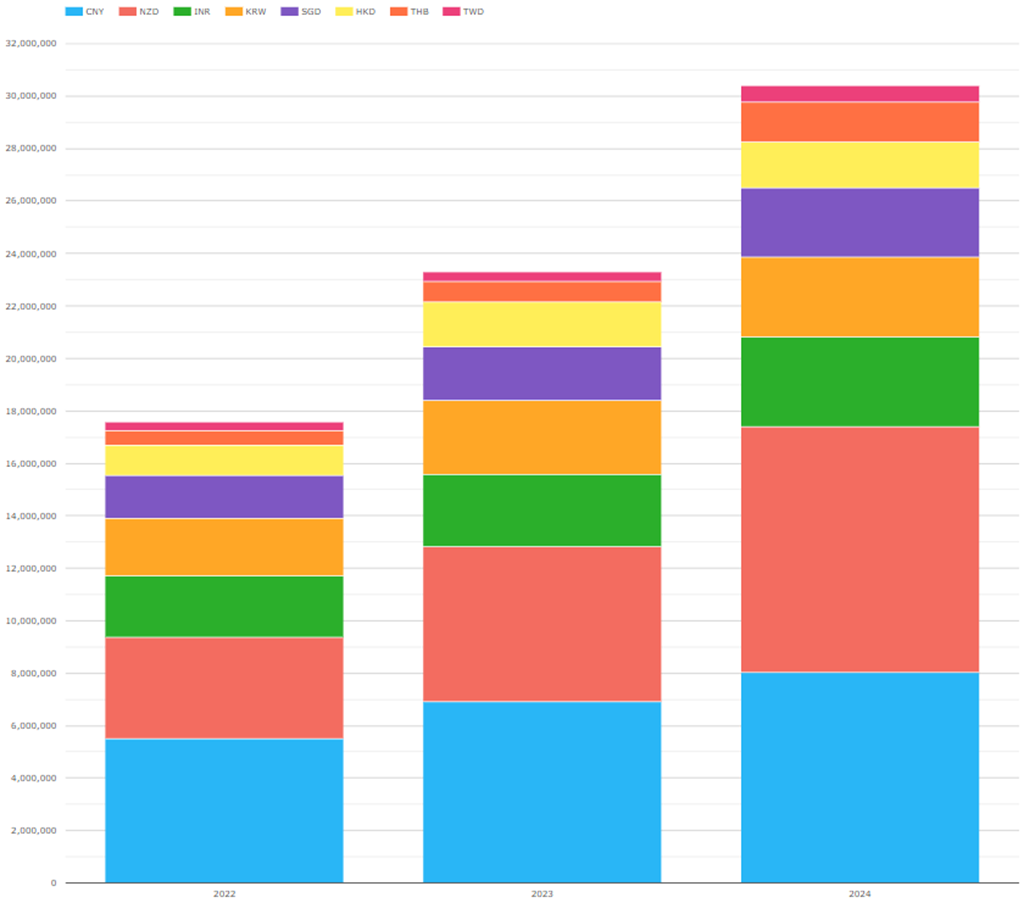
APAC Swaps volume, single-sided gross notional in USD millions
- 2023 with $30.4 trillion, up from $23.3 trillion, an increase of 31%
- CNY with $8.05 trillion, up from $6.91 trillion
- NZD with $9.33 trillion, up from $5.92 trillion, an increase of 58%
- KRW with $3.06 trillion, up from $2.83 trillion
- INR with $3.45 trillion, up from $2.74 trillion, an increase of 26%
- SGD with $2.62 trillion, up from $2.03 trillion, an increase of 29%
- HKD with $1.74 trillion, up from $1.71 trillion
- THB with $1.54 billion, up from $0.80 trillion, an increase of 93%
- TWD with $629 billion, up from $353 billion, an increase of 78%
Not shown in the chart is that LCH SwapClear has 81% of the overall AsiaPac 2024 volume.
The only currencies where LCH has less than 100% share are:
- CNY, with Shanghai Clearing 59.78%, LCH 40.16%, HKEX 0.05%
- INR, with LCH 71.94%, CCIL 28.03%, CME 0.03%
- HKD, with LCH 99.07%, HKEX 0.85%, CME 0.07%
And before we leave AsiaPac, let us look at Cross Currency Swaps, all at HKEX.
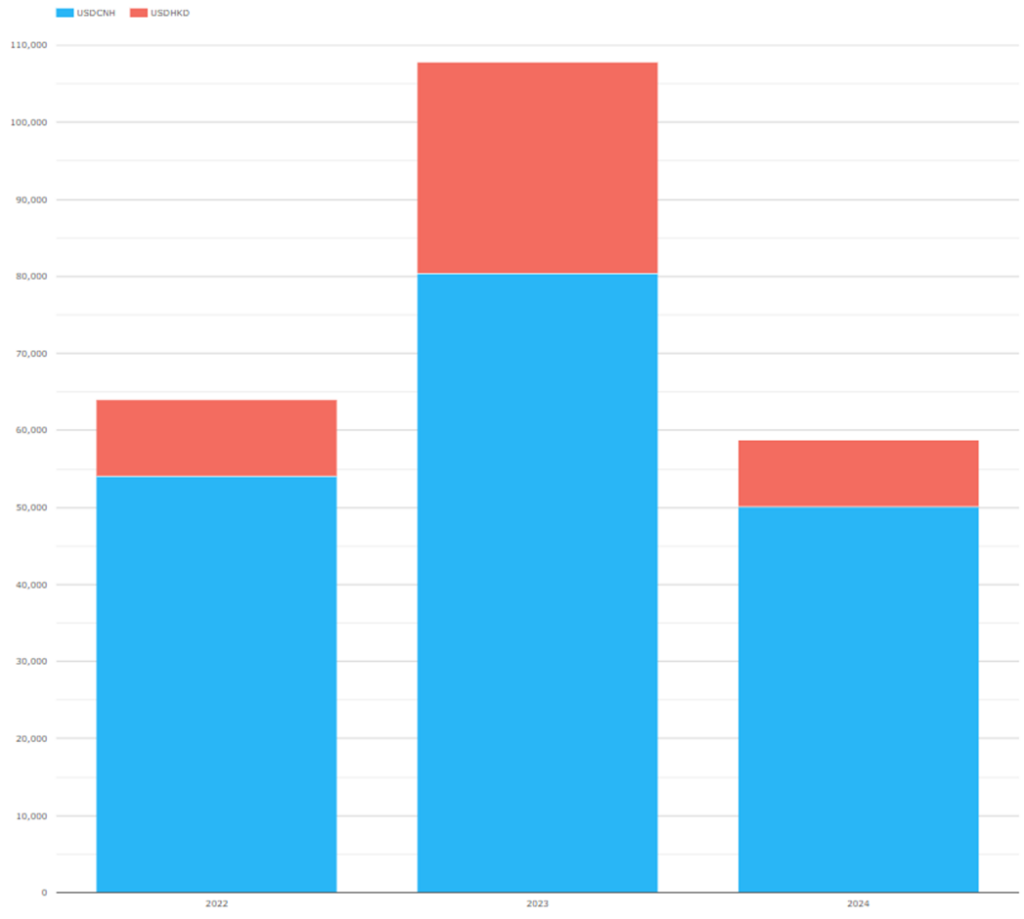
Cross Currency Swap volumes at HKEX, in USD millions
- USDCNH down to $50 billion from $78 billion a year earlier, a reduction of 38%
- USDHKD down to $8.8 billion from $27.4 billion, a decrease of 68%
LatAm Swaps
And, finally, LatAm Swaps.
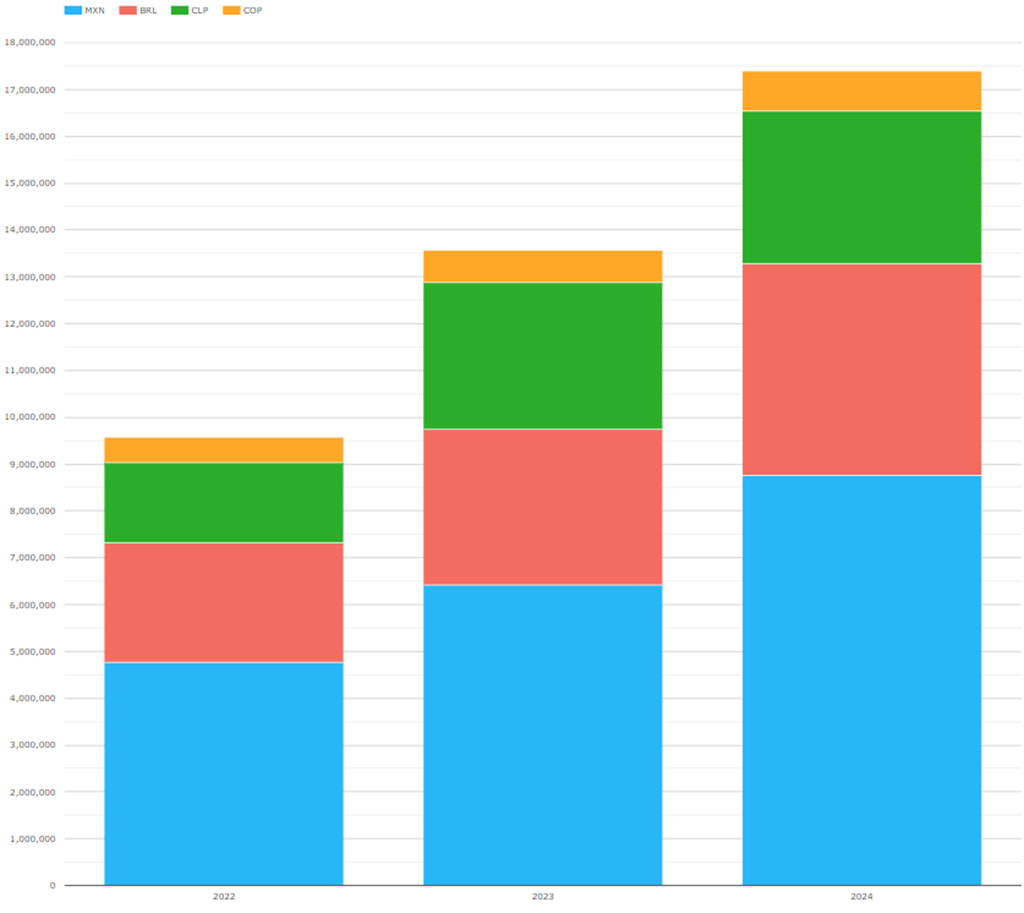
LatAm Swaps volume, single-sided gross notional in USD millions
- 2024 with $17.4 trillion, up from $13.6 trillion in 2023, an increase of 28%
- MXN the largest with $8.75 trillion, up from $6.42 trillion, an increase of 36.3%
- BRL with $4.52 trillion, up from $3.33 trillion, an increase of 36.0%
- CLP with $3.27 trillion, up from $3.12 trillion
- COP with $839 billion, up from $691 billion, an increase of 21.6%
Not shown in the chart is that CME has >98% share in 2023 each of these currencies except MXN, where CME had 86.8%, Asigna/Mexder with 12.3% and LCH with 2.2%.
Overall Latam share in 2024 was CME 91.1%, Asigna/Mexder 6.2%, LCH 2.7% – CME yielding about 1% to each of the other two players compared with 2023.
That’s It
Only fifteen charts for an overview, and there is a lot more data to look at e.g.
- Quarterly, monthly, weekly, and daily with the above data
- IR Futures in all the major currencies
- US Treasury volumes
- Credit Derivatives and FX Derivatives
Please contact us for information on CCPView or more details on any of the above.