Clearinghouses have published their latest CPMI-IOSCO Quantitative Disclosures:
- Initial margin for ETD at $511 billion – a new record – up 9% QoQ and up 17% YoY.
- Initial margin for IRS at $339 billion – almost equaling the record – up 12% QoQ and up 20% YoY.
- Initial margin for CDS at $63 billion is up 6% QoQ and 0.6% YoY.
- In 3Q24, several CCP quantitative disclosures show record highs.
- Highlighted are CDS, CME, DTCC, ICE, JSCC, LCH, OCC.
- Read on for all the details.
Background
Under the CPMI-IOSCO Public Quantitative Disclosures, central (clearing) counterparties CCPs publish over 200 quantitative data fields covering margin, default resources, credit risk, collateral, liquidity risk, back-testing, and more.
CCPView has over 8 years of these quarterly disclosures for 44 clearinghouses, each with multiple Clearing Services, covering the period from 30 September 2015 to 30 September 2024. This disclosure data provides insights into trends over time at one CCP and comparisons between CCPs.
Let us look at the latest disclosures.
Initial margin (IM) for interest rate swaps (IRS)
IM at the four major IRS CCPs was $339 billion on 30 September 2024, up $35.6 billion or 12% QoQ and up $55.7 billion or 20% YoY. This level is only $40 million shy of the previous all-time high of $340 billion on 31 March 2023. By CCP we see:
- LCH SwapClear with $248 billion or £185 billion, in GBP terms up 6.3% QoQ and 10.8% YoY but less than its Q423 peak of £188.9 billion.
- Eurex OTC IRS with $43.3 billion or €38.7 billion, in EUR terms up 4.1% QoQ and up 34% YoY but less than its Q422 high of €59.4 billion.
- CME IRS with $36.8 billion, up $1.5 billion (4.3%) QoQ and down $0.6 billion (1.6%) YoY but less than its Q220 high of $40.4 billion.
- JSCC IRS with $10.9 billion or Y1,560 billion, up 9.6% QoQ and 2.8% YoY in JPY terms, but less than its Q323 high of Y1,941 billion.
IM for credit default swaps (CDS)
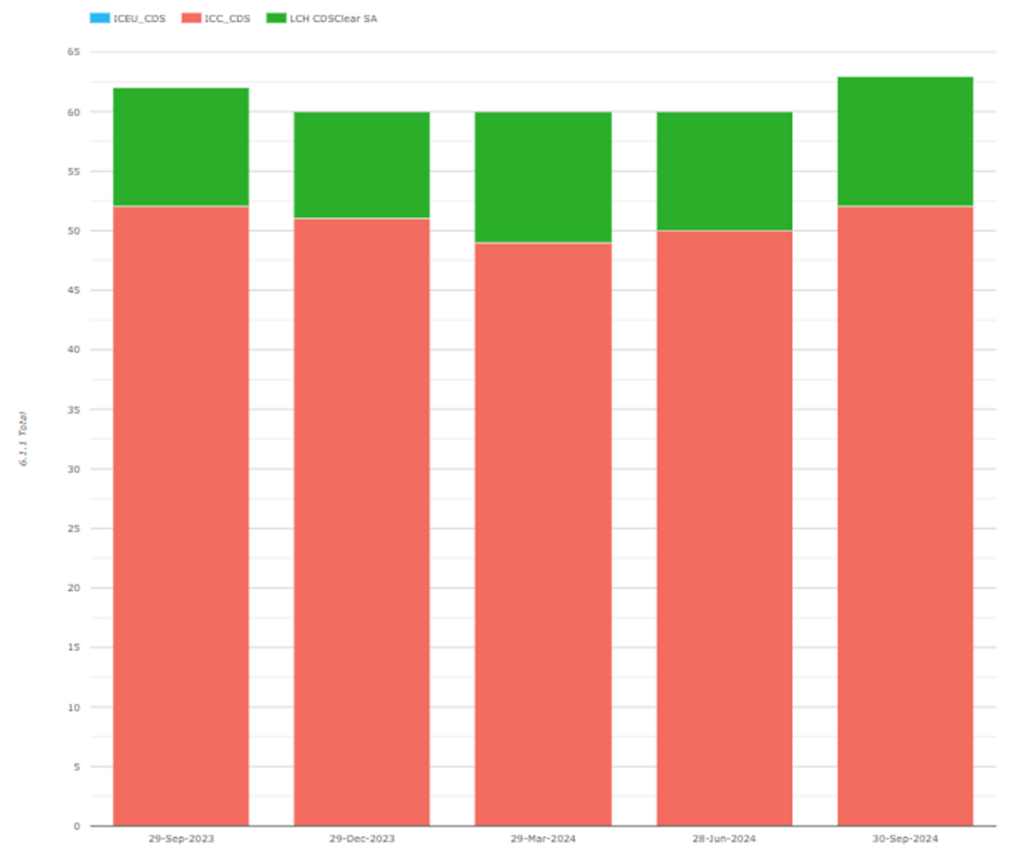
IM at the two major CDS CCPs totaled $63 billion on 30 September 2024, up $3.8 billion or 6% QoQ and up $0.4 billion or 0.6% YoY. This has consistently been close to $60 billion for the past five quarters, having peaked above $75 billion in 2022. By CCP we see:
- ICE Credit Clear with $52.1 billion, up $2.5 billion or 5.7% QoQ and down $0.4 billion or 0.7% YoY.
- LCH CDSClear with $10.9 billion or €9.8 billion, up €0.7 billion or 8% QoQ and up €0.4 billion or 4% YoY.
- ICE Europe Credit at zero having closed in 2023 – its $0.23 billion in Q323 will be its last appearance in this post.
IM for exchange traded derivatives (ETD)
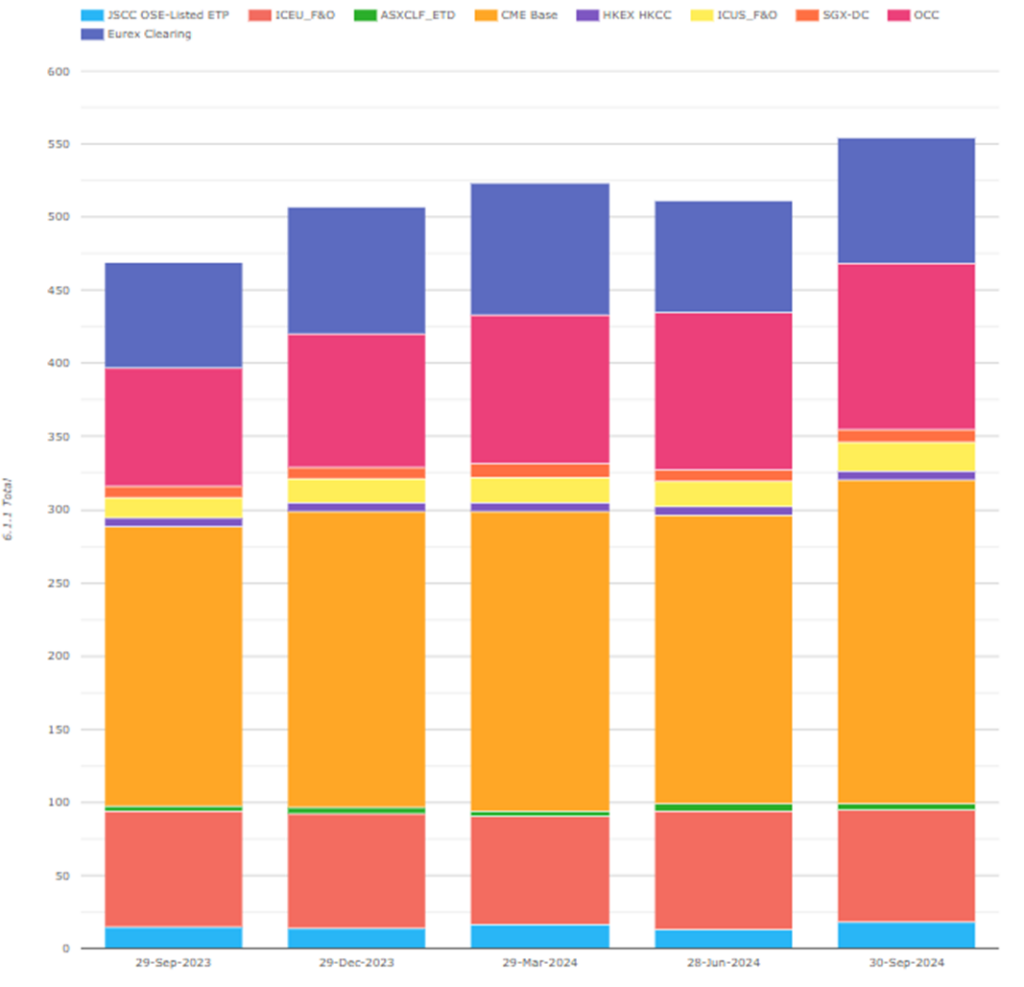
IM at our selected ETD CCPs was $511 billion on 30 September 2024, up $42 billion or 9% QoQ and up $73 billion or 17% YoY. This is a new highest-ever quarter, beating $480 billion in Q1 2024. (Note the chart shows higher totals as Eurex includes OTC IRS IM, which I exclude). By CCP we see:
- CME Base with $221 billion, down 4% ($8 billion) QoQ and up 3% ($6b) YoY.
- OCC with $113 billion, up 5% QoQ and up 40% ($32 billion) YoY.
- ICE Europe F&O with $77 billion, down 4% ($3.5 billion) QoQ and down 4% YoY.
- Eurex with $43 billion, up 17% ($6.4 billion) QoQ and down 4% YoY.
- ICE US F&O $20 billion, up 16% ($2.8 billion) QoQ and up 45% ($6.2 billion) YoY.
- JSCC OSE Listed ETP with $18 billion, up 41% ($5.3 billion) QoQ and up 18% YoY.
- SGX-DC $9.5 billion, up 26% ($2 billion) QoQ and up 24% YoY.
- HKEX HKCC with $6.2 billion, up 11% QoQ and down 3% YoY.
- ASX CLF ETD $4.2 billion, down 8% QoQ and up 27% YoY.
Other disclosures of interest
Next, let us do a quick scan of 30 September 2024 disclosures, highlighting those with significant changes.
- The IRS and ETD IM increases and new records mean quite a few of the majors listed above had increases and records individually in margin-related metrics, such as various flavors of total collateral held, estimated stress losses, and the like – too many to list here. Feel free to browse each CCP in the tool for more detail.
- CDS – 4.1.8 Committed aggregate participant contributions to address an initial default dropped back to CAD 3.9 billion after peaking at CAD 10 billion in Q224.
- CME Base – 6.2.5 House IM Pre-Haircut Non-Cash Sovereign Government Bonds – Domestic, that is, US government bonds put up as IM by banks, was $29.4 billion pre-haircut – a new record, up 33% from the prior quarter record of $22.1 billion. Since total IM reduced, this suggests a collateral type shift.
- DTCC GSD (the FICC’s UST clearinghouse as discussed in my ION Markets blogs) – 6.1.1 Total IM required was $56.3 billion – a new record (up 25% QoQ and 41% YoY). The sharp volume increase reflects material expansion in UST clearing in the quarter in anticipation of the SEC UST clearing mandate, and translates naturally to increases in other margin-related metrics. Most notably, 6.8.1 Maximum aggregate daily IM call was $6.0 billion, up 40% from the previous high of $4.3 billion.
- DTCC NSCC (an equities and corporate bond clearing service) – both 7.3.3 and 7.3.7 Amount Exceeded were $4.0 billion – NSCC’s first disclosed breach of qualifying liquid resources.
- ICEU (European IR F&O CCP) 7.1.8 Liquid GBP resources were £4 billion, up 66% from their previous high of £3 billion from Q423; while 7.1.8 Liquid USD resources were $25.2 billion, down QoQ from $27.2 billion.
- JSCC IRS had 23.1.1 OTC JPY average daily volumes were 845 trades up 11% QoQ from the prior high of 759. 23.1.2 OTC JPY average daily notional cleared was JPY 18.8 trillion, up 33% QoQ from the prior quarter’s high of JPY 15.8 trillion.
- LCH Swap Clear 23.2.1 CAD gross notional of novated but not settled trades were CAD 19.2 billion, a tiny fraction of the prior high of Q123 high of CAD 1,349.1 billion. I wonder whether this was indirectly something to do with the transition from CDOR to CORRA?
- LCH Forex Clear 23.2.1 USD gross notional of novated but not settled trades were $9.2 billion up 28% QoQ from $7.2 billion, the prior high, reflecting volume growth.
- LCH SA Bonds and Repos 23.2.1 EUR gross notional outstanding of novated but not settled cash bond trades were €84.9 billion up 25% QoQ from €67.7 billion – the prior high.
- LCH SA Cash and Derivatives 6.1.1 total margin dropped to just €19 million from €7.1 billion the prior quarter (as a result of the service closing).
- LCH CDSClear SA had more than 10% increases in many margin-related metrics (too many to show here) despite 6.1.1 total margin only increasing below 10%. This may indicate a shift in the composition of collateral types making up the margin.
- OCC House IM required was $63.0 billion, up 20% QoQ from $52.6 billion the prior quarter high; while total OCC IM only increased by about 5% because of declines in client margin. Some collateral categories and stress losses also peaked.
There are many more Clearing Services and Disclosures, but I will stop there and leave it to those with CCPView access to analyze further changes.
As well as a Web UI, we also offer an API to access this data programmatically.
IOSCO Quantitative Disclosures
CCPView has disclosures from 44 clearinghouses, each with many Clearing Services, covering equities, bonds, futures, options, and OTC derivatives with over 200 quantitative data fields each quarter and quarterly figures from September 2015 to September 2024.
If you are interested in this data, do get in touch.