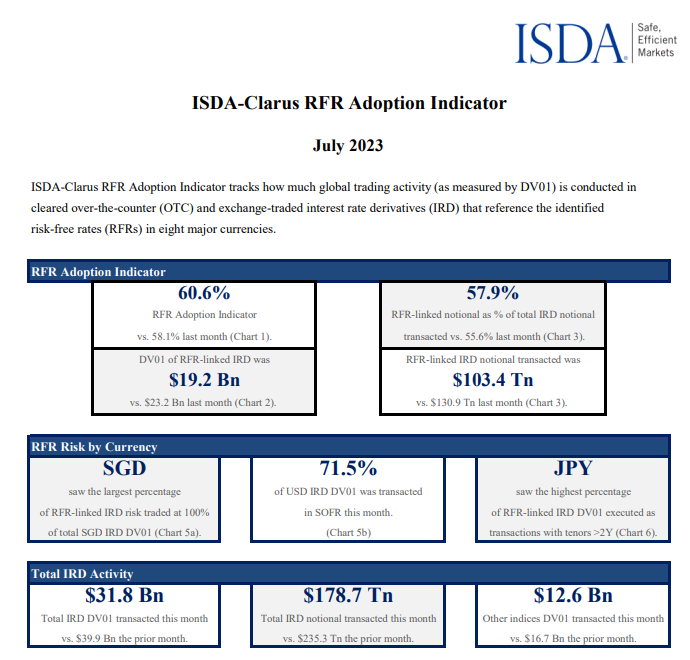
- RFR Adoption hit 60.6% in July 2023, almost back to the all time high.
- USD SOFR Adoption rose to a new all time high of 71.5%.
- This is the first time that the adoption measures have risen since CCP conversion exercises earlier this year.
RFR Adoption is Increasing Again
The latest edition of the ISDA-Clarus RFR Adoption Indicator was published earlier this week. You can find the full report over on the ISDA website here. As always, we provide a look into the data:

Showing;
- RFR Adoption increased to 60.6% last month.
- This is a bit more reassuring as looking back at my previous two blogs, I was getting a bit worried about the recent declines!
- It would be remiss to fail to point out that we are not quite back to the all time high. That was hit in April, before the conversion exercises at the CCPs:

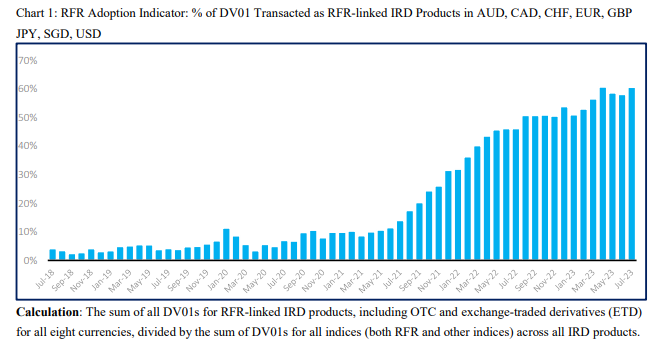
- The percentage of notional that traded versus an RFR did hit a new all time high, and is on a more reassuring trend higher (for those of us comforted by such things!):

- 58% of notional, across both OTC and ETD markets, was traded versus an RFR in July 2023.
- That was 2% higher than last month, which was itself a new high in the time-series.
- Whilst we continue to prefer DV01 as a measure to track long-term trends in market structure, it is nonetheless healthy to see notional amounts tracking higher as well.
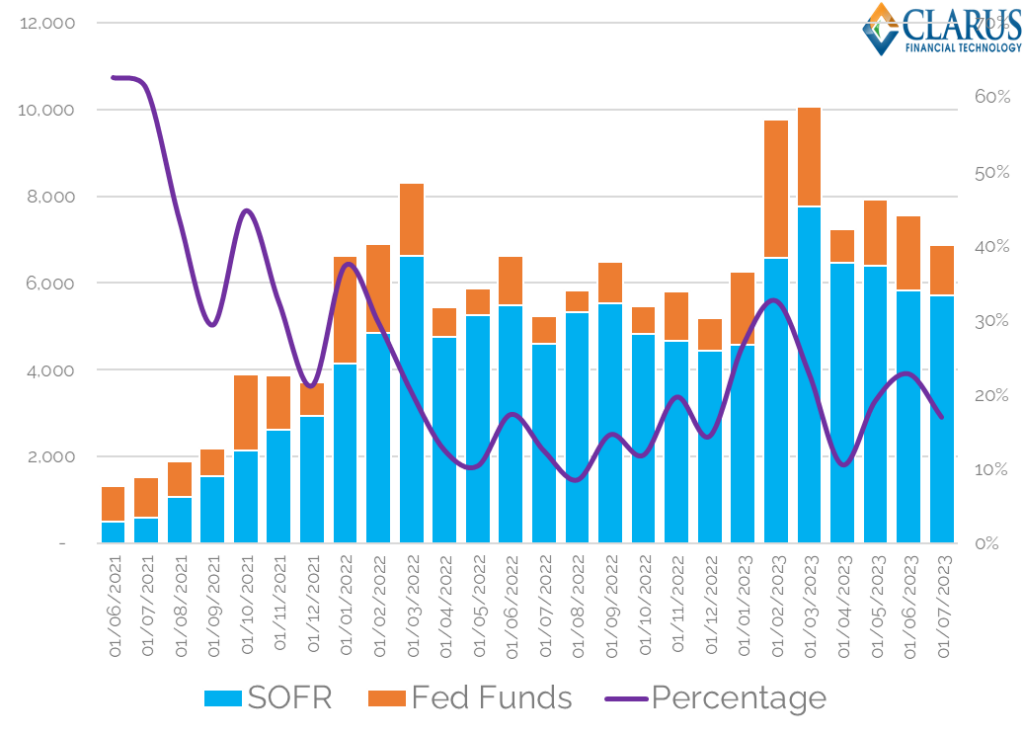
SOFR Trading Increases
As long-time readers well know by now, USD markets (and hence SOFR) make up the largest portion of the overall RFR Adoption Indicator. SOFR adoption increased to a new all time high last month, hence moving the total Adoption Indicator higher:

Showing;
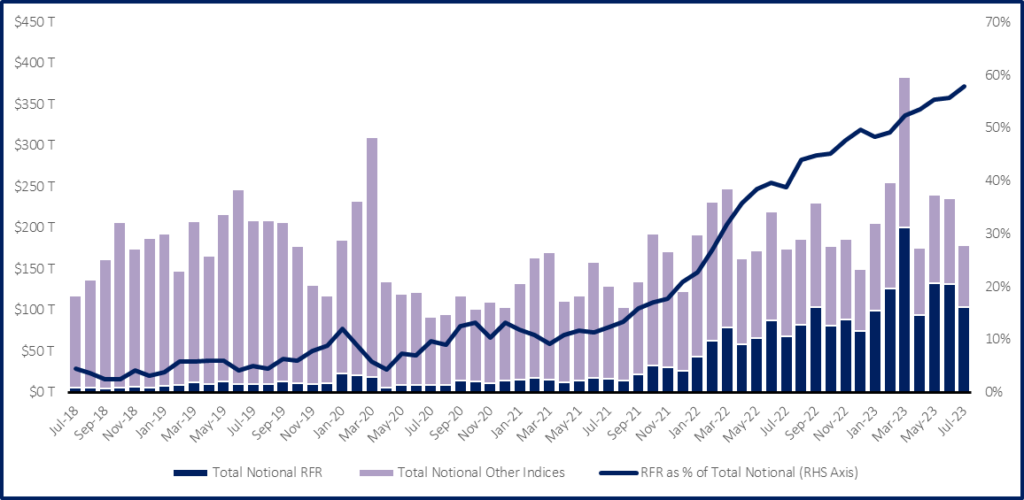
- USD SOFR Adoption increased by 6.5% last month to a new all time high.
- Now sitting at 71.5%, this marks the highest reading since April.
Looking at the other currencies in the graphic above;
- GBP, JPY, CHF and SGD now largely trade as single index markets. Yes, there are bits and bobs traded in TIBOR in JPY, but for all intents and purposes, transition is complete in these markets.
- CAD is in the middle of a sustained “CORRA First” move as we approach CDOR cessation next year. We have blogged about this (see here), but suffice to say it comes as a very positive sign that CORRA adoption jumped by nearly 10% last month to sit at a new all time high of 68% – almost as much as SOFR.
- In markets where there are still “legacy” indices in play, the time-series of adoption is volatile on a month-on-month basis.
- EUR is the best example of this. My feeling is that the amount of EUR €STR trading is just as much related to market expectations of ECB policy as it is to market participants showing a preference for risk free rates. As a result, €STR trading dropped to just under a quarter of the market (24.7%) last month.
- It is a shame we don’t have a longer time-history of OIS vs Term Rate adoption. It would have been interesting to see how much EONIA OIS traded the last time the ECB was in play, way back in 2014/15.
- At least we have now started monitoring the adoption of Fed Funds in USD markets. Whilst not exactly comparable, it still appears that Fed Funds trading increases relative to SOFR when markets are readjusting expectations of FOMC actions.
Fed Funds Trading
Continuing from last month’s blog, the Clarus API makes the monitoring of these market structure trends very simple. As I continue to highlight, the volatility in SOFR adoption is not because people are still trading USD LIBOR – they are not:

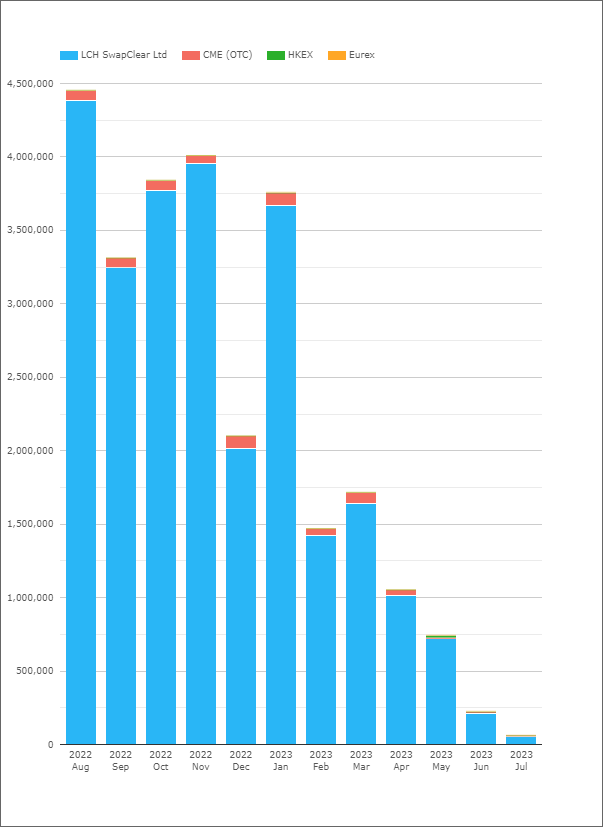
Rather, the USD market is now a true “dual rate” regime, whereby market participant’s preference for trading either Fed Funds or SOFR changes month-on-month. And this preference is volatile. From the CCPView API:

Showing;
- The percentage of risk traded in USD OIS as either SOFR or Fed Funds. Note this is only for OTC products.
- It is a volatile time-series, with anything from 10-35% of risk traded versus Fed Funds in the past six months alone.
- Last month saw a drop in the amount of Fed Funds traded, down at 17% of total USD OIS risk.
It is worth noting that this looks to be a uniquely OTC phenomenon. When looking at the split of CME futures between Fed Funds and SOFR, it is pretty consistent month to month:

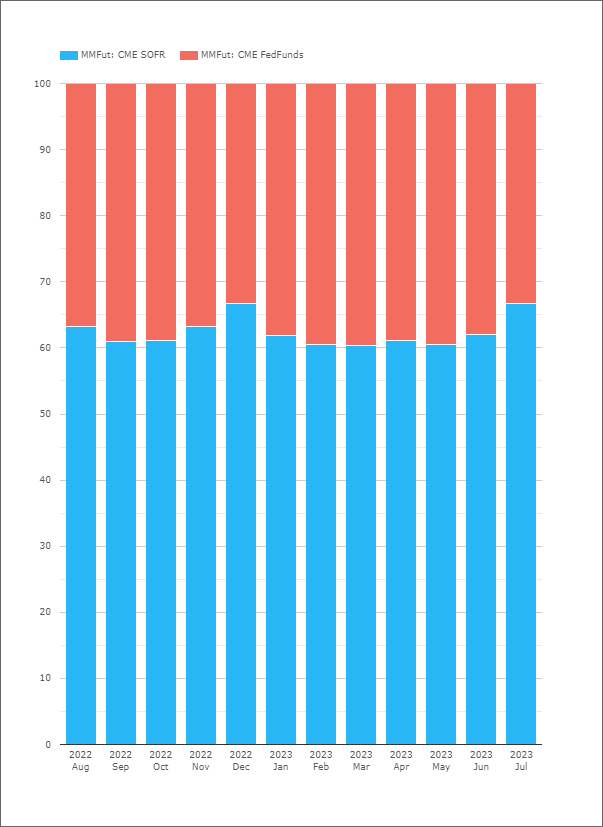
It seems strange that OTC and ETD markets should behave so differently in this one metric and yet so similarly in most others (i.e. if volumes go up in ETD, they go up in OTC and vice versa). One to monitor.
In Summary
- RFR Adoption increased last month to 60.6%.
- SOFR adoption increased last month to 71.5%. a new record.
- CAD CORRA adoption increased by nearly 10% last month, to now sit at 68%.
- There continue to be particular market dynamics that should be monitored in EUR €STR and USD Fed Funds trading.