- The ISDA-Clarus RFR Adoption Indicator declined again in June 2023.
- That seems odd given that LIBOR has now finally ceased publication!
- It is as a result of Fed Funds being very active at the moment.
- Whether this is a function of benchmark transition or Fed policy changes is hard to say.
- Clarus Microservices are powerful tools to examine trends in both SOFR and Fed Funds activity.
Most of our readers come to the Clarus blog to receive new information from us. Whether that be on the data side (such as the monthly RFR Adoption Indicator) or about new regulations (such as Central Clearing of Bonds and Repos). But do our readers ever stop to consider which tools we use to deliver these blogs?
Clarus Microservices
All of our data is accessible programmatically via our Microservices. Head over here to check them out –> Clarus Microservices:
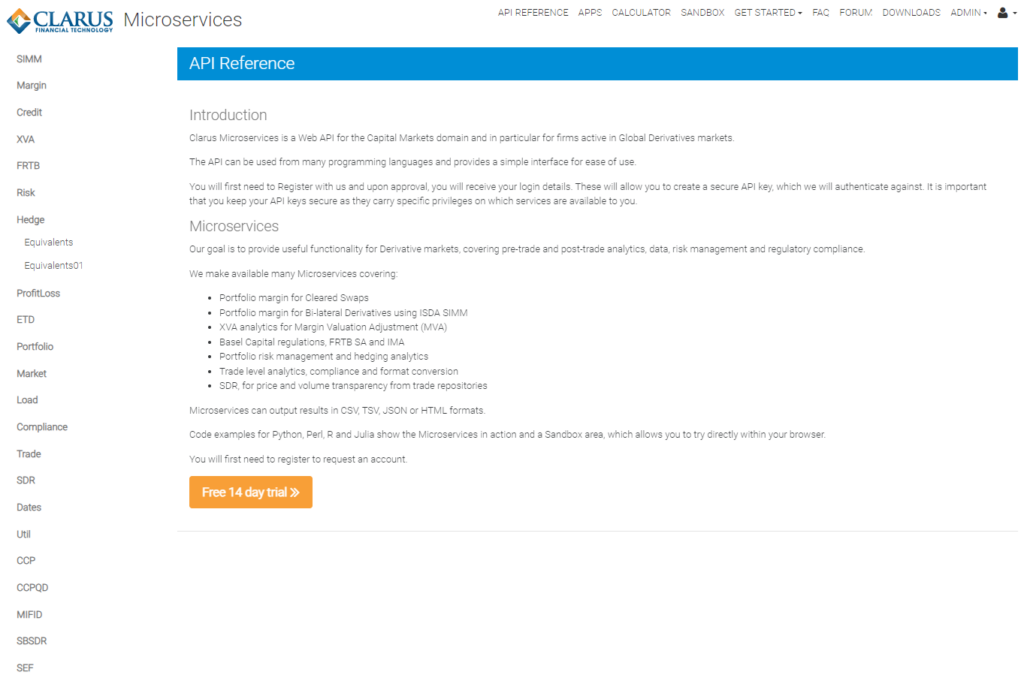
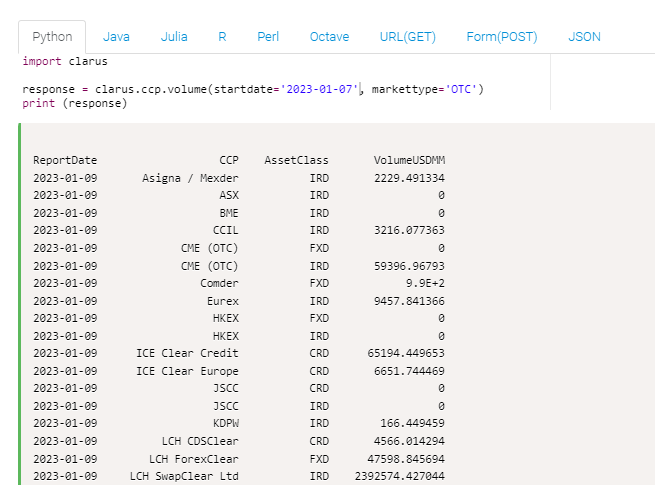
This can be accessed via Python, or any of the 7 languages within our “sandbox”:
In addition, if you are a luddite like me, you can also access it from Excel, using our “Clarus” add-in:
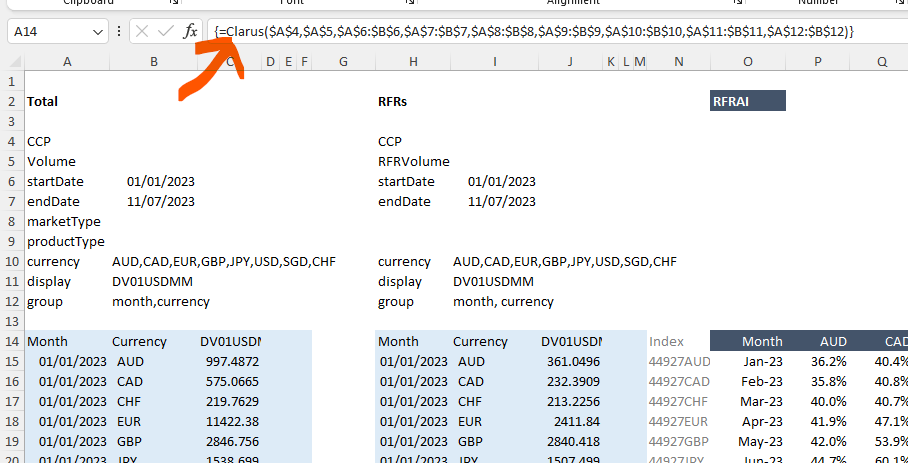
This allows me to do a fair bit of “ad-hoc” analysis very quickly. It helps to be familiar with the data, but equally having really simple ways to play around with the data is very powerful.
USD SOFR Adoption has Declined Again
For example, last month, we noted how weird it was that both overall RFR Trading and, in particular, USD SOFR Trading declined in May 2023. And guess what? June 2023 wasn’t a great month either, with declines recorded in both of these metrics again:
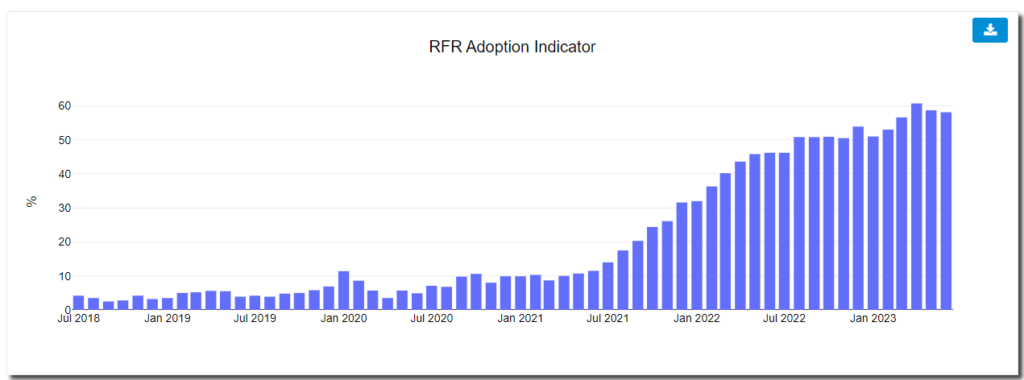
Showing that the headline ISDA-Clarus RFR Adoption Indicator reduced from 58.7% to 58.1% in June 2023. From the full ISDA publication:
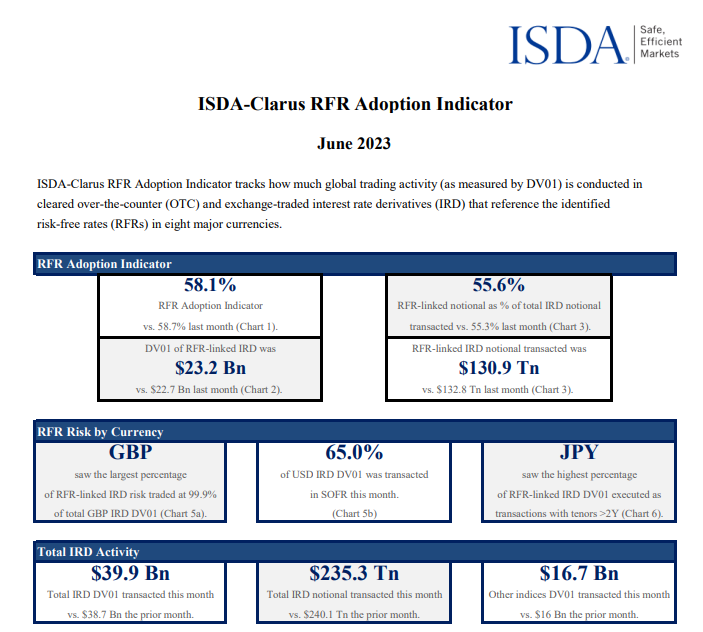
Showing;
- The index decreased to 58.1%, 0.6% lower.
- SOFR adoption reduced to 65%, from 65.6% last month.
- RFR trading increased in EUR, up 1.5% to 28.6% for €STR.
- The transition story is far from straight-forward!
As ISDA put it;
The drop was driven by higher federal funds trading activity.
ISDA-Clarus RFR Adoption Indicator. June 2023
How do they know this? Clarus examined the underlying DV01 data using Clarus Microservices.
Fed Funds Trading
I have already written two blogs covering the rise in Fed Funds trading this year:
- Are Fed Funds The Latest Winners from Benchmark Reform?
- Find Out What Was Weird About RFR Trading in May
That means I am relatively well equipped to explain why, in the months since the largest CCPs converted USD LIBOR swaps AND all of the LIBOR futures contracts were converted we continue to see so much of the USD market trading versus “legacy rates”.
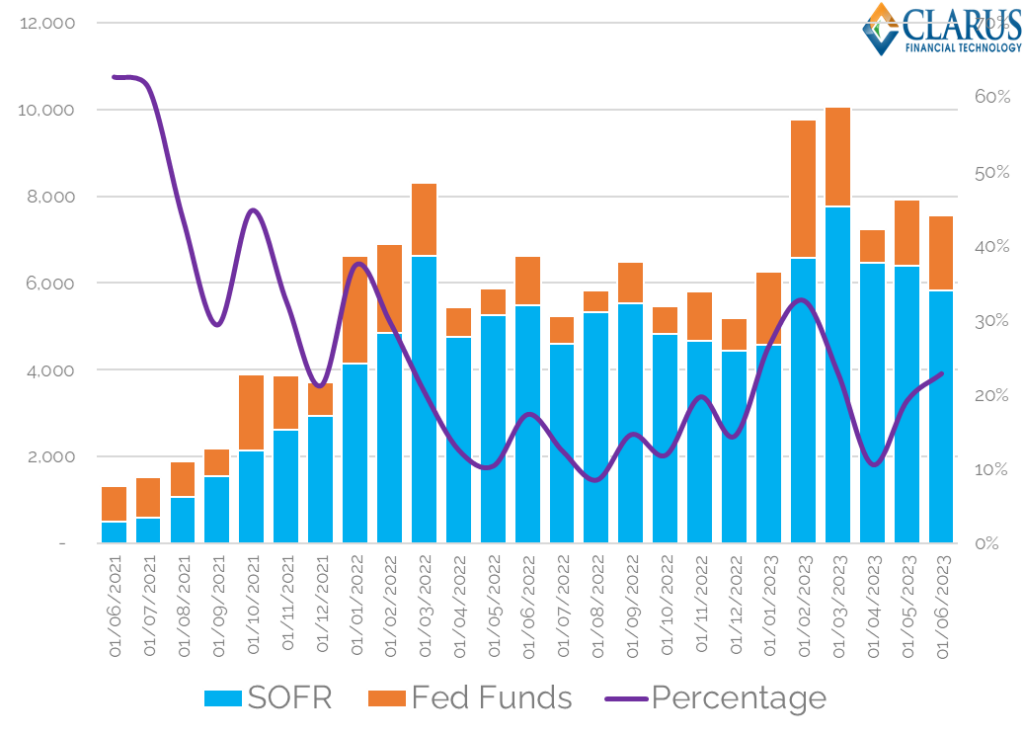
The amount of Fed Funds trading continues to be large. I now monitor it using our API (hence the blog title this week), which gives me a very simple tool:
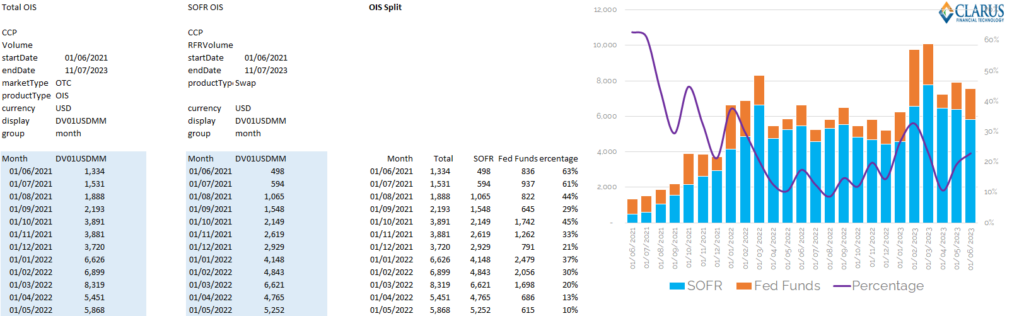
This spreadsheet sends just two requests;
- Request (1) calls all DV01 volumes in USD OIS swaps from CCPView.
- Request (2) calls DV01 volumes in RFR USD OIS swaps from CCPView (via our “RFR” view).
- Request (1) – Request (2) leaves the balance. This OIS volume is the DV01 traded versus Fed Funds products each month.
It is very simple but having the right tools makes it easy to update and adds to our understanding of the data. It shows that 23% of all OIS risk was traded versus Fed Funds in June 2023. That is below January and February 2023 but remains elevated compared to 2022:
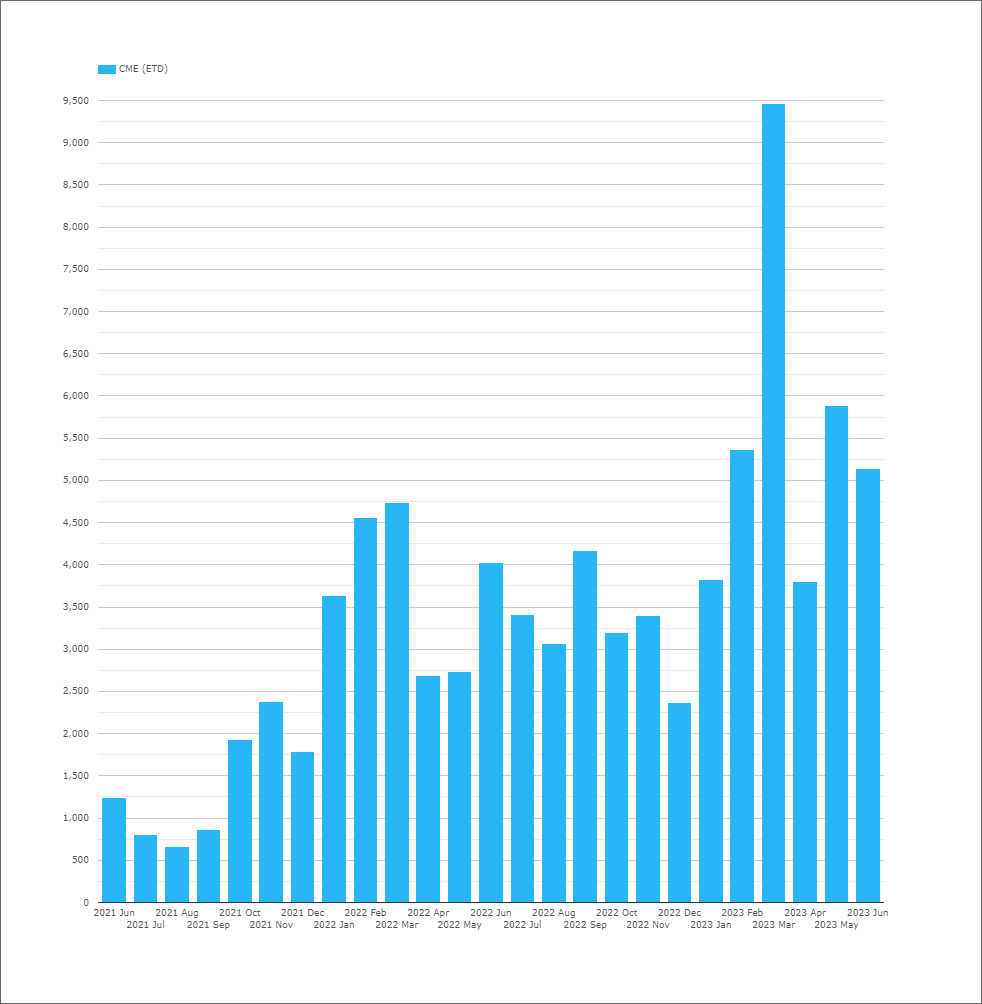
There is a lot of Fed Funds risk being traded in EFFR futures as well – over $5bn in DV01 in June:
Is Increased Fed Funds a Feature of Transition?
We don’t have any other jurisdictions to look at and compare to USD. All other currencies have ended up in a single-index world:
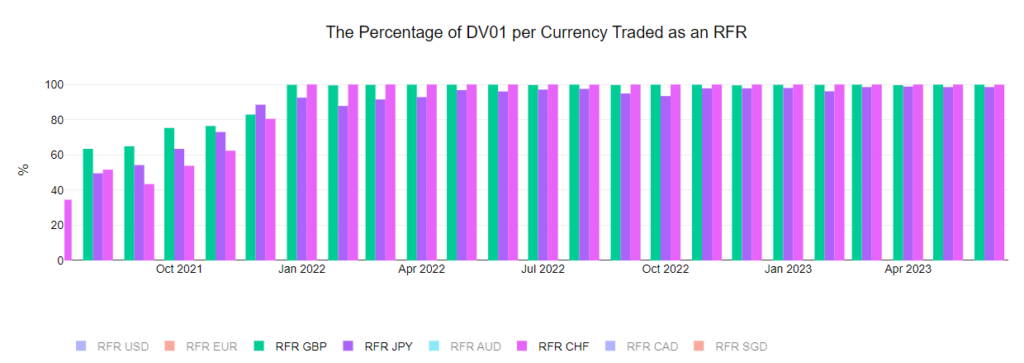
Showing that GBP, JPY and CHF markets now trade pretty much 100% of risk each month versus their RFRs. We did wonder about JPY for a while, with some signs that TIBOR volumes might fight it out with TONA. However, TONA has now recorded above 98% volumes virtually all year, so I don’t think of JPY as a “dual rate” regime.
Currently, in USD markets, Fed Funds are a really significant portion of the market. Will this continue?
It is a great question, but it is really hard to disassociate the impact of Fed policy (and specifically market expectations of Fed policy changes) from the amount of activity we see in Fed Funds. The large amounts of Fed Funds activity may have very little to do with benchmark transition.
Is There More Long-Dated Fed Funds Activity?
A feature of SOFR OIS trading is how long-dated it is.
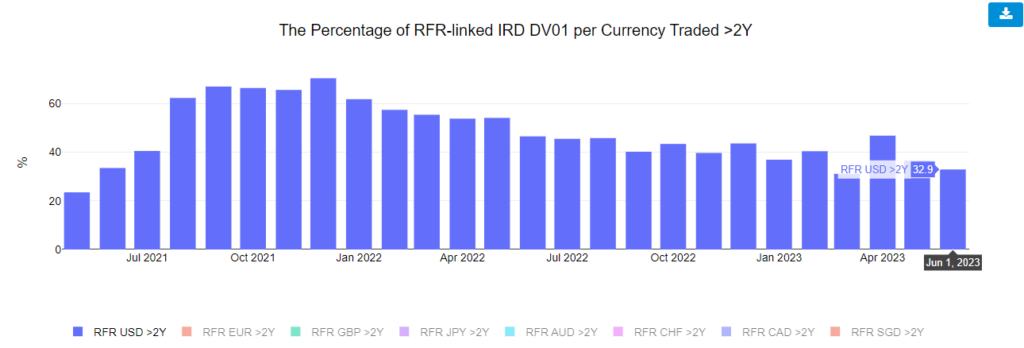
Showing that in some months, over 60% of risk has been traded in tenors longer than 2YR. However, the amount of short dated activity in SOFR has certainly increased as:
- The Fed started hiking Rates and
- As Eurodollars are no more and SOFR futures have seen increased volumes.
Creating a similar chart for Fed Funds activity (again using our Clarus Microservices 😛 ) :
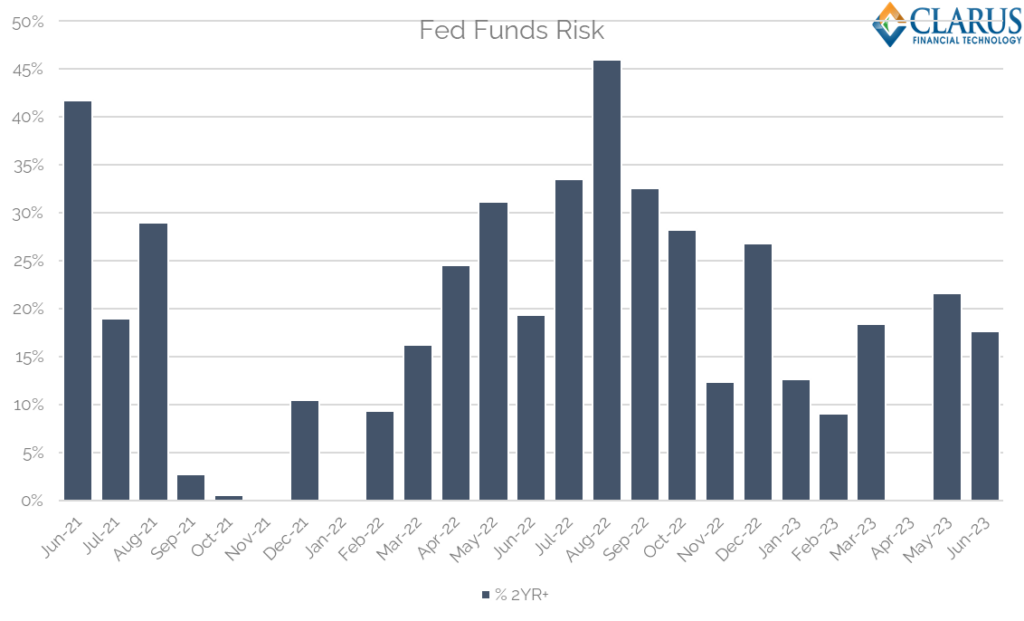
Showing no clear trend. All we can really say is that 33% of risk in SOFR was longer than 2 years versus just 18% of Fed Funds risk in June 2023. That is something to monitor but no clear conclusions just yet.
In Summary
- The ISDA-Clarus RFR Adoption Indicator declined again in June 2023.
- That seems odd given that LIBOR has now finally ceased publication!
- It is as a result of Fed Funds being very active at the moment.
- Whether this is a function of benchmark transition or Fed policy changes is hard to say.
- Clarus Microservices are powerful tools to examine trends in trading activity.