February 2021 was an interesting month in interest rate markets with the volatility in US Treasuries showing up in many products. Today I look at what happened to volumes in derivatives referencing SOFR.
- Volume and Open Interest in SOFR Futures
- Volume and OI in SOFR Swaps
- SOFR Swaps at US SDRs
- SOFR Swaps on SEFs
- Clarus Data provides the insight
SOFR Futures
In CCPView we collect data for all major interest rate futures, so let’s start by looking at SOFR futures.

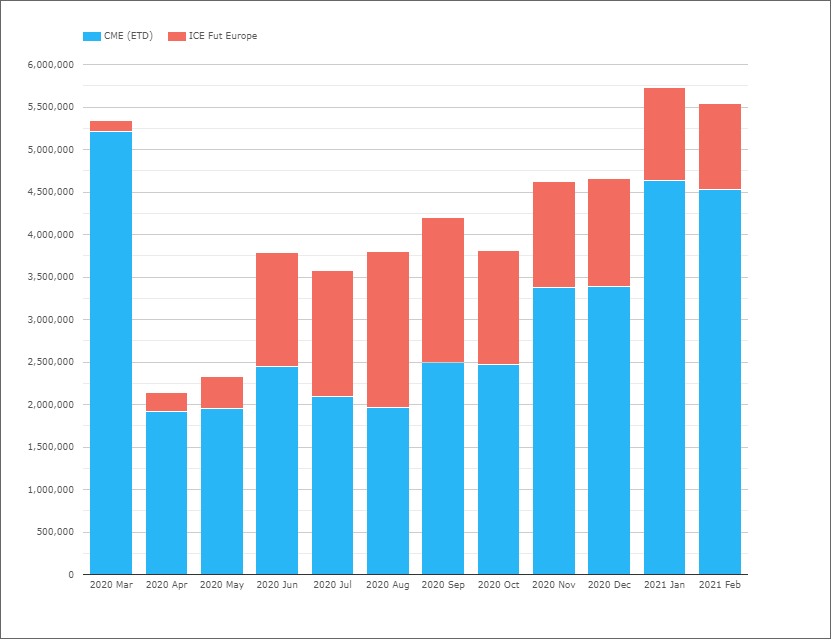
- Jan-21 and Feb-21, were record months with gross notional exceeding $5.5 trillion in each month
- Volumes trending up from Oct-20 and exceeding the previous record of $5.4 trillion in Mar-20
- CME the largest with $4.5 trillion volume in Feb-21 for it’s SOFR Futures, (both 1-month and 3-month contracts) and the ERIS Swap Future with $12.9 billion notional, jumping from $4.2 billion in Jan-21
- CME SOFR Futures with ADV of $237 billion in Feb-21 (19 days), a new record and a record daily high of $378 billion on 25-Feb, with five further days > $300 billion
- ICE with $1 trillion volume in Feb-21, across both it’s 1-month and 3-month contracts
- Note CME also has Options in SOFR (not included in the above), trading is not daily but periodic, with volume on one or two days each month, ranging from Oct-20 with $50 million to Dec-20 with $6 billion, so one to keep an eye on for the future.
Next let’s look at the open interest in these Futures.
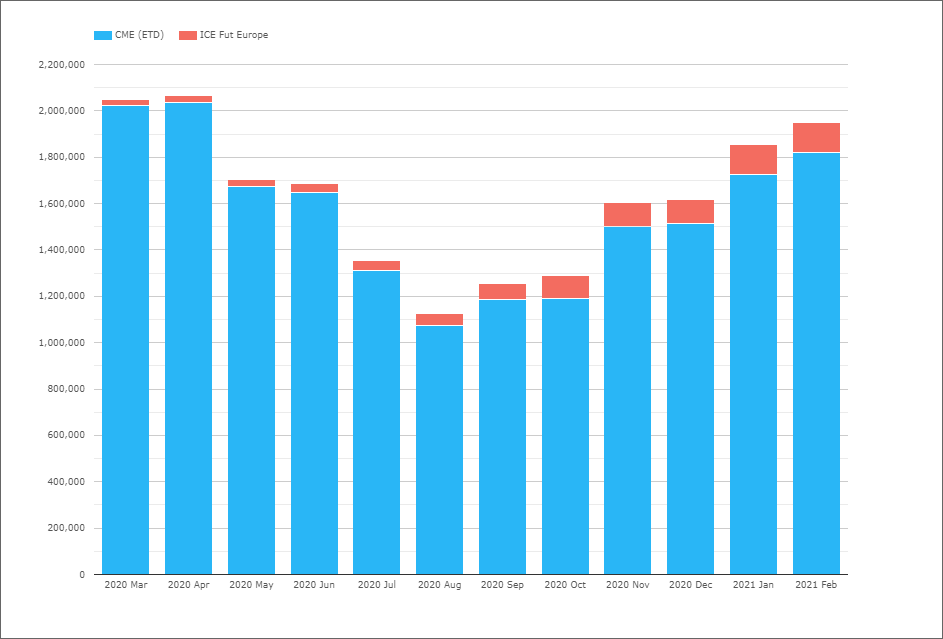
- Trending up from $1.1 trillion in Aug-20 to $1.95 trillion in Feb-21
- Just shy of the record high of $2 trillion in Apr-20
- CME the largest with $1.8 trillion OI at end Feb-21
- ICE with $130 billion OI at end Feb-21
Strong signals in both volume and OI that SOFR Futures are on strong upward trajectory.
Let’s turn next to Swaps.
Global Cleared SOFR Swaps

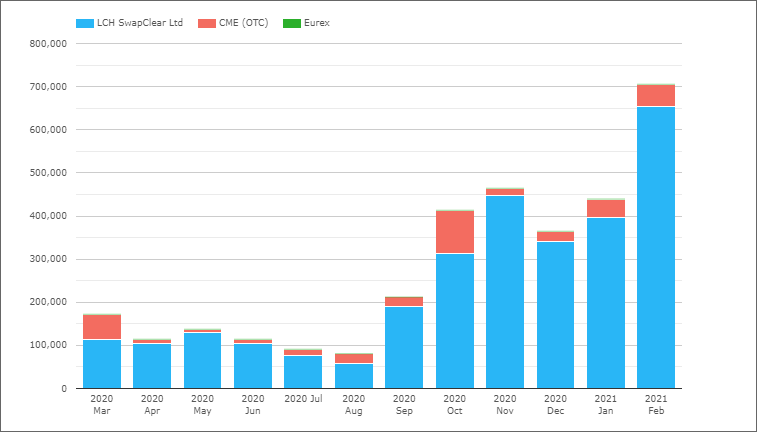
- A sharp jump in Feb-21 to $705 billion a new record, up from $440 billion in Jan-21
- LCH SwapClear with $655 billion of single-sided notional in Feb-21
- CME OTC with $50 billion of single-sided notional
Let’s now switch to a breakdown of volume by tenor.

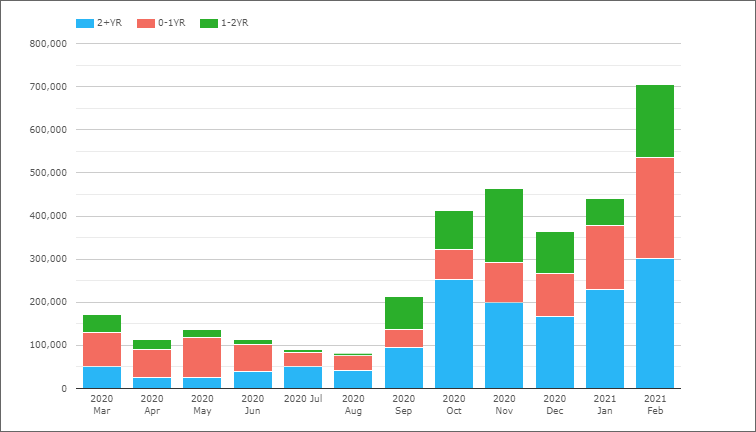
We see that >2Y was the largest tenor bucket in Feb-21 with $300 billion.
Next open interest (aka outstanding notional) of SOFR Swaps registered at CCPs.
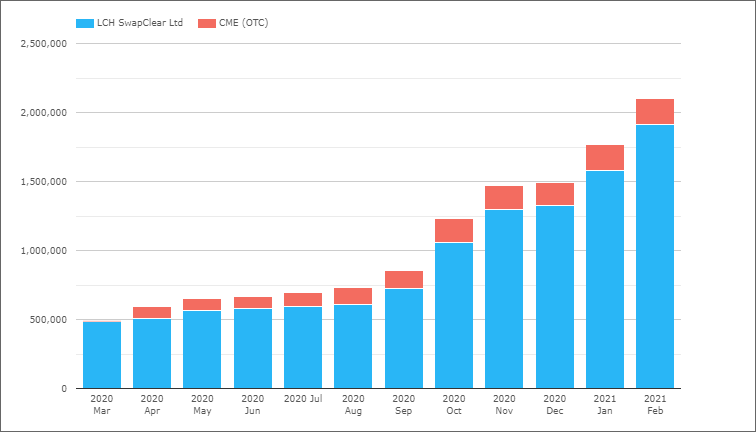
- A record $2.1 trillion as of end Feb-21
- A very strong increasing trend from Oct-20 onwards
- LCH SwapClear now with $1.9 trillion open interest (single-sided)
- CME OTC with $190 billion open interest (single-sided)
SOFR Swaps at US SDRs
In SDRView Res, we have US persons trading activity, in notional, trade counts or dv01 terms for any day, week or month and a dedicated view to monitor RFR Swaps.

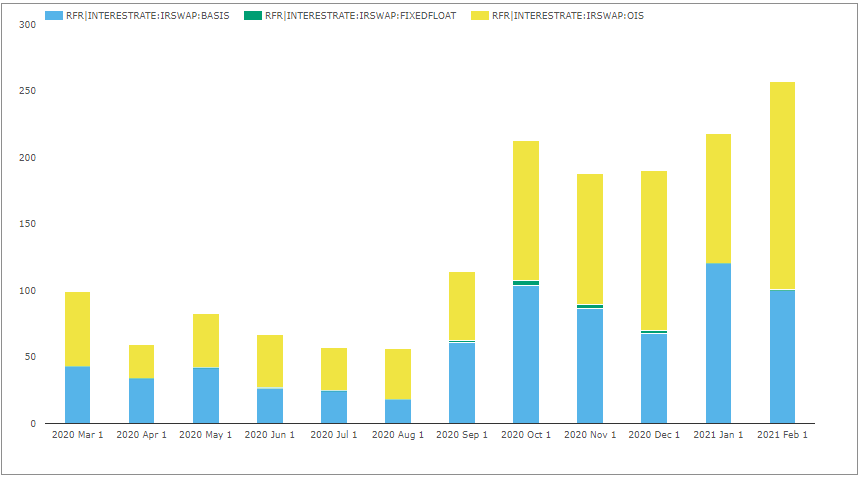
- Showing a record high in Feb-21 of at least $260 billion
- At least $160 billion of OIS and $100 billion of Basis
- I use the qualifier “at least” as we know from SDR public reporting rules that trade notionals above a certain size (calibrated by the CFTC for currency and tenor) are capped to show a maximum size and not the actual notional.
- If we follow the “rule of thumb” we use for USD Libor swaps of 30% understatement, than the $260 billion would be $340 billion or approximately 50% of the global cleared volume of $705 billion
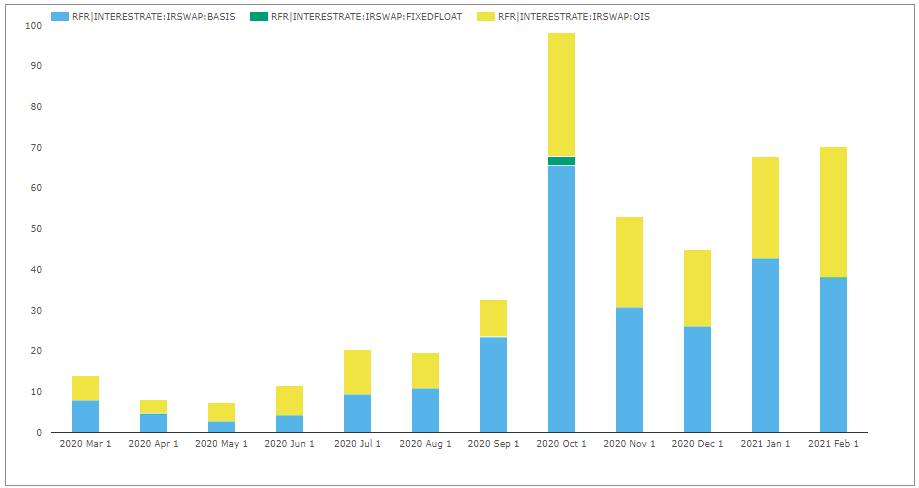
Switching from notional to dv01, we see that while volumes have increased in the last four months, in risk transacted terms, we are well below the highs we saw in Oct-20 when the auctions at CCPs due to the change from FedFunds to SOFR discounting took place.

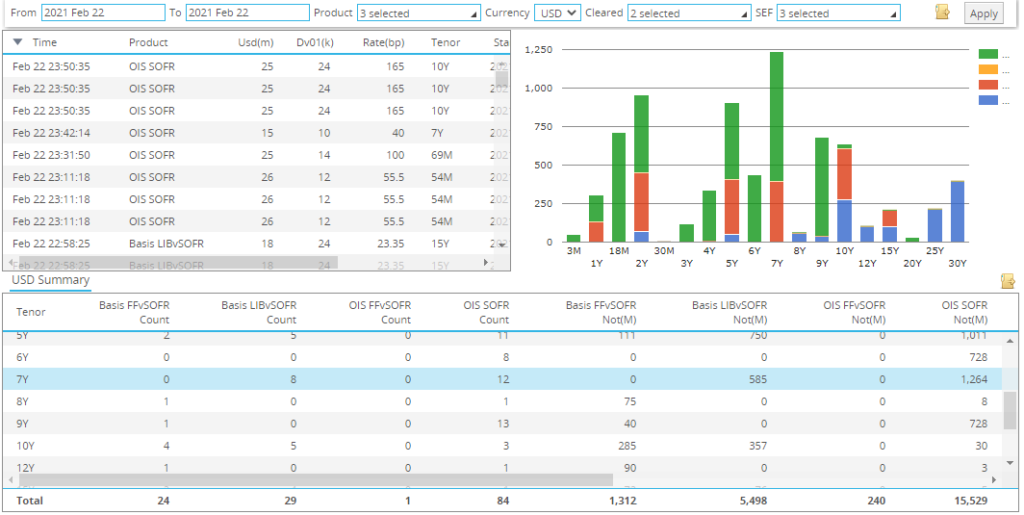
In SDRView Professional, we have live intra-day views to monitor SOFR Swaps and looking at 22-Feb, we see 7Y was the most active tenor with OIS and Basis (Libor vs SOFR) the largest risk traded.

Let’s turn next to SEF trading.
Swap Execution Facilities (SEFs)
In SEFView we can isolate D2C SEFs.

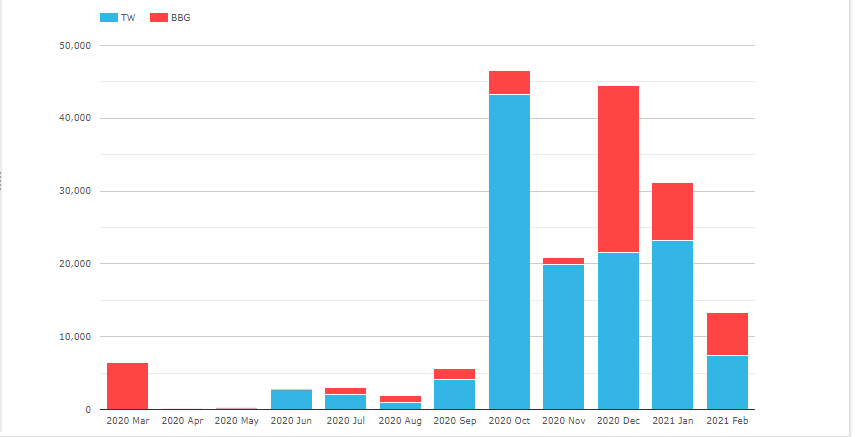
- Material and regular volume from Oct-20 onwards at both Tradeweb and Bloomberg SEFs
- Though Feb-21 was far from a record month
Turning to D2D SEFs.

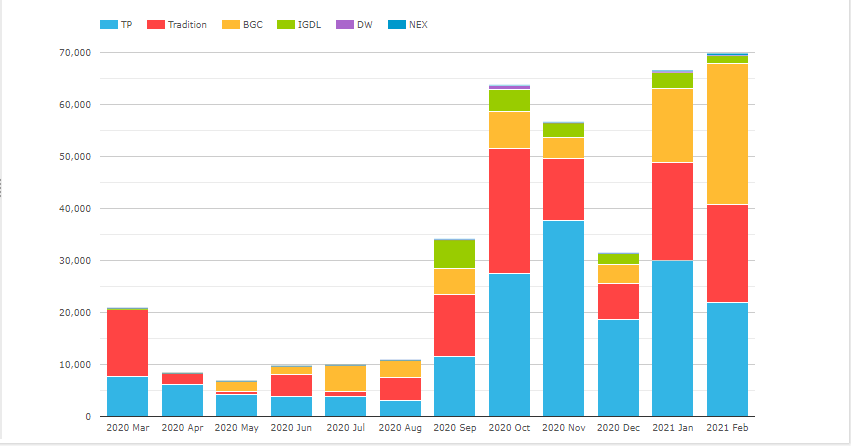
- A sharp increase from Sep-20 onwards
- Feb-21 a record high with $70 billion, of which $38 billion was Basis and $32 billion OIS
- TP with the highest in Basis with $22 billion in Feb-21
- BGC with $6b in Basis and $21b in OIS, the highest overall in Feb-21
- Tradition and TP also with OIS volume in the month
Across both D2C and D2D Venues, in Feb-21 we see $39.5 billion of Basis Swaps and $32 billion of OIS, a total of $83 billion reported (or more precisely identified by us from product descriptions published by SEFs that can leave something to be desired…).
In SDRView, the equivalent On SEF volume aggregates to $44.6 billion of Basis and $37 billion of OIS, a total of $81.8 billion.
As SDR volume cannot be higher than SEF (capped notional rules), there is something in-consistent in the OIS data; either we have failed to identify all the SOFR volume from SEF reports or there is in-consistency in reporting between SEFs and SDRs. A topic that we will dig deeper into and update this blog when we do.
For now what is important is that while SEFView and On SEF from SDR show the above figures for SEF volumes, we see in SDRView much higher volumes for Off SEF; $55 billion for Basis and $120 billion for OIS.
Anyone ready and willing to make a MAT determination for SOFR Swaps?
That’s It
That’s all I have time for today.
Clarus Data Products provide insights into SOFR derivatives, both Futures and Swaps.
Each of CCPView, SDRView and SEFView provide important insights.
If you don’t already subscribe to these, please contact us.