- An update to SOFR Futures and Swaps – May 2020
- Volume and Open Interest in SOFR Futures is down
- Swaps Volume also down, but OI is up
- US persons data shows activity recovering in June
- SEF volume remains much lower than Off SEF
- Clarus Data Products provide more insights
Volumes and Open Interest
In CCPView we can view both volume and open interest by month.
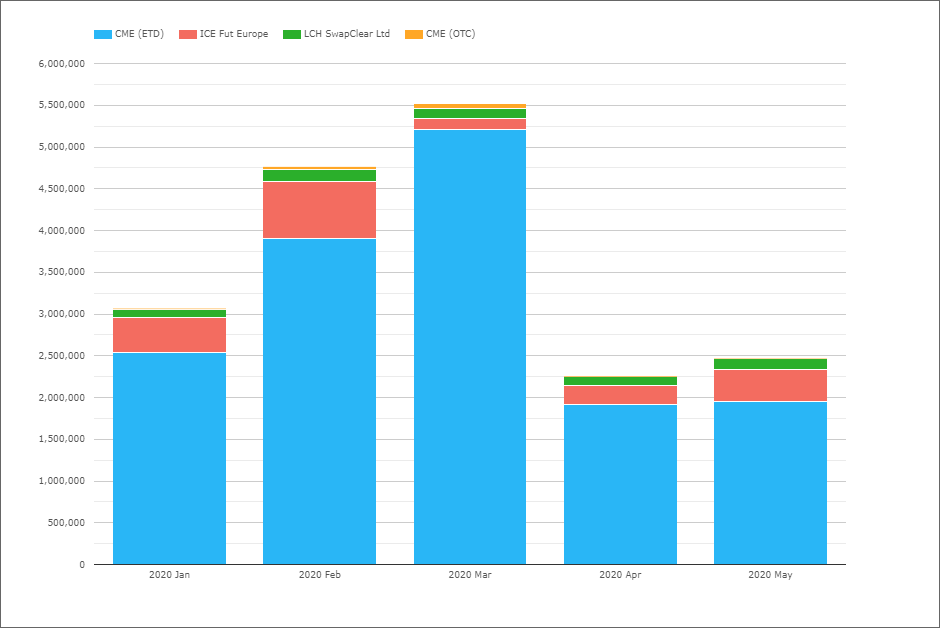
- Showing a marked fall-off in volumes after the record high in March
- May with total volume of $2.47 trillion (June figures not yet available)
- CME ETD with $1.96 trillion of SOFR Futures in May
- ICE Futures with $0.38 trillion
- LCH SwapClear with $129 billion single-sided Swaps notional
- CME OTC with $7 billion single-sided Swaps notional
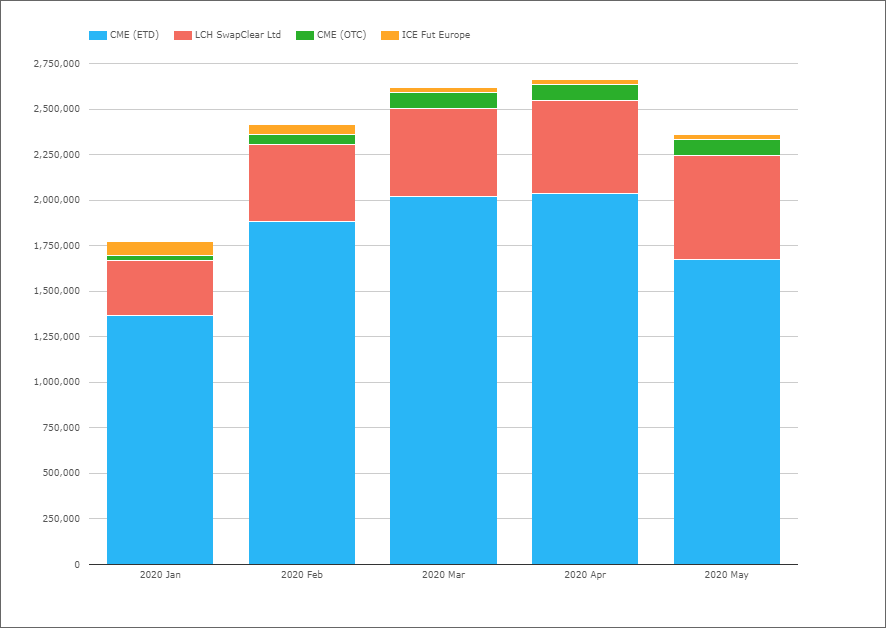
- Showing for the first time in 2020 a drop in Open Interest at a month end
- CME Futures OI at $1.675 trillion at end May, down from $2 trillion
- LCH SwapClear OI at $570 billion (single-sided) up from $509 billion
- CME Swaps OI at $86 billion (single-sided), similar to prior month
- ICE Futures OI at $29 billion, similar to prior month
In summary we had a strong increasing trend in both volume and open interest up to end March, both a Futures roll month and the peak of the Covid-19 Crisis. However April and May have been quiet months with Futures OI down at end May, while Swaps OI still up.
It will be interesting to see what June 2020 volumes show and while we do know that SOFR Futures OI at end June is still similar to end May, we don’t have definitive information on Swaps.
Swaps Trading
In SDRView Res, we can see US persons trading activity, trade counts, notional or dv01, up to June 30th.
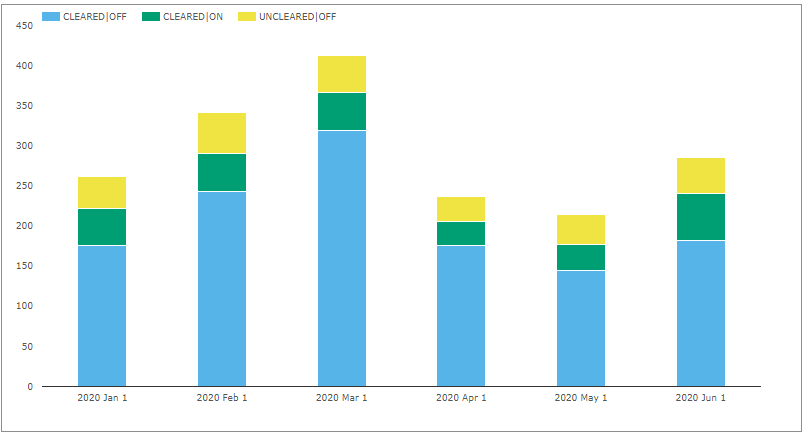
- The data here presents a mixed picture
- Trade counts (shown in the chart) are up to 286 trades in June, compared to 214 in May
- Notional is down for Cleared (not shown in the chart)
- DV01 is up for Cleared and significantly so for On SEF
Product wise, we see more OIS trades than Basis but in Notional or DV01 terms the share is pretty even.
In SDRView Pro, we can combine volume, tenor and price views.
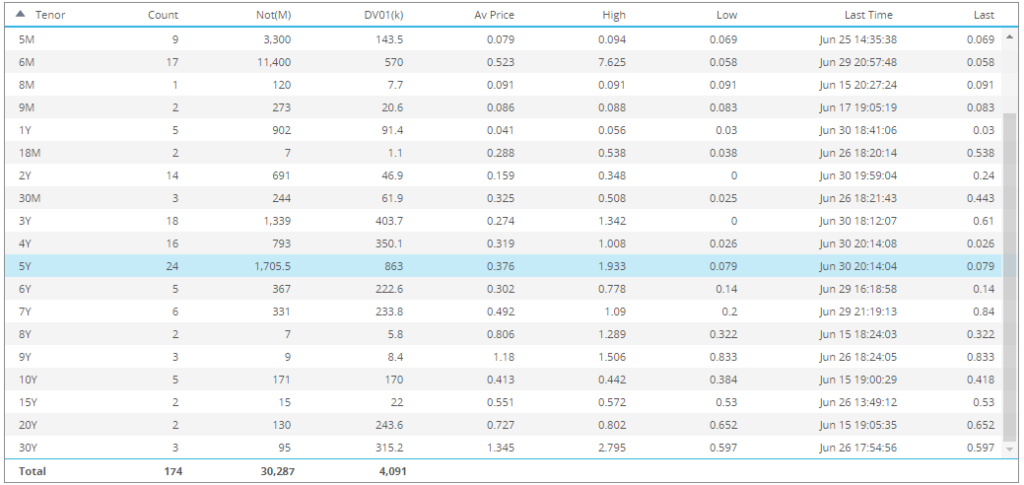
- Showing 5Y the most common tenor with trades out to 30Y tenor
Swap Execution Facilities
While On SEF volume remains much less than Off SEF, let’s see which SEFs have volume.
In SEFView we isolate SOFR vs FedFunds Basis Swaps at D2D SEFs.
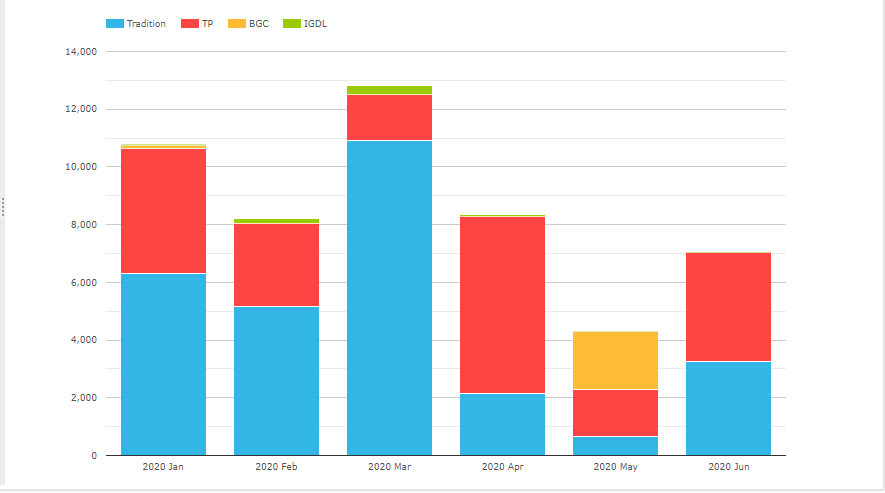
- Tradition the largest with $28.5 billion YTD
- TP next with $20.4 billion YTD
- BGC $2.1 billion and IGDL $610 million
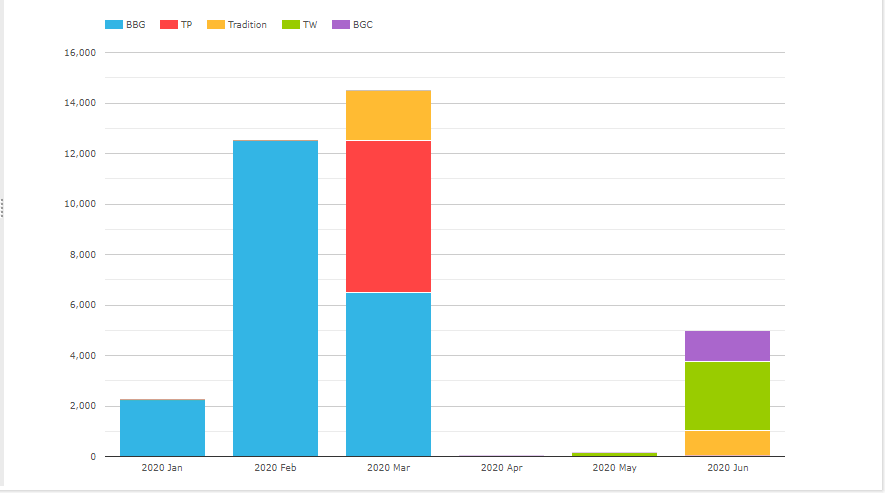
- Bloomberg the largest with $21.3 billion YTD
- Tradeweb with $2.7 billion in June (after first showing in April)
- Ad-hoc volume from the TP, Tradition and BGC
That’s it
That’s all I have time for today.
Clarus Data Products provide insights into SOFR derivatives, both Futures and Swaps.
Each of CCPView, SDRView and SEFView provide details.
Please contact us for more in-depth analysis.