I read last month with interest the report on the Australian OTC Derivatives Market issued by the Council of Financial Regulators (which includes Australian regulators APRA, ASIC, RBA and The Treasury). The full report of which can be found here.
Given we already know a lot about the Trade Reporting and Central Clearing developments, I was interested to see what their assessment was around market readiness or the need for a trading mandate. The recommendation was effectively “no current action required” and this appears very appropriate at this stage for the Australian market. They indicate ongoing monitoring of offshore regulation and changes in domestic activity. All valid and sensible responses.
The data referenced as part of their assessment did leave me a little underwhelmed in terms of detail and approach though. You can only analysis what you have access to and that seems to be the key issue. It’s a pity greater strides to follow the US regulatory model of greater OTC Derivatives public data transparency haven’t happened in Australia.
I was keen to do my own take on the AUD $ IRD market in terms of On-Platform versus Off-Platform trading under the basis of this market transparency existing, as it does across US market participants. So using a combination of SEFView and SDRView provided by Clarus, I delved into the AUD IRD activity available. Remembering the sources available to the regulators versus Clarus across the AUD $ IRD market is somewhat different, so this wasn’t a validation or correction agenda.
Regulator Analysis
- DDRS – Singapore based DTCC Swap Data Repository
- Survey across Domestic and foreign dealers (est 12-13)
- Survey across voice brokers and trading platforms
- Estimate that 90% of positions at the DDRS held by respondents to the survey
Clarus Analysis
- SEFView – US SEF registered platform reporting data
- SDRView – CFTC publically available data from DTCC, ICE and Bloomberg Swap Data Repositories
In terms of the regulators view on AUD $ IRD trading approaches, it was summarised by a fairly simple graph that shows the average daily number of transactions traded across trading venue per dealer surveyed (including voice, sms, email etc under other venues). There appear to have been 12-13 dealers as part of the survey based on the overall numbers provided and final per dealer per day volumes.
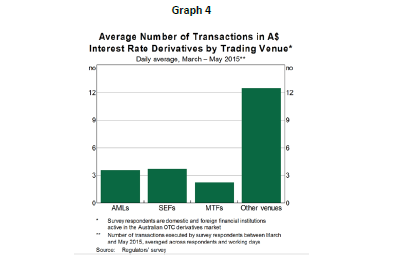

The graph indicated slightly over 3 trades per day, per dealer in AUD $ IRD products were done via a SEF. Which represented 14% of trades being On-SEF.
It’s noteworthy that another 25-30% appears to be traded electronically via Australian Market Licence holders (AMLs) such as YieldBroker or MTFs. So the market share of electronic trades versus non electronic at around 45% versus 55% is perhaps a better way to view it.
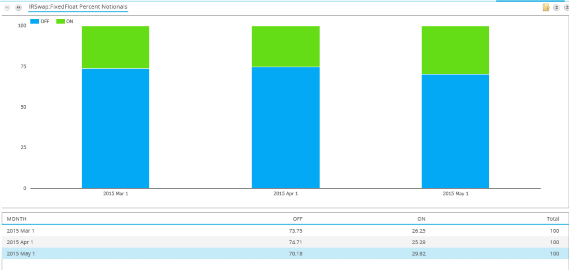
I wanted to use SDRView to see if looking at the data available in different ways could alter perceptions. We can easily see the percentage of trades done On or Off-SEF based on CFTC reported data to SDRs. Taking the AUD $ IRS Fixed Floating Product type we firstly look at the breakdown based on Notional Value which might have more merit than trade count.
During same period of Mar 15 and May 15 the range was 70-74% Off-SEF traded and 26-30% On-SEF

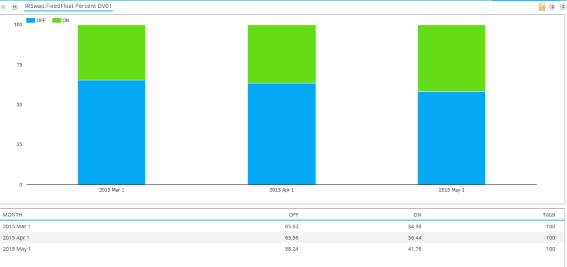
Alternatively if looking to transfer more trading risk onto platform trading, then perhaps analysing by DV01 would be another way to approach this. So using the same data set and generating the output as a percentage Off and On-SEF by DV01 provided an Off-SEF range of 58-65% traded to On-SEF percentage of 34-42%. Significantly higher than the 14% identified by the Australian regulator for their Survey sample.

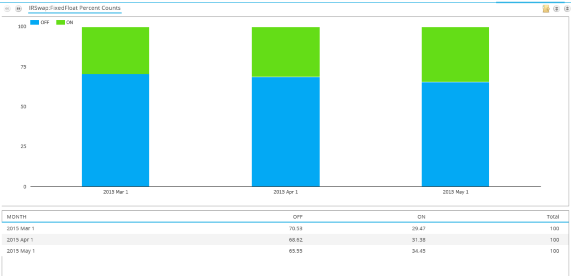
Finally, I wanted to simulate something similar to the regulators trade count view. So I ran the same criteria but looking at the percentage by trade count. Again you have a different percentage breakdown with the Off-SEF traded range at 66-71% and On-SEF at 29-34%

The increased % of SEF traded AUD IRD based on the data reported to the CFTC is to be expected, as it captures the trends of firms reporting under CFTC requirements who are also subject to mandatory trading rules on G4 Currencies using SEFs. Just as the Australian regulator noted that their surveyed dealers would tend to trade a larger % of G4 currency trades On-SEF due to counterparties being required by regulation to do so.
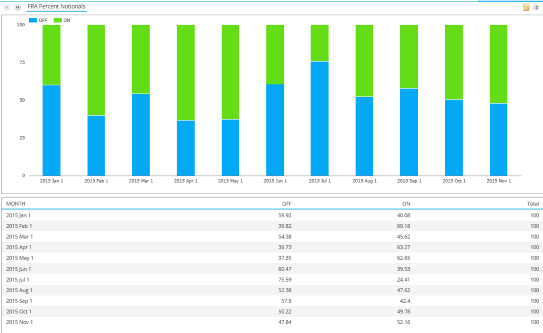
We could run the SDRView analysis for each AUD IRD product type and for an extended time period to check for any trends or ensure consistency or abnormalities. A 3mth period for the survey seemed to be fairly short. Beside the below example across AUD FRA, which shows some of the inconsistency when time period is extended, I’ll spare you the chart overload across all.

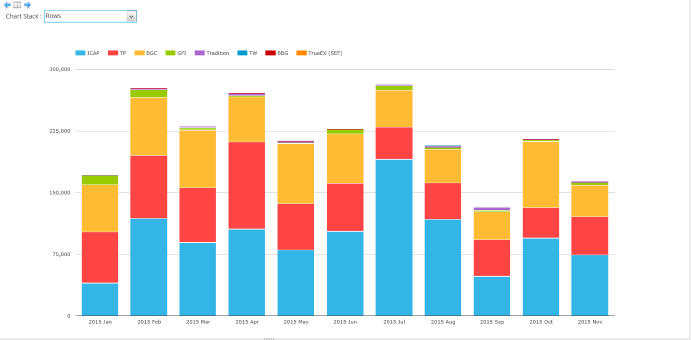
Finally since we are SEF focused, I thought it would be interesting to see who has the SEF market share currently across AUD IRD. The below charts from SEFView can give us a good look at this.
Taking a month on month view from 1 Jan 15 through to 30th Nov 15, market share varies across three main SEFs in ICAP, Tullet Preben and BGC. For the entire year to date volumes, ICAP account for 44% of market share with TP and BGC both around 26%. With the recent announcement of Tullet and ICAP deal, they would seem about to become the dominant SEF platform for AUD.

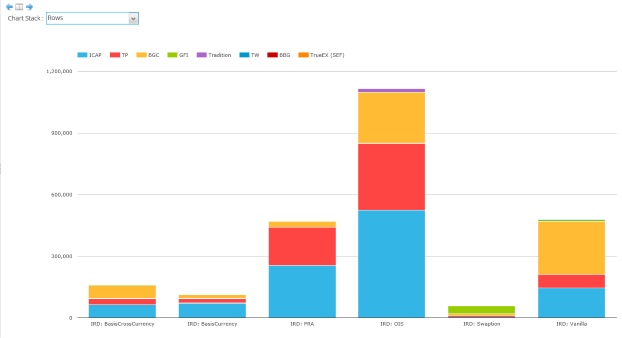
That market share split again changes though if you break it down by product. The below charts is also for the calendar year, but with the consolidated view of notional volume by product and SEF.

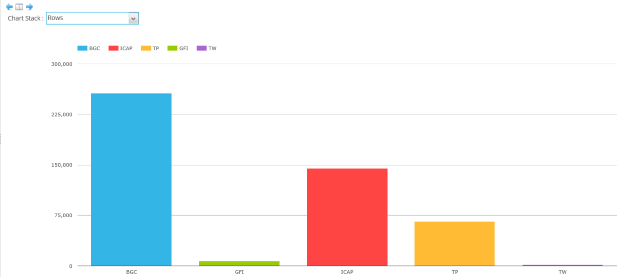
If you strip various product types out the chart to just look at Vanilla AUD IRS, then things change a little with BGC being ranked 1 by notional traded and ICAP and Tullet coming 2nd and 3rd and even when combined still being slightly below BGC.

The Australian regulators have done a pretty solid job navigating the challenges of regulating for it market participants that interact significantly with global markets. Dealing with the US-EU cross border issues are somewhat tricky given the need for larger Australian institutions to operate within these markets as well as their local jurisdiction. The main mantra has been to be a “close follower” in regulation and ensure cross border equivalence. One key approach has been to ensure they have a senior seat at most of the global industry group tables
So what else does the latest report tell us?
- The Australian regulators do a significant amount of assessing other jurisdiction activities
- Trade Reporting is mostly done after a number of amendments, class exemptions and Single-Sided reporting for Phase 3B firms
- Regulators globally are still trying to work out what is being reported and how best to use it
- There won’t be other currencies added anytime soon to AUD and G4 currencies already part of the upcoming Clearing mandate
- Intend to implement BCBS-IOSCO margin requirements and risk mitigation standard through APRA’s prudential standards initially. Effecting APRA regulated institutions only in the first instance (with consultation early 2016)
- Legislative changes required to facilitate exchange of margin by way of security interest and for super and life companies for posting margins
Conclusions
- Kudos to the Australian regulators on their OTC Derivative Reform approach to date and interplay with global regulators
- Greater publicly available data would not just assist Australian market participants, but also its regulators in assessing the market and making market reform recommendations
- There is little benefit right now in Australia having a trading mandate, but there is still reasonable support for registered platform trading in general
- SEF market share for AUD IRD is currently dominated by 3 main SEFs being ICAP, Tullet Preben and BGC
This article is authored by Neil Fletcher.