- We look at data from the BIS on Uncleared IRS.
- Notional Outstanding of Uncleared derivatives has been constant for the past year.
- The Gross Market Value of these derivatives has decreased by around 40%.
- The reduction in market value seems to be related to rates moving higher.
- Both Cleared and Uncleared markets have seen large decreases in gross market value.
In an age of Clearing Mandates (2017), Regulatory Reforms (MIFID II) and Uncleared Margin Rules (ISDA SIMM) we may be tempted to anticipate the inevitable demise of uncleared markets. We certainly don’t write about them much on this blog.
However, that isn’t the case. There will always be derivatives that are not cleared (see the small volumes in Swaptions or the lack of a cross currency swap solution). There will continue to be legacy trades. There are also counterparties exempt from Clearing Mandates.
Even for counterparties captured by market reforms, there are plentiful reasons why old trades are not back-loaded – valuation differences, funding concerns and initial margin management for example.
The volumes of vanilla uncleared trades reported to SDRs is pretty insignificant these days – less than 3% of volumes, as we’ve looked at previously:
Is this same behaviour repeated when we look at other sources of data?
CCPView Data as the Golden Source of Cleared Volumes
We have previously analysed the different sources of BIS data, and concluded that we prefer our CCPView data for cleared markets, but that BIS data on uncleared markets is the go-to source.
With this in mind, I took a look at the latest semi-annual review from the BIS. This includes data as at end of June 2017. The short-overview is here.
As we’ve looked at with Compression and Initial Margin optimisation recently, it pays to actively manage Notional Outstanding. Notional Outstanding across Rates products has seen a rollercoaster ride recently:
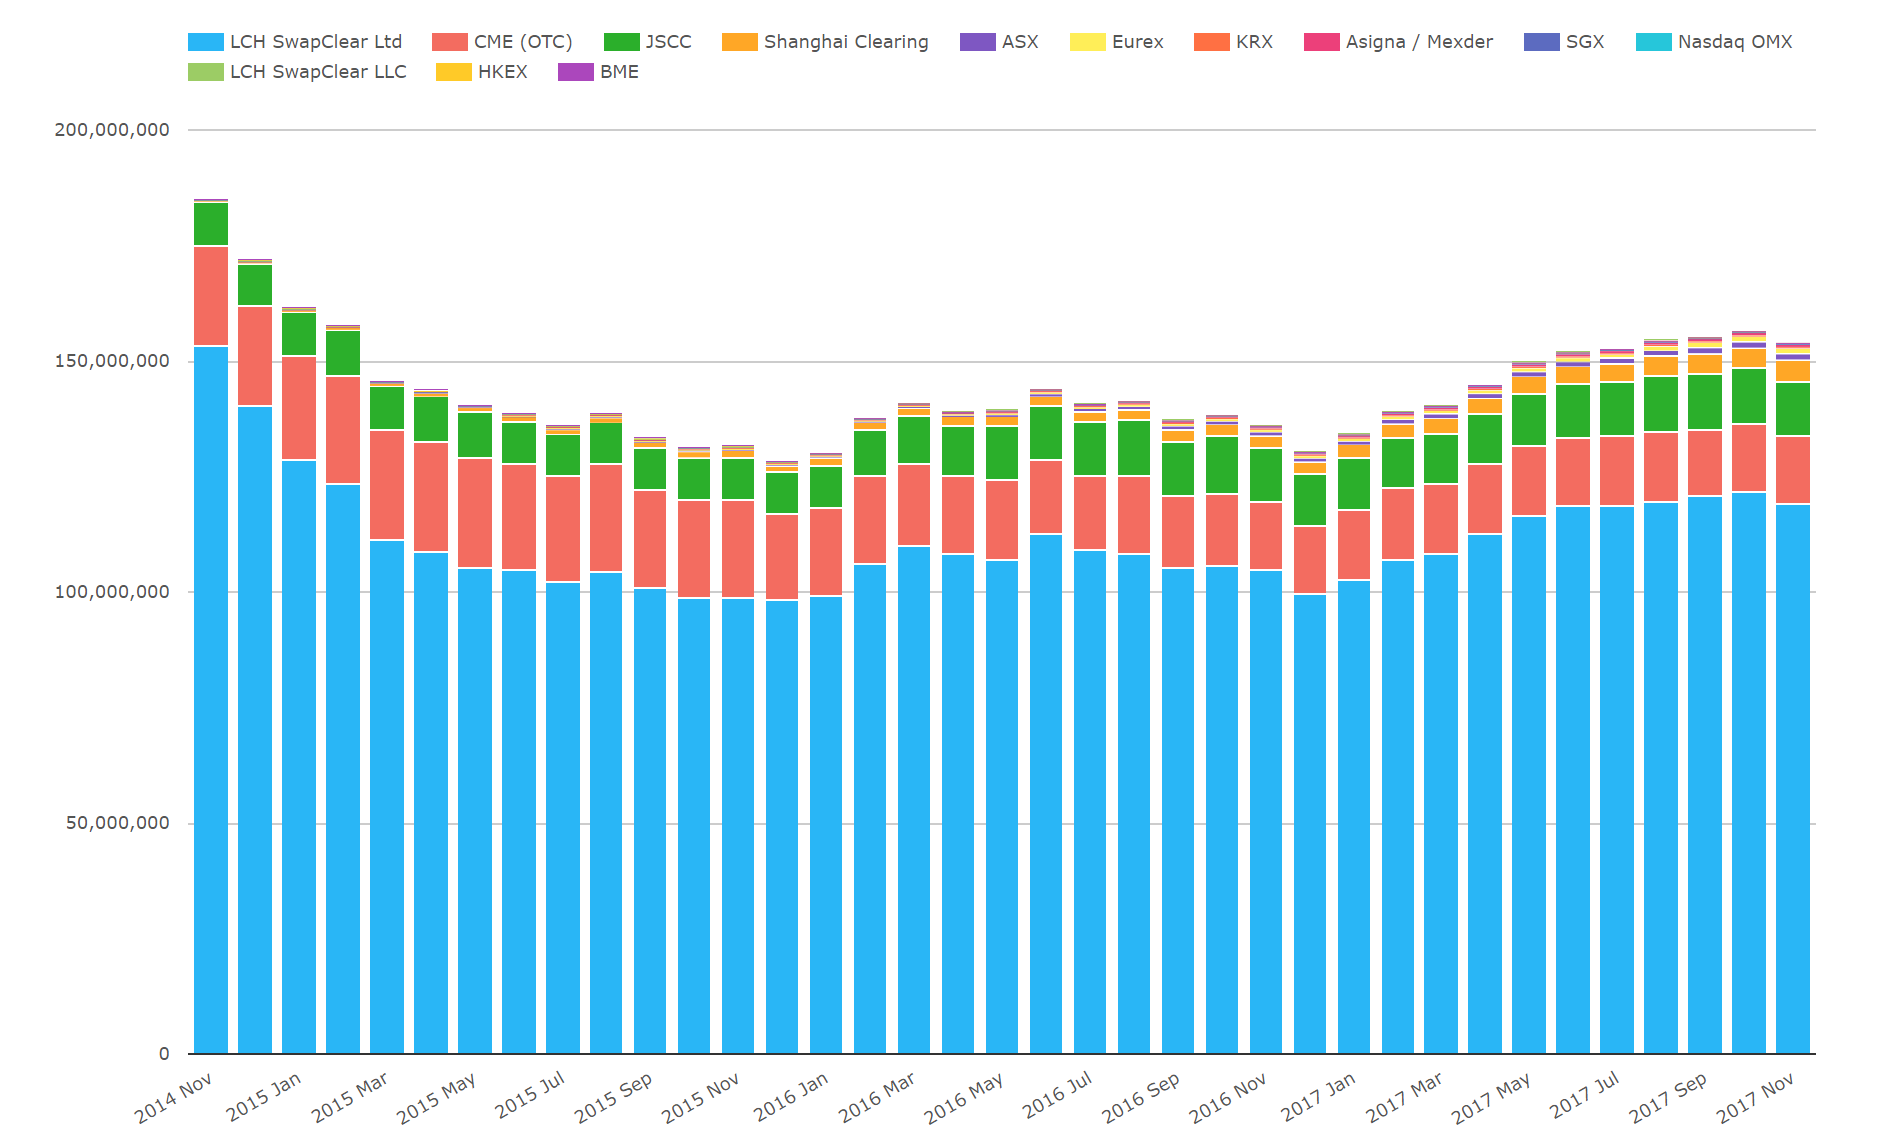
Showing;
- Notional outstanding for IRS, OIS, Inflation, rollercoasters, zero coupons and Basis swaps from CCPView.
- This is the CCPView data I will use to replace anything that the BIS have labeled as facing a “Central Counterparty” in their semi-annual survey.
- Compression is evident in this data – a large reduction of 30% occurred between November 2014 and January 2016.
- Notional outstanding has since increased. It suggests that the low-hanging fruit for compression has been targeted.
- We looked at the relationship between these notionals outstanding, client volumes and initial margin recently.
Combining Clarus Data and BIS Data
BIS have reported data versus Central Counterparties since June 2016. That doesn’t provide a comprehensive time-series of derived data for uncleared markets. However, working with what we’ve got, we can look at the past 12 months, via two charts:
![]()
![]()
Showing;
- The top chart shows Cleared Notional Outstanding from our CCPView data, re-stated onto the same scale as Uncleared Notional Outstanding from BIS (bottom chart).
- Both sets of data have been relatively static for the past year.
- Uncleared notionals have shrunk by less than 10% since last year. They grew moderately between December 2016 and June 2017 – maybe as a result of FX moves?
- The volatility in Notional Outstanding for cleared trades is much greater than for uncleared trades. This could be down to a different maturity profile, compression or sensitivity to new business activity.
- My guess is that not much OIS activity is captured in the remaining stock of uncleared trades. OIS tend to be large notional, short-dated trades, therefore we should see some volatility in uncleared notional outstanding if these types of trades were significant.
- And compression? We know that compression is very active in cleared markets, and serves to keep a lid on notional outstanding amounts. We assume that there is far less compression in uncleared markets. We certainly don’t see a reduction in notional outstanding. Remember this is purely for vanilla, fixed float interest rate swaps.
More Data – Gross Value
And now for something completely different. The BIS also include the Gross Market Value for these trades. I take this as a (close proxy) for the mark-to-market of the trades. In theory, any compression (or compaction) should result in large reductions in Gross Market Value. What does the data show?
![]()
![]()
Showing;
- The Gross Market Values of Cleared (top chart) and Uncleared (bottom chart) from the BIS data. Both charts use the same scale for ease of comparison.
- The “mark to market” of outstanding derivatives positions versus Central Counterparties has been crushed in the past twelve-eighteen months. It nearly halved in the last six months of 2016 (a 43% drop equating to $4trn!).
- What is driving this? Instinct says Compression/Compaction. No-one wants to leave PVs tied up in cleared positions when you have to post margin against it anyway…..
- ….but the Notional Outstanding did not show a large reduction.
The BIS also focus on this point in their recent commentary and state:
These declines likely reflected increases in long-term yields, which reduced the gap between market interest rates on the reporting date and rates prevailing at contract inception.
Reinforcing the BIS’s point, we also saw a drop in Uncleared Gross Market Values – even as notional outstanding stayed fairly constant. Mark to markets of uncleared derivatives are 37% lower over the year (which is $2trn in absolute value).
We don’t have enough data to draw solid conclusions from these reductions, but I think it is worth monitoring these numbers going forward. There has been a lot of recent press regarding Settle to Market contracts. These contracts settle outstanding PVs versus a CCP every night. I imagine this also drops the PV to zero each night? So we could see large changes in this survey data in the coming months.
Has Much Really Changed?
I don’t think so. I’m not convinced that we can read too much into any market structure changes, success of clearing mandates, impact of uncleared margin rules on old trades etc from this data.
For example, the ratio of uncleared to cleared mark to markets has been static over the past year:
![]()
This suggests that both markets react almost hand-in-hand to the same economic drivers – i.e. Rates move up, contracts get closer to par, whilst total notional outstanding has been consant. I suppose this shouldn’t be a surprise as (largely speaking) uncleared trades will be hedged by cleared trades.
In Summary
- SDR Data suggests that Uncleared markets see little new trading activity.
- Notional Outstanding of uncleared trades has been constant for the past year.
- The gross market value of both Cleared and Uncleared positions has decreased by around 40% in the past year.
- These Gross Market Values have moved hand-in-hand between both Cleared and Uncleared positions.
- Compression still appears to have a lot of work to do in Uncleared markets to shrink legacy portfolios.