This blog looks at another year of AUD swaps activity, continuing from the blog with a similar title published at about the same time last year.
Should you want more information on AUD swaps, the blog linked above contains links to several other blogs on the topic.
AUD market total size
First, we extend the total market size chart. This covers almost all global cleared swap trading activity – both listed and OTC.

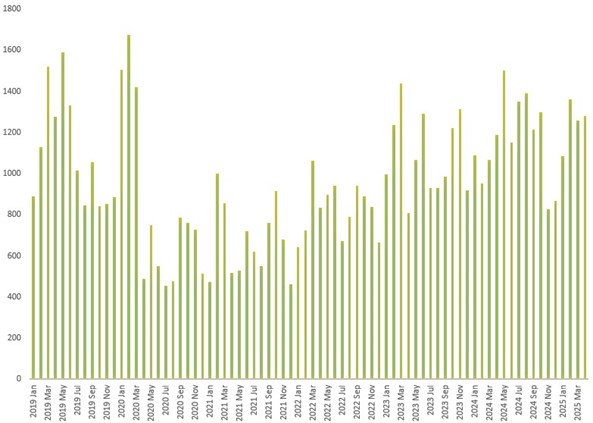
Chart 1: Month-by-month global market size of AUD cleared derivatives (gross trade DV01 $ millions). Source: CCPView
Chart 1 shows:
- The Covid-19 high above $1.6 billion in February 2020 remains unsurpassed, while the remaining months of 2020 and all of 2021 averaged around $650 million.
- 2022 averaged $800 million each month, and 2023 averaged around $1.1 billion.
- 2024 rose to a peak of $1.5 trillion in May 2024 and ended with lows around $850 million in November and December.
- 2025 began above $1 billion in January and was above $1.25 billion from February onwards.
Cleared AUD swaps
Next, we look at cleared OTC activity in AUD swaps.

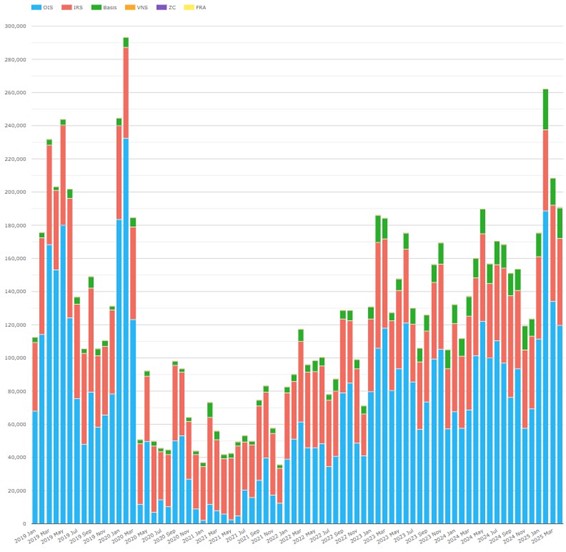
Chart 2: Month-by-month average daily volume (ADV) of cleared AUD swaps (notional $ millions). Source: CCPView
We can see from Chart 2 that:
- February 2024 ADV of over $260 billion was the highest of any month since the February 2020 Covid-19 peak of around $290 billion.
- Without a mandated transition off BBSW on the horizon, AONIA OIS recently saw higher notional volumes each month than BBSW IRS.
Now, we look at the cleared swaps share by product.


Chart 3: Month-by-month cleared AUD swaps product share (percent share of gross trade DV01 notional $ millions). Source: CCPView
After AONIA OIS DV01 settled just above 30 percent in early 2024, in the last post we asked “Will this be the ’new norm’ going forward?” Chart 3 shows:
- The market answered “No.” AONIA OIS DV01 immediately jumped to just shy of 50 percent in April 2024.
- January to April 2025 has seen the highest AONIA OIS shares yet, reaching 68 percent of cleared AUD swaps DV01 in February 2025 and remaining above 50 percent since.
CCPView also shows that AUD AONIA OIS trading remains dominated by 2-year tenors, with no hint of adoption for longer tenors in preference to BBSW IRS. Therefore, recent increased AONIA shares are likely to have been short-term volatility driven.
The cash rate
Now, we keep an eye on RBA actions on target interest rates.

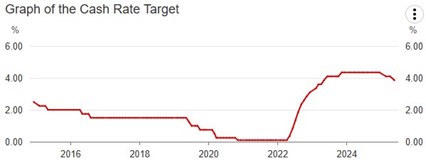
Chart 4: RBA cash rate target. Source: RBA.
We observe in Chart 4 that:
- After sharp rises in 2022 and 2023, the target cash rate was steady at 4.35 percent throughout 2024.
- In 2025, the RBA made its first cuts since early 2020, with quarter-point cuts on 19 February 2025 and again on 21 May2025. Alongside the May announcement, the RBA cited lower inflation risk but increasing global uncertainty, which has led to a weaker outlook for the Australian economy.
AUD swaps CCP share
CCP market share tends to be steadier than absolute volumes, being governed by established trading behaviors rather than market volatility.

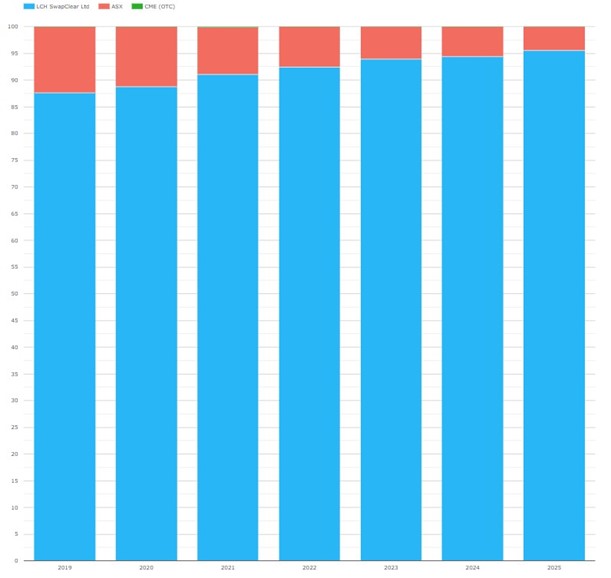
Chart 5: AUD cleared swaps CCP share of (notional $ millions). Source: CCPView
We see from Chart 5 that:
- Each year, there was a consistent, small market share shift from ASX to LCH SwapClear.
- In 2024, LCH had 94.4 percent to ASX’s 5.6 percent.
- Note that the 2025 bar show the year to end April only. If the full year matched this period, LCH’s 2025 market share would be up another 1.2 percent or so.
We continue to wait for LCH’s share to peak.
AUD futures
ASX is the main hub globally for AUD interest rate futures liquidity, offering futures on BBSW, AONIA STIRs, and Australian Government Bonds.
CCPView calculates notional equivalents of the ETD contract counts received from CCPs. Since the notional per contract can vary considerably, this makes ETD products and CCPs more comparable, both to one another and to other derivative products.

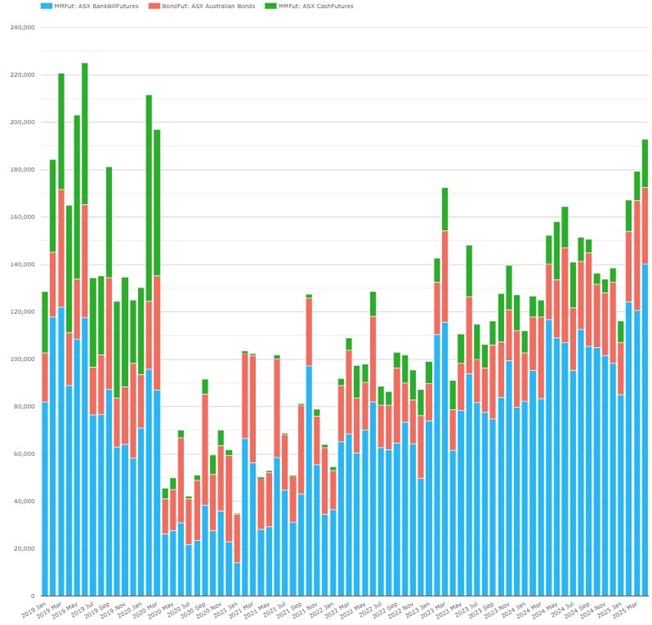
Chart 6: Month-by-month ADV of AUD interest rate futures (notional $ millions). Source: CCPView
Chart 6 shows that:
- At just over $190 billion, April 2025 brought the highest AUD futures monthly ADV since the Covid-19 highs.
- Compared with chart 2 on OTC AUD swaps, ASX AUD futures are of similar volume and show similar volume dynamics over time.
- However, the split between AONIA and BBSW is not aligned:
- BBSW “bills” futures are much larger ADV than the AONIIA “cash” futures (the AONIA future).
- BBSW IRS represent a relative minority of swap volumes compared with AONIA OIS.
I am interested in possible explanations you may have for this difference – please add them to the comments below.
Uncleared AUD products
I do not think it will hurt to take a quick look at uncleared AUD products – starting with AUD interest rate options (comprising swaptions, caps, and floors).

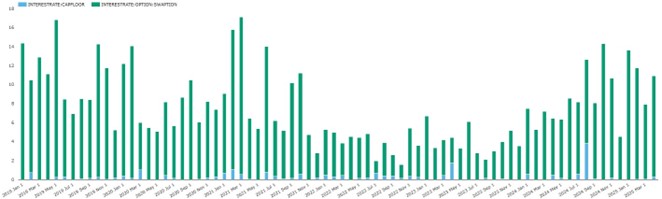
Chart 7: Month-by-month AUD interest rate option volumes (notional $ billions). Source: SDRView
Chart 7 shows that:
- AUD caps and floors are rarer recently than before, but with the occasional monthly peaks – the last at $4 billion in August 2024.
- AUD swaptions had a less pronounced Covid-19 high in February 2020 and a less prolonged immediate lull.
- The recent peak was just shy of $17 billion in March 2021.
- Then there was a lull of around $4 billion per month throughout 2022 and 2023.
- Volumes picked up strongly in 2024, returning to levels approaching the recent peak in late 2024 and early 2025.
And finally, AUD-USD cross-currency swaps, which are covered by the SDR-reporting mandate and therefore SDRView (unlike AUDUSD FX swaps and forwards, which are exempt).

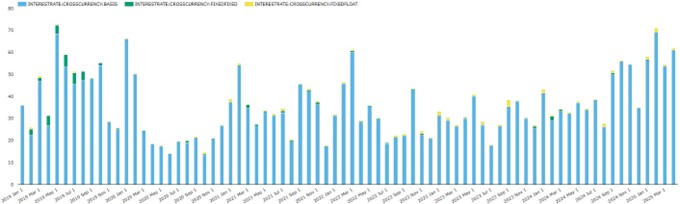
Chart 8: Month-by-month AUD-USD cross-currency swap volumes (notional $ billions). Source: SDRView
Chart 8 shows that AUD-USD volumes are also subject to some of the same macro-highs as the other products, but they have a unique profile.
- Cross-currency basis swaps dominate AUD-USD cross-currency swap volumes with an early 2020 high of $66 billion in January, and a lull for the remainder of 2020.
- Early 2025 returned to similar levels as February 2020, peaking in February 2025 with $71 billion notional traded.
In summary
- Early 2025 activity approached previous peaks in AUD interest rate derivatives, both for cleared swaps and futures; and for uncleared AUD swaptions and AUD-USD cross-currency swaps.
- Month-by-month ADVs of cleared AUD swaps surpassed $200 billion in early 2025 for the first time since the 2020 Covid-19 highs.
- ASK AUD futures also came close to $200 billion month-by-month ADV in early 2025.
- LCH SwapClear continued its trend of year-by-year increases in market share in cleared AUD swaps.
- AONIA OIS materially increased its share of AUD cleared swap risk traded.
Please contact us if you are interested in a subscription.