With so many AUD blogs behind us, I figured it was high time we started adding dates to the titles – otherwise I’ll never remember what I wrote and when! The previous AUD articles are linked below:
- The Latest in Aussie and Kiwi Swap Markets
- AUD SWAP MARKET
- AUD swap market: Concentration risks from the Clearing Mandate
- AUD Cross Currency Swaps
- AUD Swap Markets in August 2017
These blogs are quite enjoyable to write, as it gives me an opportunity to “surf” the data and pull out what is interesting.
AUD Market Total Size
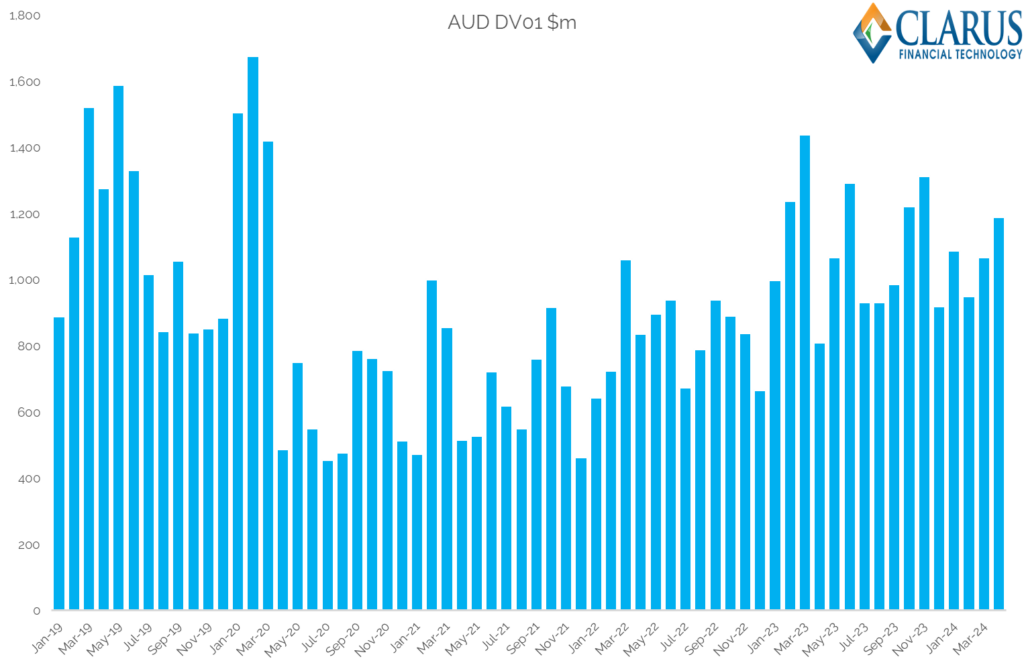
As one of the eight currencies that we monitor in the RFR Adoption Indicator, I have a total DV01 traded in AUD every month going back quite some years. This is for all cleared Interest Rate Derivatives, covering almost all trading activity globally.
Showing;
- Levels of trading activity are really quite volatile in AUD swaps!
- 2019 looks to be the high-point, with some active months reaching (and surpassing) $1.6Bn of DV01 traded.
- This reduced sharpy after COVID to sit at fairly suppressed levels in 2021 and 2022, averaging $750m DV01 each month.
- Okay, that is still a LOT of risk, but it is notable that activity picked up again in 2023, averaging $1.1Bn DV01 each month.
- That has continued into 2024, with $1.04Bn average monthly DV01 in Q1.
CCPView Data for AUD Swaps
Looking into cleared OTC activity in AUD swaps;

Showing;
- Average Daily Volumes in $m equivalent (notional amounts) for AUD OTC cleared Interest Rate Derivatives.
- In April 2024, ADVs were $160bn.
- There is no mandate to move away from the term rate, BBSW, in AUD. So both AONIA OIS and BBSW IRS continue to trade.
- The split by product type shows that OIS still see higher notional volumes each month than IRS.
- In terms of the amount of risk traded, our DV01 metrics from the RFR Adoption Indicator show that the proportion of risk traded as an OIS is fairly volatile…..
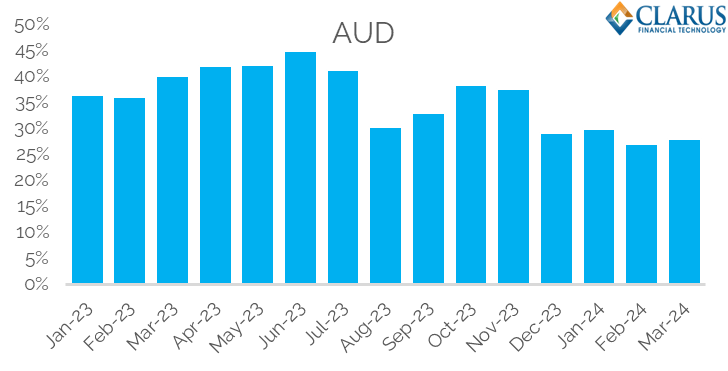
- …but AONIA has consistently made up ~30% of traded volumes for the past four months. Will this be the “new norm” going forward?
As a reminder, the history of the RBAs Target Rate shows there were rate cuts well before the Pandemic as the Aussie economy was already headed for recession. Rate hikes began in the middle of 2022.

ADVs have now stayed above $100bn since September 2022 (aside from a brief dip in Dec 2022). This is a long way from the subdued trading we saw in 2020/21 and most of 2022.
EUR markets are now larger than USD (see here). As USD (and many others!) have transitioned to an RFR (SOFR) world, there are fewer indices to trade and hence total volumes have decreased somewhat. For AUD markets, there is no sign of an RFR-transition happening, but it doesn’t preclude us from thinking about where AUD markets would be in terms of volumes if everything was just traded versus AONIA (rather than 3s1s, 3s6s, BOB swaps etc). The Basis swap volumes are relatively small, but multiple indices tend to result in larger volumes overall.
There are two CCPs in AUD Swaps
Total volumes have seen some large differences year-on-year, but the CCP market share is more steady. Both ASX and LCH SwapClear see regular volumes in AUD swaps, and CME see occasional trades.
Since 2019, LCH SwapClear have gained a little bit of market share year-on-year, but it is not a spectacular difference:

Is a 6% move in market share note-worthy? Probably not when market shares are swinging around, but maybe the fact that these are gradual, year-on-year gains suggests a particular change in market behaviour? It would be an interesting one to unpack.
Interestingly, there appears to be no established practice of AUD CCP basis trading (trading on the spread between CCPs). We invite any market participants engaged in ASX vs LCH switches to share their insights in the comments section below.
AUD Futures
Australian markets benefit from a relatively deep pool of futures liquidity – across BBSW and AONIA STIRs, plus Australian Government Bond futures. These are all traded and cleared at ASX, have Average Daily Volumes in excess of $100-150bn and are hence just as important to AUD Rates traders as OTC markets.

Showing;
- A close alignment between swaps and futures.
- Volume patterns within the futures market closely mirror (and potentially even anticipate) those observed in the swaps market.
- BBSW “Bills” futures represent the largest market by notional amount traded, even during the current rise in the RBA’s cash rate.
- The ASX cash future (the AONIA future) has not captured as much market share during this period as it did during the RBA’s rate cutting cycle in 2019. This aligns with observations in the OTC AONIA swap space.
- Further investigation is required to understand why volumes in AONIA have not returned to previous levels.
In Summary
- ADVs of OTC AUD interest rate derivatives are comfortably above $100bn in 2024.
- Adding in Australian Rate futures at the ASX more than doubles these volumes.
- AONIA-linked volumes make up about 30% of total AUD rates risk traded.
- LCH SwapClear has about a 93% market share in OTC AUD Swaps.