In this article I look at 2019 Swap Execution Facility (SEF) market share for Credit, Foreign Exchange and Interest Rate Derivative asset classes, in a similar format to my 2018 SEF Market Share Statistics.
A brief summary is that 2019 volumes held onto 2018 volumes, a banner year, in both FXD and IRD but CRD volumes were down.
Summary:
Clarus SEFView has daily volume data published by each SEF, which is filtered, normalised and aggregated to allow meaningful comparison of market share statistics.
Onto the charts, data and details.
CRD Volumes and Share
Starting with Credit volumes by currency for each month.

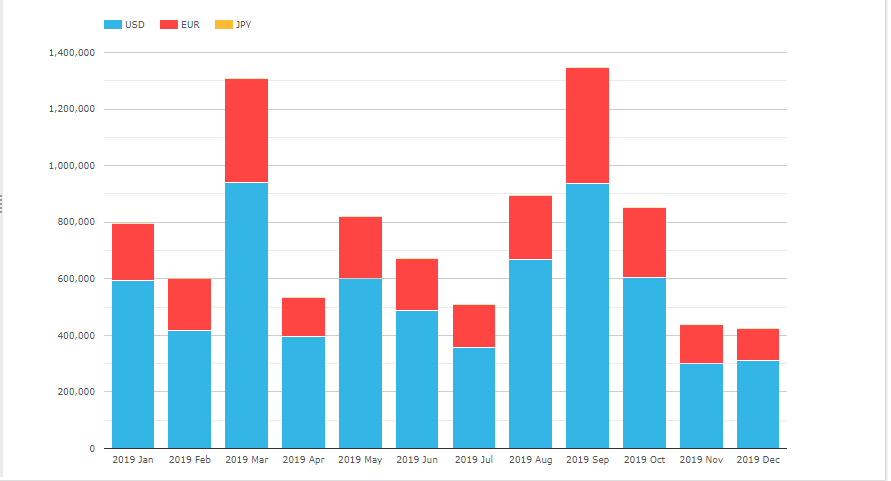
- USD is the largest (CDX.NA.IG, CDX.NA.HY, CDX.EM)
- EUR is next ( iTraxxEurope and iTraxxEuropeCrossOver)
- (Recall CFTC SEF rules govern CDS Index not Single-name, so the latter are not included)
- USD volume in 2019 was $6.6 trillion, down 4% from $6.9 trillion in 2018 ($4.3 trillion in 2017)
- EUR volume in 2019 was $2.6 trillion, down 25% from $3.45 trillion in 2018 and the same as 2017
- Mar (rolls), May, Aug, Sep (rolls), Oct were the highest volume months
- Nov, Dec with subdued volumes
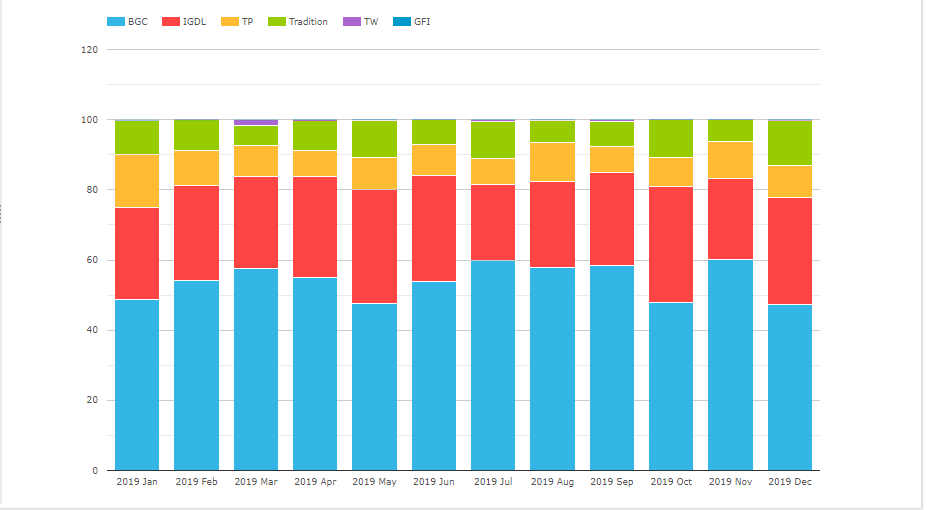
Next lets look at a chart of market share in percent by gross notional for SEFs.

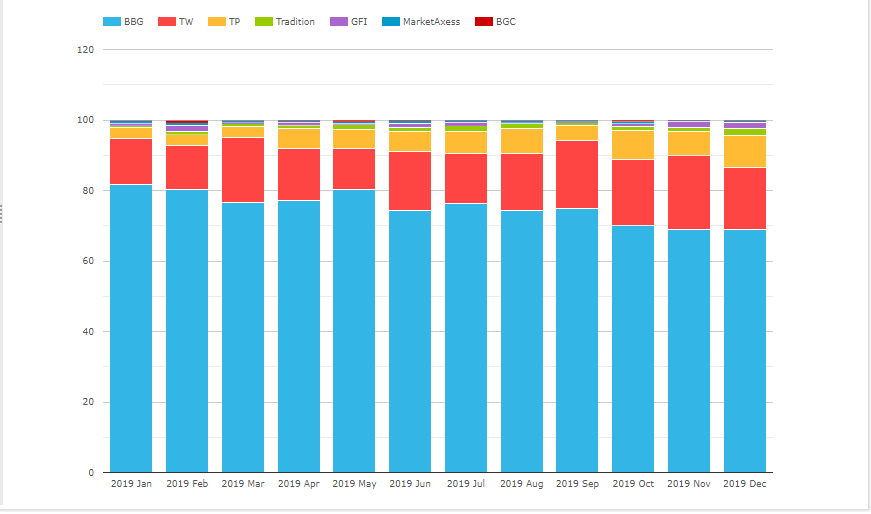
- Bloomberg with a commanding share of 75.7% for the year,
- But trending down in the 4Q 2019 and down from 80% in 2018
- Tradeweb is next with 16.4%, up from 14% in 2018
- Tullet with 5.3% is up from 3.6% in 2018
- Tradition with 1.1%, is up from 0.7%
- GFI with 0.8% is down from 0.9%, 1.9%, 2.6% in prior years
- MarketAxess with 0.5% is down from 0.9%, 1.3%, 1.8% in prior years
- In USD, Bloomberg has 75.2% share and Tradeweb 14.7%
- In EUR, Bloomberg has 76.7% and Tradeweb 20.9%
- In JPY, Tradition has 62% and Bloomberg 38%
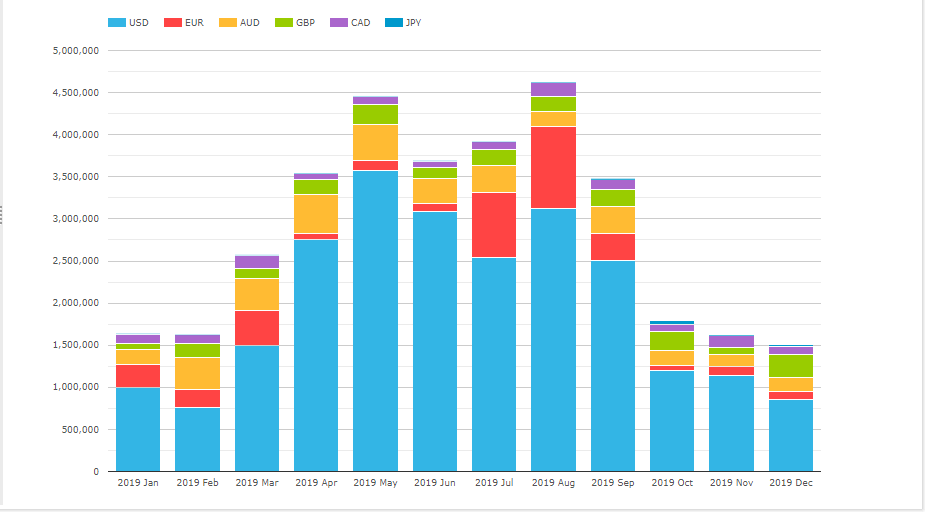
Next a chart of Currency and Product Type for 2019.

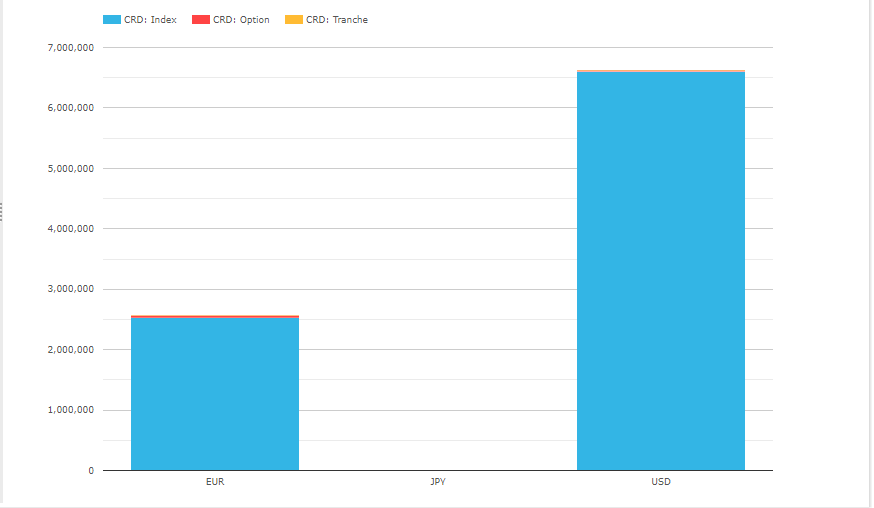
- EUR Index volume is $2.5 trillion, Option is $42 billion and Tranche is $270 million, compared to 2018 volumes of $3.4 trillion, $24 billion $360 million respectively
- USD Index volume is $6.6 trillion, Option is $19 billion and Tranche is $410 million, compared to 2018 volumes of $6.9 trillion, $33 billion and 400 million respectively
- JPY Index volume is just $74 million
And finally for Credit a chart of volume by Index for the current on the run series.

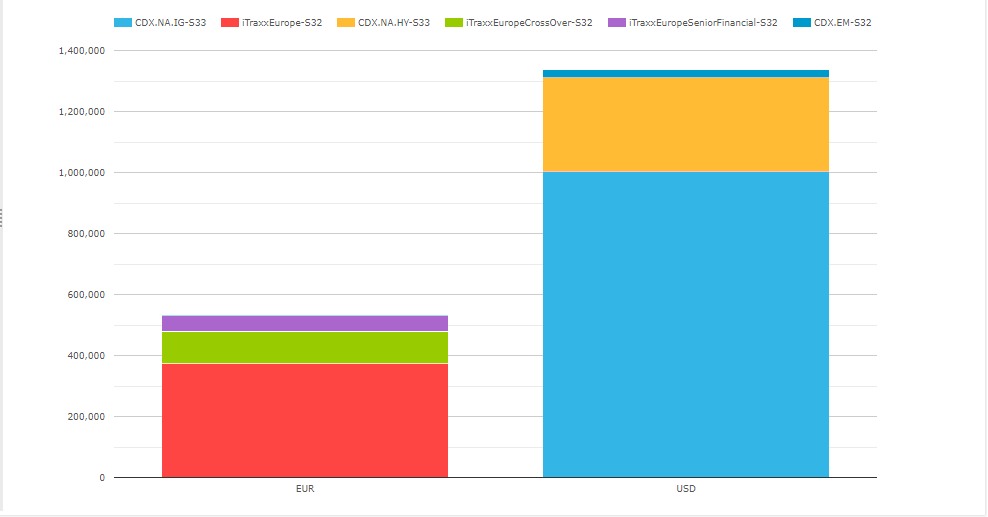
- CDX NA IG S33 is by far the largest with $1 trillion in 2019, down 35% from $1.55 trillion in 2018 , but well above the $730 billion in 2017.
- iTraxx Europe S32 next with $375 billion, down 31% from $545 billion in 2018 and also below the $420 billion in 2017
- CDX NA HY S33 with $306 billion, down 43% from $540 billion in 2018, but up from $275 billion in 2017
- iTraxx EuropeCrossOver S32 with $103 billion, down 33% from $154 billion in 2018 and also below the $110 billion in 2017
- CDX EM S32 with $27 billion, down 36% from $42 billion in 2018 and also below the $35 billion in 2017
That’s it for CRD.
FXD Volumes and Share
Lets now look at FXD volumes.

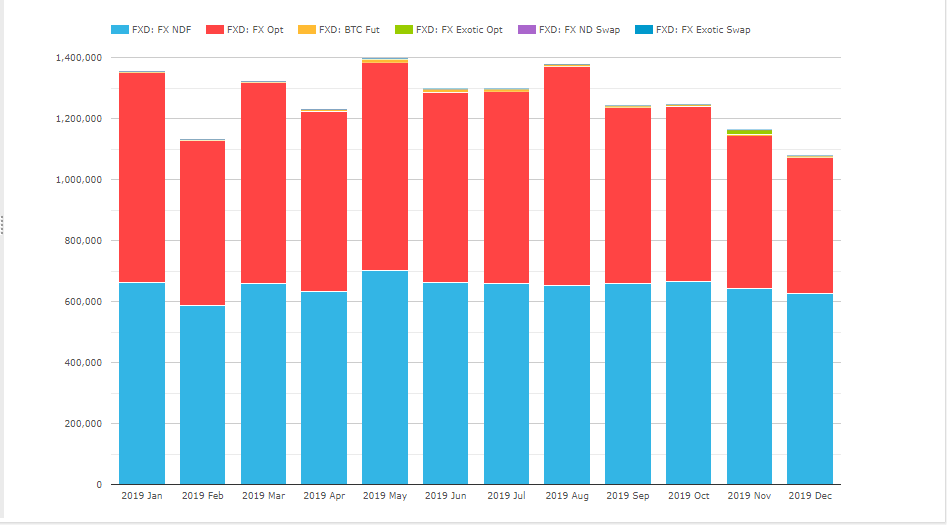
- Non-Deliverable Forwards (NDF) is the largest product with $7.8 trillion, up 5% from $7.4 trillion in 2018, which was up 23% from $6 trillion in 2017
- FX Options close with $7.2 trillion, similar to the $7.4 trillion in 2018 and far higher than the $4.8 trillion in 2017
- Others are comparatively insignificant e.g. Bitcoin Futures $62 billion and Exotic Options $28 billion
- May 2019 was the highest volume month (in 2017 it was October)
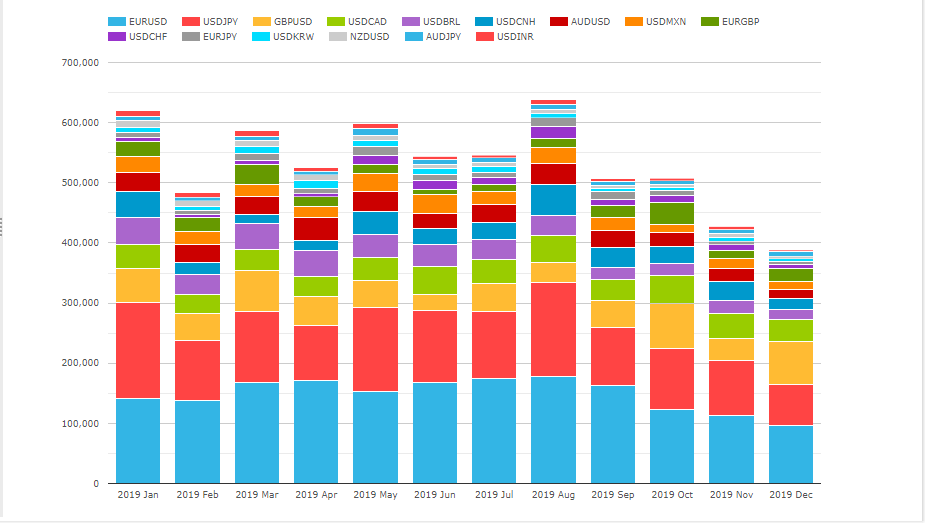
Next FX NDF volumes by currency pair.

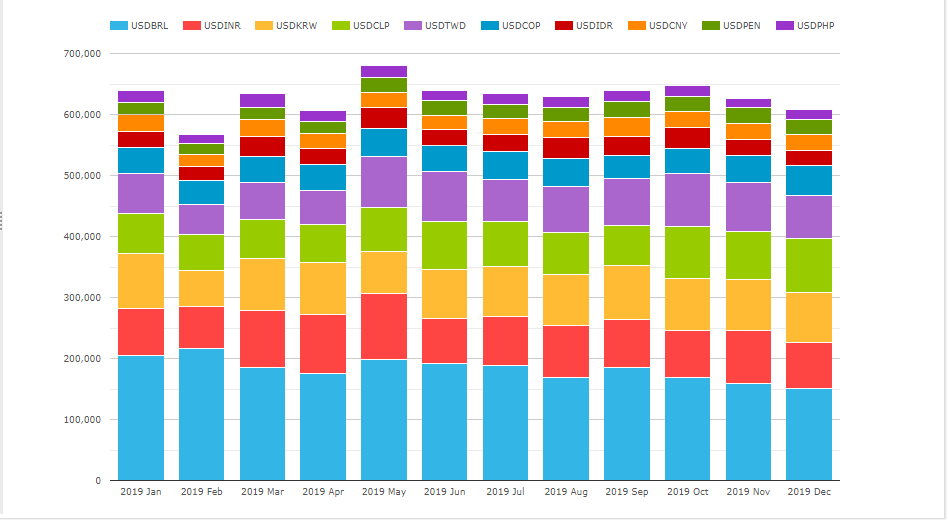
- The largest 10 currencies (in size order) BRL, INR, KRW, CLP, TWD, COP, IDR, CNY, PEN, PHP
- The only change in order from 2018 is that INR and KRW have switched positions
- BRL by far the largest with $2.2 trillion, similar to the $2.3 trillion in 2018 and higher than the $2 trillion in 2017
- INR next with $1 trillion, up 17% from $850 billion in 2018
- KRW with $974 billion, up from $930 billion in 2018 and far higher than the $640 billion in 2017
- CLP and TWD close behind with $860 billion and $857 billion
Also of interest and not shown in the chart is that in 2019, there was $4.2 billion in FX NDF in deliverable currencies, that vast majority in EURUSD, small amounts in AUDUSD, GBPUSD, USDJPY. (We have commented on this before as resulting from the need to delta-hedge FX Options and have the hedge included under Uncleared margin).
NDF volume in the 10 largest currencies is dominated by D2D SEFs with 92% vs 8% for D2C, exactly the same split as it was in 2018.
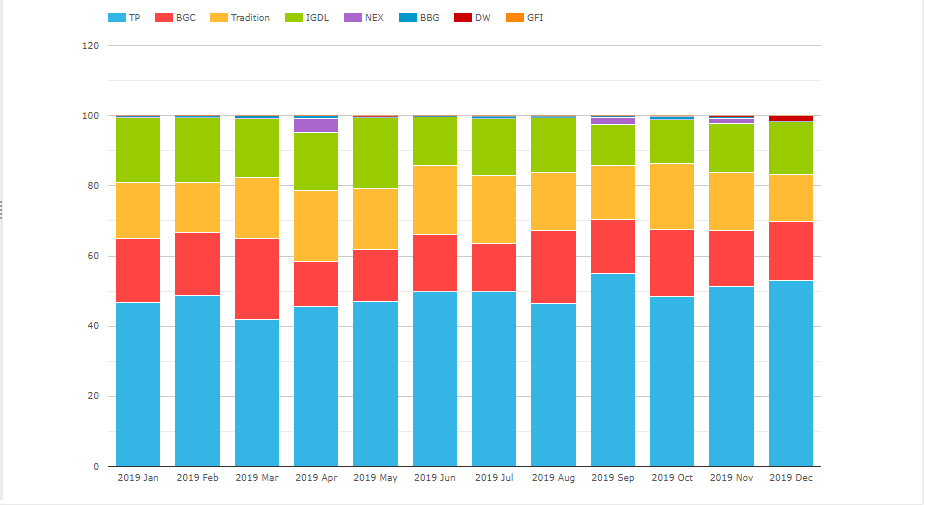
So lets chart NDF percent market share for D2D SEFs by month and first for LatAm currency pairs (BRL, CLP, COP, MXN, PEN).

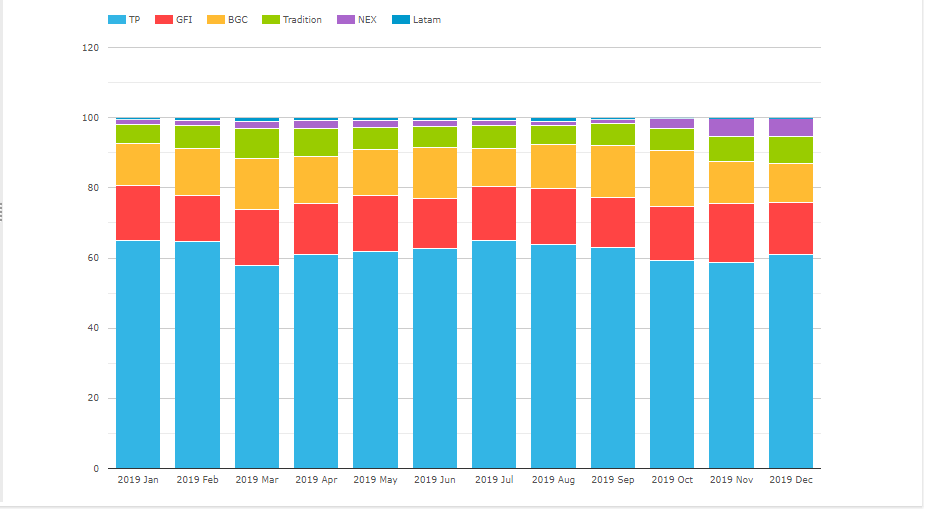
- TP the largest with 62%, similar to 63% in 2017
- GFI next with 15.2%, down from 17.3%
- BGC with 13.2%, up from 11.6%
- Tradition with 6.7%, up from 5.9%
- NEX with 2.3%, up from 1.5%
- Latam with 0.6%, similar to 0.5% in 2017
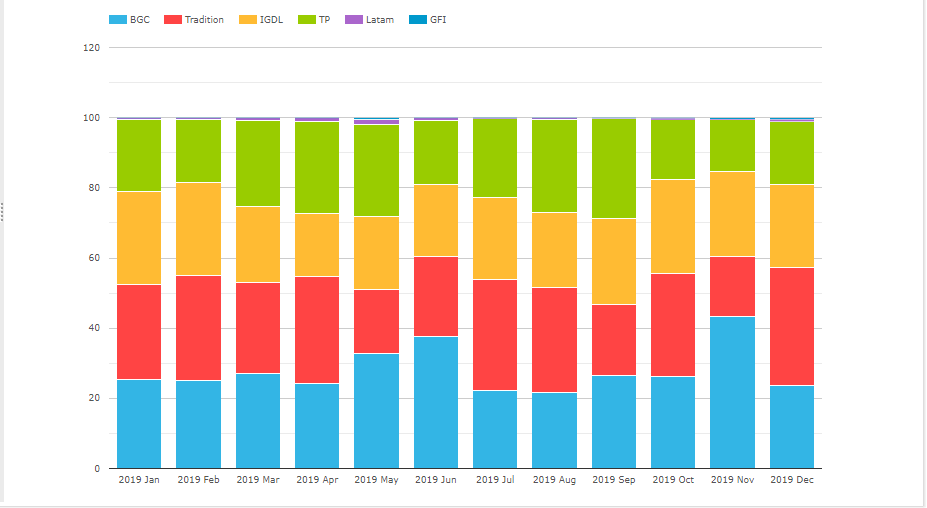
Next D2D SEF Asian currency pairs.

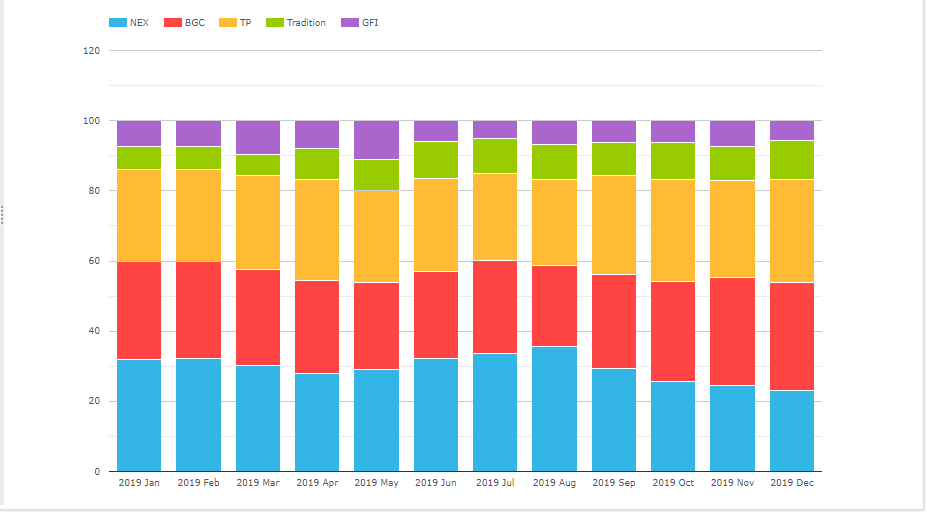
- NEX the largest with 29.6%, down from 34.3% in 2018
- BGC with 27.1%, up from 26.7%
- TP with 27%, up from 25.8%
- Tradition with 9%, up from 5.8%
- GFI with 7.3%, similar to the 7.4% in 2018
Next the D2C SEFs.

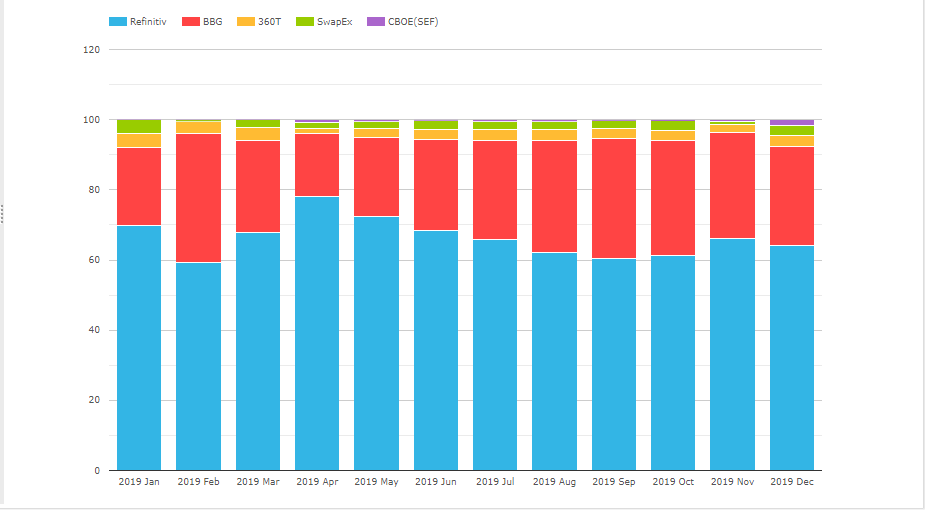
- Refinitiv the largest with 66.6%, up from 49.5% in 2018
- Bloomberg next with 27.9%, down from 46.5%
- 360T with 2.9%, up from 2.6%
- SwapEx with 2.2%, up from 1.4% in 2018
- CBOE with 0.5%, up from tiny volumes in 2018
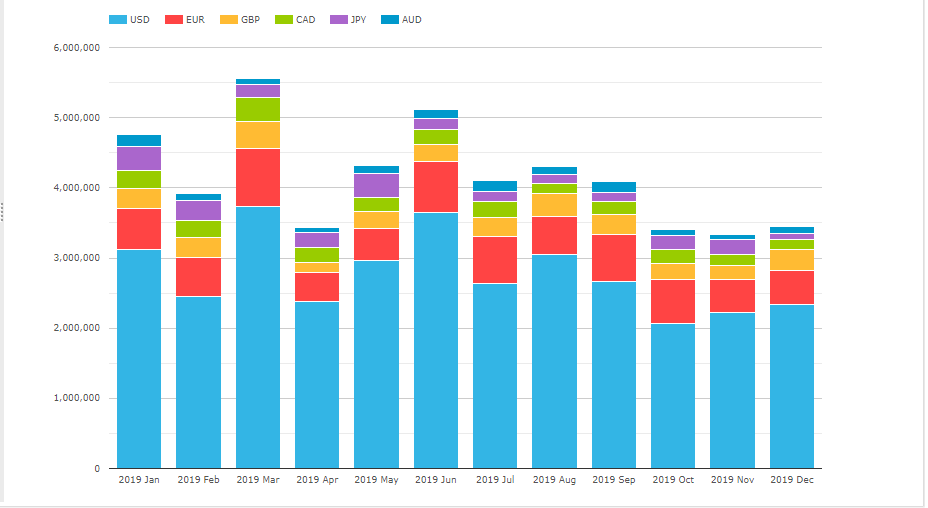
Next FX Option volumes by currency pair.

- The largest 15 currency pairs are shown above (in order top left to bottom right)
- EUR-USD by far the largest with $1.8 trillion, down from $2.3 trillion in 2018
- USD-JPY next with $1.35 trillion up from $1.2 trillion
- GBP-USD with $595 billion, USD-CAD $470 billion, USD-BRL $380 billion and AUD-USD with $340 billion
FXO volumes are dominated by D2D SEFs with 95.3% vs 4.7% for D2C, which is down from 97.8% vs 2.2% in 2018.
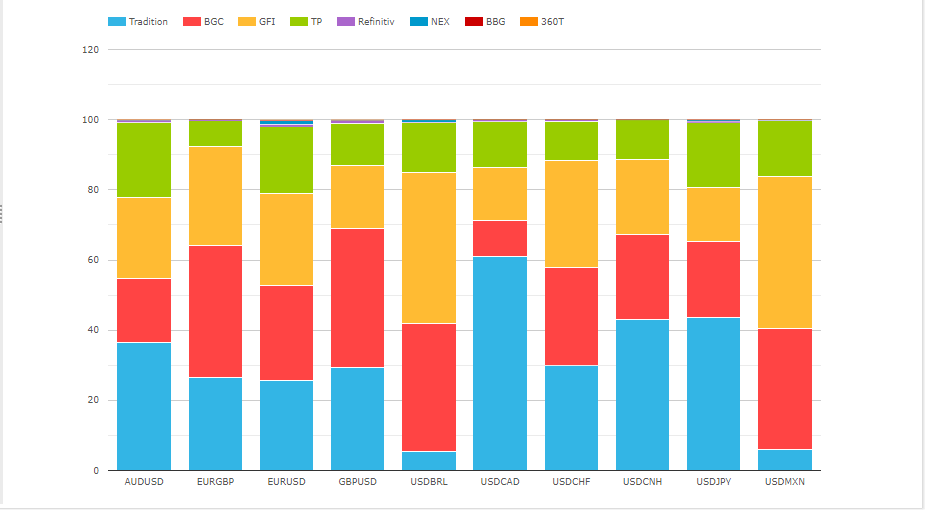
- EUR-USD with GFI 26.2%, BGC 27%, Tradition 25.7%, TP 19%, with GFI down from 30.7% and TP up from 15.8% in 2018
- USD-JPY with Tradition 43.5%, BGC 21.9%, TP 18.4%, GFI 15.3%, with Tradition up from 35% and BGC down from 35.5%
- GBP-USD, BGC and Tradition the largest
- USD-CAD, Tradition the largest
- USD-BRL, BGC the largest
Thats it for FXD.
IRD Volumes and Share
Lets now turn to IRD, starting with Vanilla Interest Rate Swap volumes.

- USD by far the largest with $33.3 trillion, similar to 2018 volume
- EUR next with $7 trillion, also the same as 2018
- GBP with $3.2 trillion, up from $3 trillion
- CAD with $2.6 trillion, the same
- JPY with $2.4 trillion, up from $2.2 trillion
- AUD with $1.1 trillion, the same
- An overall $50 trillion is similar to $49 trillion in 2018
- March the highest month with $5.5 trillion
- November the lowest month with $ 3.3 trillion
- The fourth quarter with much lower volumes
Next Overnight Index Swaps.
- USD by far the largest with $24 trillion, up from $16.3 trillion in 2018
- EUR next with $3.5 trillion, up from $1.8 trillion
- (the growth in both almost entirely at Tradeweb, more on this later)
- AUD with $3.5 trillion, massively up from $390 billion
- GBP next with $2 trillion, down from $2.3 trillion
- CAD with $1.3 trillion, down from $1.6 trillion,
- JPY with $122 billion
- August the highest month with $ 4.6 trillion
- December the lowest month with $ 1.5 trillion
- The fourth quarter with much lower volumes
And other IRD product types (except for FRAs).

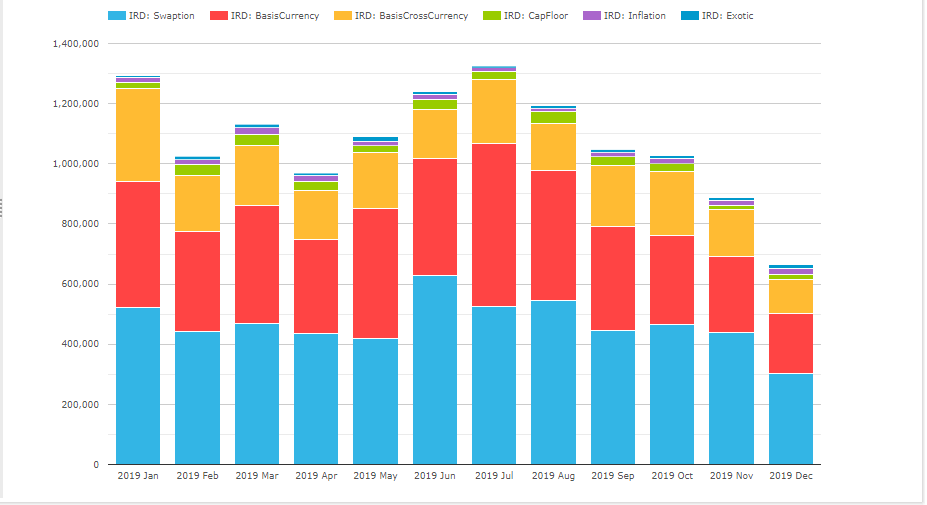
- These products averaged $1.07 trillion a month, the same as 2018
- Swaptions are the highest averaging $470 billion a month, up from $350 billion a month in 2018 and $260 billion in 2017
- Basis (Single) Currency next, averaging $360 billion a month, down from $450 billion in 2018
- Basis Cross Currency average $190 billion a month, same as 2018
- CapFloors average $28 billion a month, down from $32 billion
- Inflation Swaps average $16 billion a month, down from $19 billion a month
- Exotics average $10 billion a month, similar to $12 billion in 2018
Next market share for selected product types.
Vanilla IRS
First for D2D SEFs, all currencies and using a DV01 percentage share.

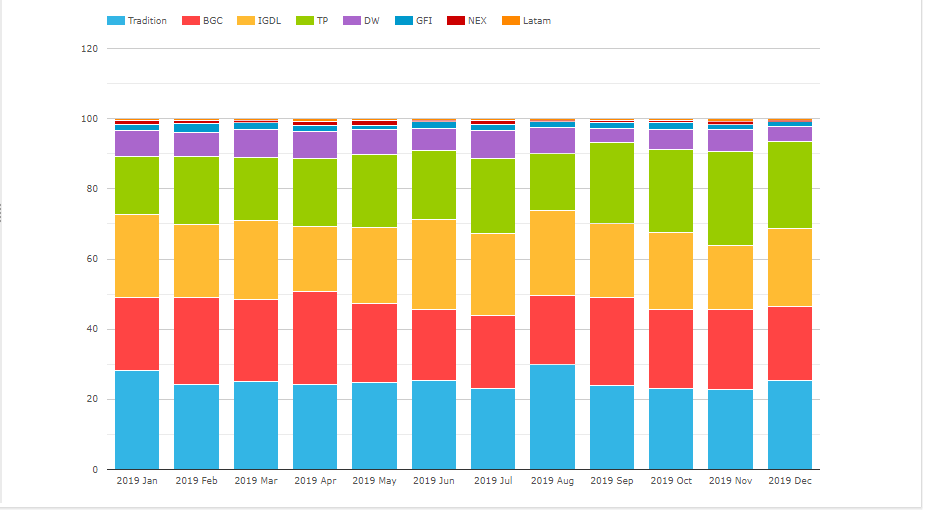
- Tradition top with 25.2% (was 21.8% in 2018)
- BGC with 22.4% (was 24.2%)
- IGDL with 22.1% (was 24%)
- TP with 20.5% (same)
- DW with 6.6% (was 5.9%)
(While using DV01 instead of notional adjusts for tenor and gives a better indication of brokerage revenue share, SEF data does not allow us to identify packages (curve, spreads, flys) and for those SEFs that do a higher proportion of these than others e.g. Tradition, the share might be slightly inflated).
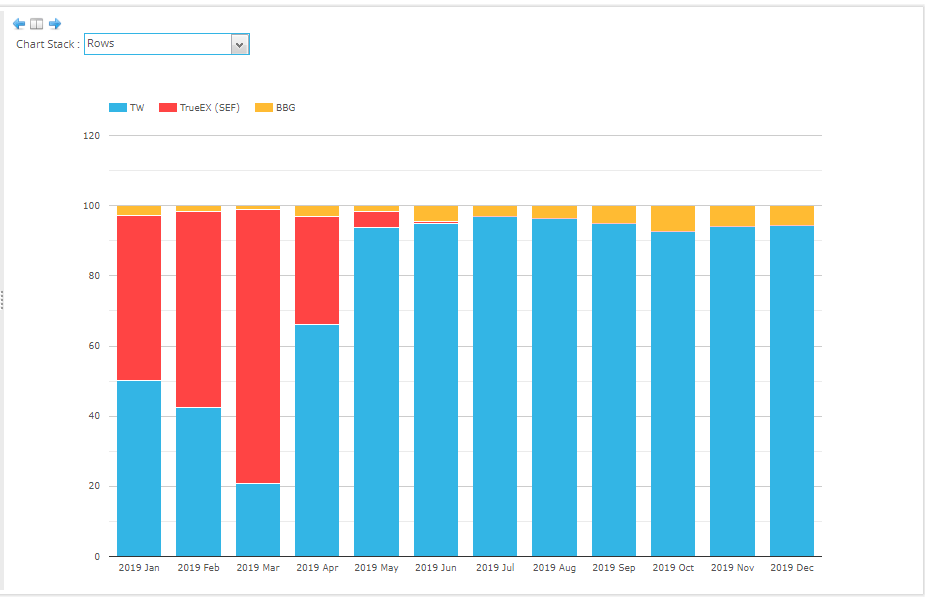
Next for D2C SEFs, all currencies and using a DV01 percentage share.
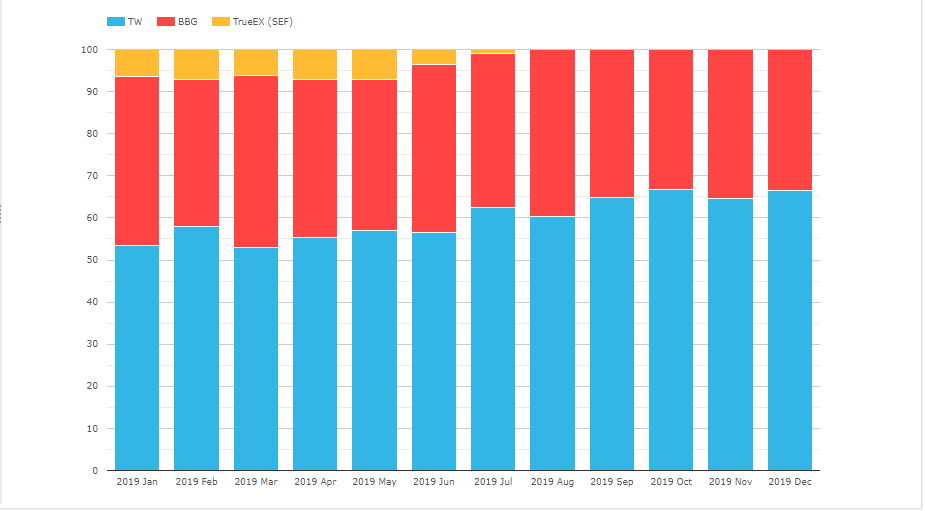
IRS Vanilla market share for D2C SEFs in DV01 for all currencies
- Tradeweb with 59.7% increasing it’s share over Bloomberg with 37.2%
- TrueEx the other D2C SEF is no longer operating
Swaptions

- BGC the largest with 54.3%, up from 42.4% in 2018 (could this in part be due to CapitalLab compression?)
- IGDL next with 27.4%, down from 32.8%
- TP with 9.5%, down from 12.2%
- Tradition with 8.5%, down from 11.4%
- Tradeweb with 0.3%, down form 1%
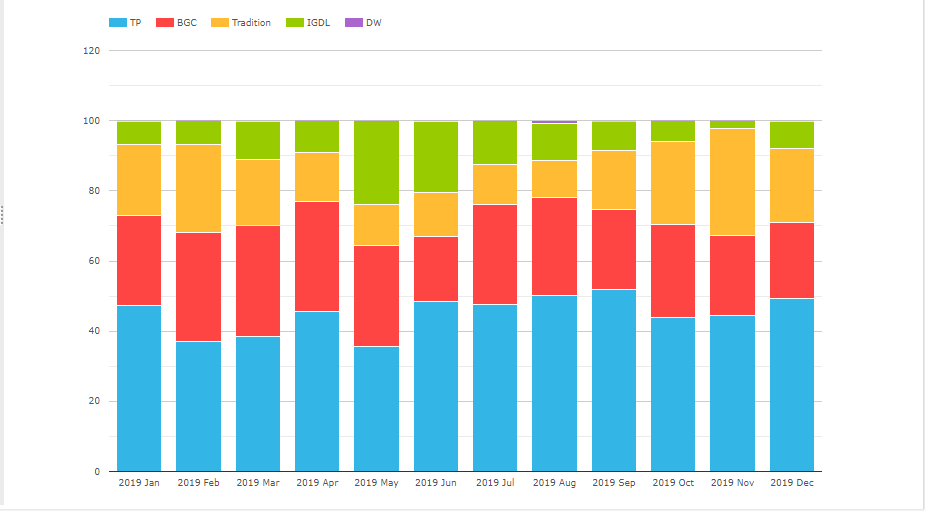
Basis (Single) Currency Swaps

- TP with 48.4%, down from 53.3% in 2018
- IGDL with 16%, down from 17.8%
- Tradition with 17.2%, up from 12.8%
- BGC with 17.2%, up from 15.3%
- NEX with
- Dealerweb with 0.4%, down from 0.7%
Basis Cross Currency Swaps

- BGC the largest with 27.7%, same as in 2018
- Tradition with 26.3%, up from 21%
- IGDL next with 23.4%, down from 26.1%
- Tullet with 21.9%, down from 23.6%
- Latam with 0.6%, down from 1.1%
CapsFloors

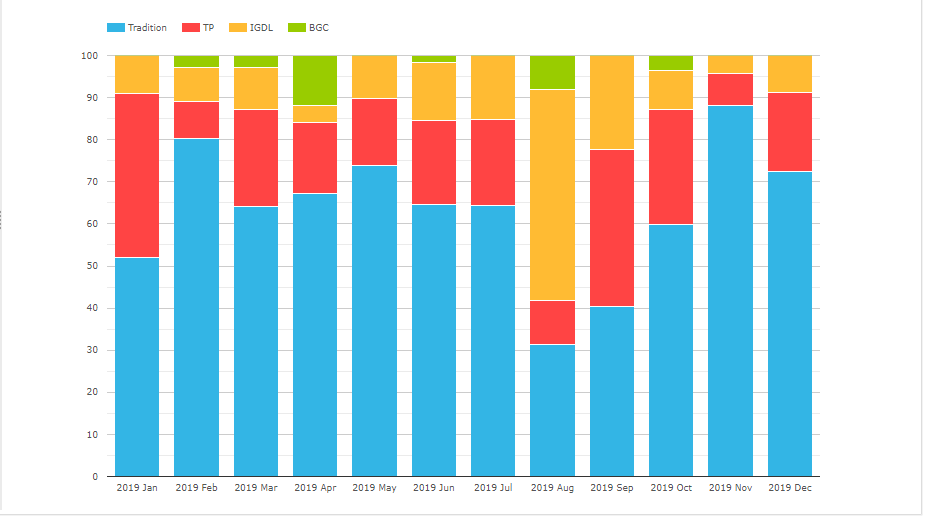
- Tradition with 60.8%, up from 55% in 2018
- Tullet with 20.3%, up from 11.7%
- IGDL with 15.7%, up from 11.4%
- BGC with 3%, down from 21.8%
- A lot of variability month to month, not surprising given the small number of transactions in large notional
OIS
First for D2D SEFs.
- Tullet the largest with 44.6%, similar to 43.3% in 2018
- BGC with 26.7%, up from 17.7%
- Tradition with 17%, down from 20%
- IGDL with 11.5%, down from 18.6% in 2018
Next D2C SEFs.

- Showing TrueEx ending in July
- Tradeweb with 94% share to Bloomberg with 6%
- The volumes driven not by price forming trades but portfolio maintenance activity
That’s it for IRD.
The End
That’s it, 22 charts to summarise SEF statistics in 2019.
There are many more I could have created, given the data available.
I hope you found ones useful to your interest.
If not, using SEFView you can create your own.
Please contact us for a subscription if you don’t have one.
It will be interesting to see how 2020 market share develops.
A US election year not to mention the Tokyo Olympics.
Bond and equity markets in particular coming off a great 2019.
What will these mean for volume and market share?
Only time will tell.
We publish regular Swaps Review articles.