As yesterday was the first day for Swap Execution Facilities (SEF) trading, I decided to look at what the data in a Swap Data Repository (SDR) can tell us about what happened on Day 1.
The DTCC real-time public dissemination feed has a field name “Execution Venue”, which prior to Oct 2 always had the value “Off”, but from yesterday we can see new trades with the value “On” (meaning On a SEF venue) and “Off” (meaning off Facility).
So from today, we have made this field available as a selection in SDRView Professional.
This certainly provides some very interesting views.
As Interest Rate Swaps have been trading electronically on a number of platforms for some time, the main difference is that from Oct 2, these are now registered Swap Execution Facilities.
So lets start with a summary table of USD IRS activity on Oct 2. (Vanilla spot starting fixed for float swaps).
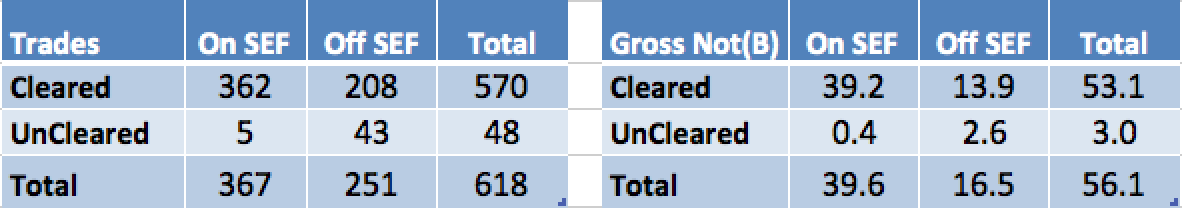
This tells us the following:
- The total number of trades reported was 618, with a gross notional of $56 billion (allowing for cap sizes).
- Of these 367 or 59% were traded on a SEF and 251 or 41% were not.
- The number of Cleared trades was 570, of which 362 or 64% were on a SEF and 208 or 36% were not.
- The gross notional of Cleared trades was $53b, of which $39b or 74% were on a SEF and $14b or 26% were not.
In summary over 2/3 of Cleared Swaps traded on a SEF.
Which is an excellent result on the first day of the deadline.
Well done all the folks at Bloomberg, Tradeweb, trueEx, GFI, TeraExchange, State Street, Javelin, Tullet, ICAP, BGC and Tradition.
Now we only have to wait for some of you to start publishing your daily volume figures to see where market share is going.
But that is for another time.
For today lets continue by looking at the Cleared Swap trades by maturity tenor.
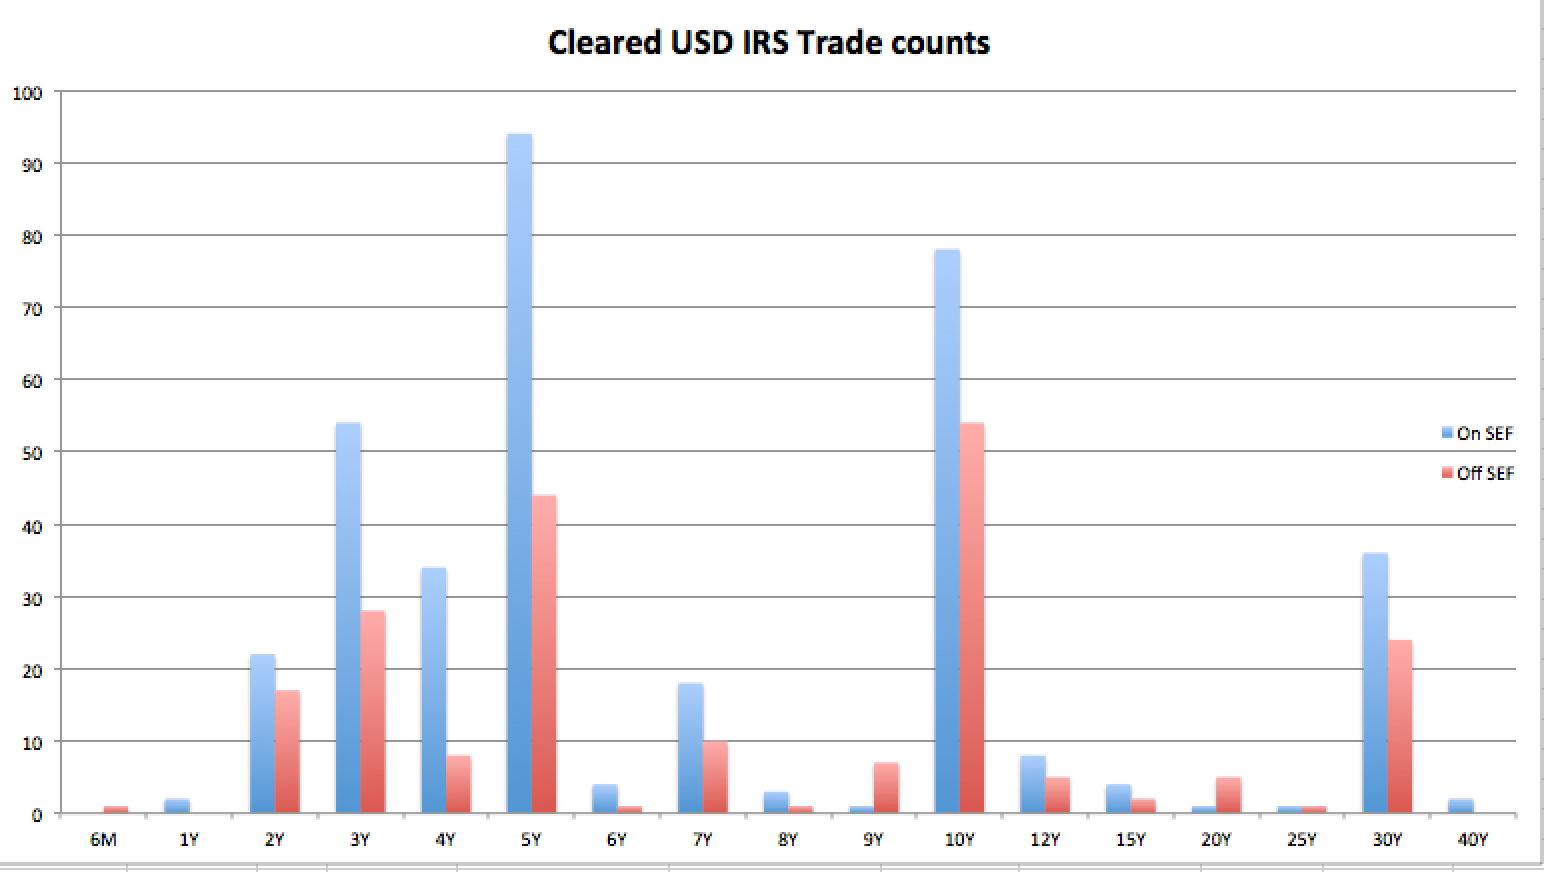
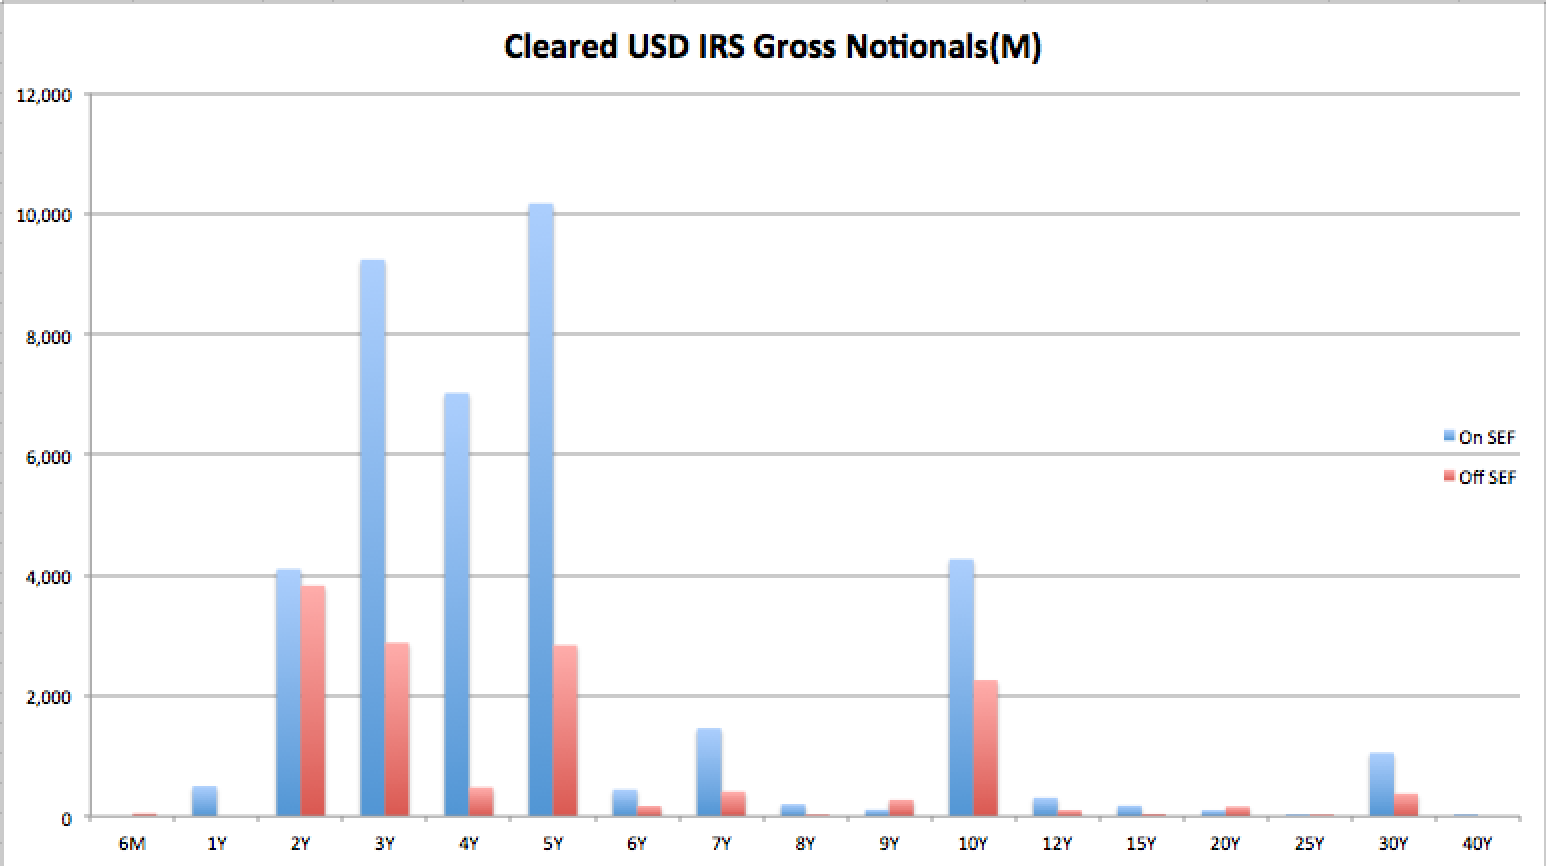
From this we can observe the following:
- The major tenors are 2Y, 3Y, 4Y, 5Y, 7Y, 10Y, 30Y.
- In each major tenor the number of trades for On SEF is higher than Off SEF.
- In each major tenor the gross notional traded is higher for On SEF.
- There are trades for each tenor for On SEF, except 6M which is not a common IRS tenor.
- There are trades for each tenor for Off SEF, except for 1Y and 40Y, which are not common IRS tenors.
A few observations from data not in the charts
- The number of block or large notional trades as a proportion of all trades is 13% for On SEF and 7% for Off SEF.
- But in gross notional terms this proportion is similar at 30% for both.
- The average notional size is generally higher for On SEF than Off SEF.
- So for 5Y the On SEF average size is $108m, while for Off SEF it is $65m.
So that is it for the analysis on Oct 2 trades.
The real question is what will the data show going forward?
Will we see average deal sizes decrease as more volume moves to SEFs and more participants join?
Will this result in higher gross volumes?
We shall see.
Or even better, you can see yourself by using SDRView Professional.
Good luck to each of the SEFs and lets hope there is good business ahead for most if not all.
We live in interesting times.