- We look at what traded on- and off-SEF in 2018 across Rates and Credit markets.
- As a result of the CFTC’s proposed rule, we look at what is voluntarily trading on-SEF at the moment.
- We find that most voluntary SEF executed volumes are in USD-denominated FRA and OIS products.
- Liquidity is shown to be very high for SEF-executed, standardised products.
Part 1
This is the second part of a two-part series looking at the data behind the CFTC’s current rule making proposal. We have previously looked at products subject to the Clearing Mandate that trade off-SEF. Today, we will concentrate on products subject to the Clearing Mandate that trade on-SEF.
How Much USD is on-SEF?
A simple question – how much of the vanilla Fixed-Float market is now traded on-SEF? Our March 2016 blog looked at just USD Fixed-Float, so let’s first update that analysis in DV01 terms:
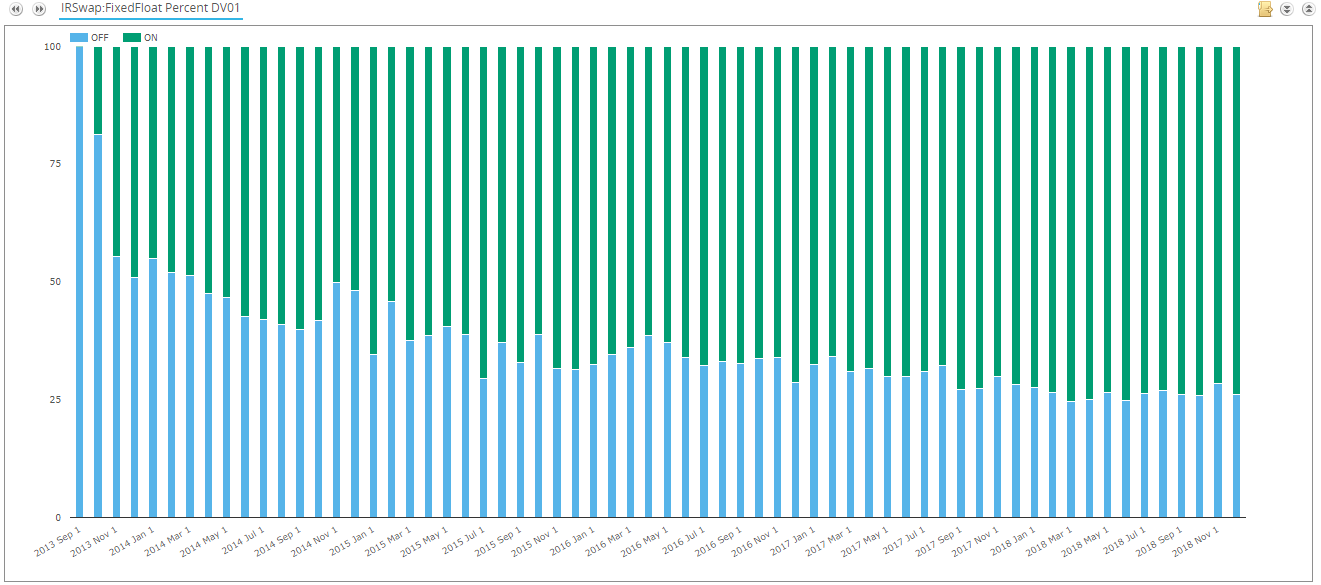
73% of the vanilla Fixed-Float USD market is currently transacted on-SEF. Remarkably similar to the 71% that we found in March 2016.
Clearing Mandated Rates Activity
Here I want to re-iterate a chart from Part 1:
![]()
Showing;
- A notable difference in on- vs off-SEF trading when measured by notional or DV01.
- By the most important DV01 measure, we find that SEF trading accounts for 65% of overall risk traded.
- Importantly, we find that the split between MAT vs non-MAT (or rather mandated vs voluntary trading) on-SEF is roughly equal (33% vs 32% of total 2018 volumes).
It is surely notable that half of all SEF risk that is traded is done so on a voluntary rather than mandated basis. To understand more about what these voluntary volumes are, I’ve looked into the product types and currencies trading. As a reminder, I looked at the off-SEF market in my previous blog.
SEF Trading Evolution
First up – a small history lesson. It is worth noting how far we have come in terms of SEF trading:
 Showing;
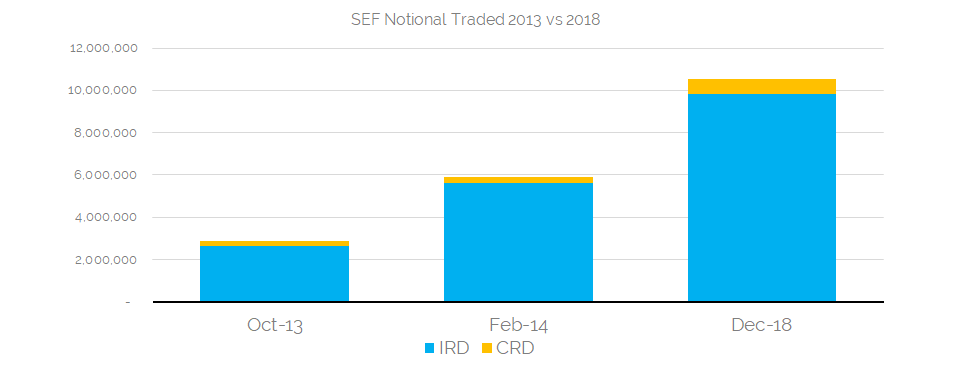
- Notional traded on-SEF in three particular months.
- In the most recent full month, December 2018, a total notional over $10.5trn traded across Rates and Credit.
- Since February 2014, this volume has increased by a multiple of 2.5 for Credit products.
- Since February 2014, this volume has increased by a multiple of 1.75 for Rates products.
What Products are voluntarily traded on-SEF?
These on-SEF volumes are not just mandated products – see our second chart above.
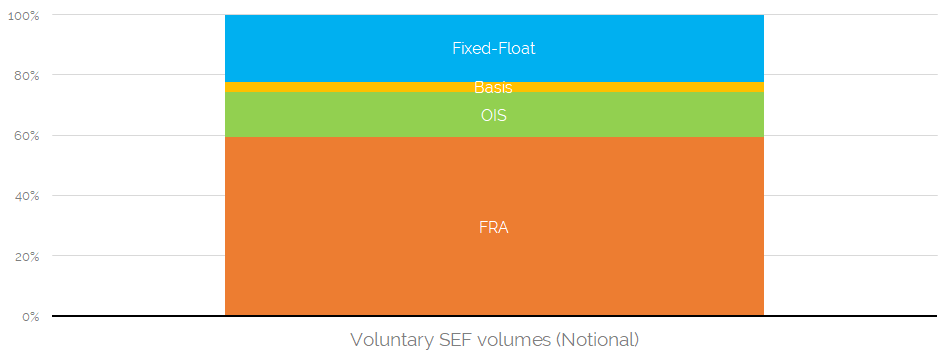
There is also a large volume of voluntarily SEF-executed products. Much of this volume, however, is FRA and OIS as shown in the chart below. These are short-dated which is why there is such a disparity between Notional and DV01 measures of on-SEF trading. We can see this most clearly on a notional basis (for Clearing Mandated volumes during 2018):
Showing;
- Nearly 60% of volumes are in FRAs.
- 15% is OIS. Remember that these are predominantly short-dated markets, with 93% of activity in OIS and FRAs in tenors of one year or less.
- Just 25% of notional is transacted in Fixed-Float and Basis swaps.
Looking at where these FRAs and OIS trade is instructive. Almost all of this notional is transacted across D2D SEFs:
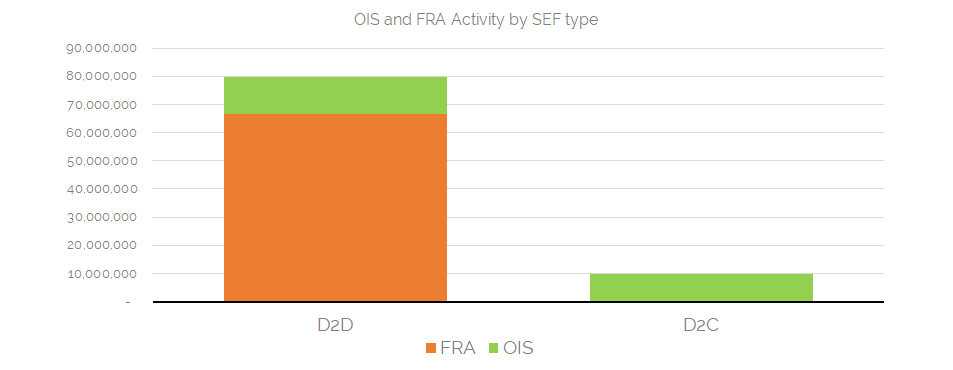 Whilst not clear on the chart (poor charting skills from me!), D2D OIS risk is some 32% larger than D2C. This is across all FRA and OIS risk traded.
Dealer to Customer Trading on-SEF (Rates)
Next up, we take a look at trading on D2C SEFs. With so much notional trading on-SEF in FRAs (a predominantly non-price forming portfolio maintenance activity from dealers), it is beneficial to know where customers are choosing to trade and what products they have voluntarily chosen to trade on-SEF.
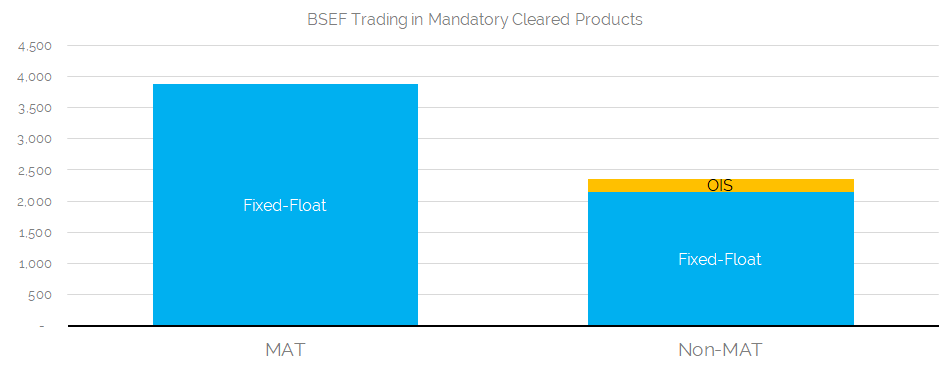
Showing;
- The activity on one of the largest D2C SEFs, Bloomberg (BSEF), is strongly concentrated in MAT products.
- Just 25% of volumes are in non-MAT products (excluding Compression).
- Only small amounts of OIS are traded – even when measured by notional.
- It is notable that this is considerably different to the overall market, where the mix of MAT vs non-MAT products is a 50/50 split.
Looking at the types of products traded on BSEF, we see a further preference towards the “standardised” type of products. For example, IMM swaps are more prevalent than any other forward-starting swap:
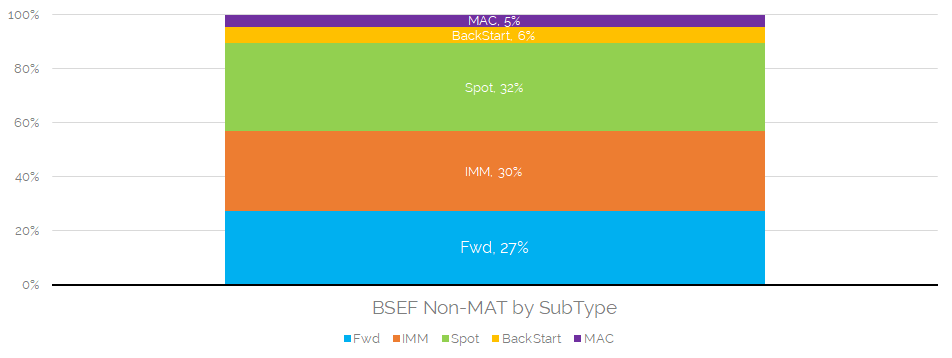 This analysis suggests that BSEF is a particularly popular venue for standardised types of product.
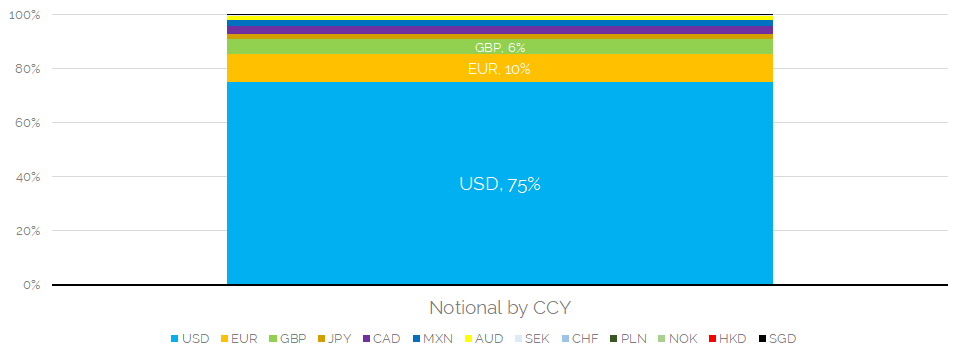
What Currencies are voluntarily traded on-SEF?
Looking in more detail, I wanted to know the break-down by currency. Again, looking on a notional-basis and across all Rates products (Fixed-Float, FRAs, OIS, Basis):
 Showing;
- 75% of these volumes are in USD. Discuss. Is this due to volumes across everything mainly being in USD or because the USD swap market is the most “electronic”? Difficult to break-out the sampling bias here.
- 93% of volumes are across the top 4 currencies (USD, EUR, GBP and JPY).
Which Fixed-Float Products are voluntarily traded on-SEF?
Separately, it is interesting to consider the mixture of Fixed-Float products that are traded on-SEF on a voluntary basis. Is there any difference to the USD off-SEF market we looked at previously?
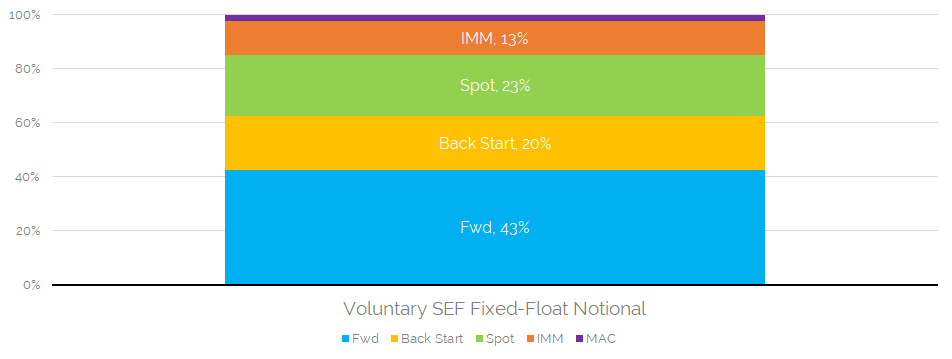
Showing;
- A similar picture to the USD off-SEF market. 43% is traded as a Forward, or 56% if you include IMM dates in the definition.
- 23% are Spot-starting.
- And a much larger portion, at 20%, are back-starting, showing a likely preference for SEF-executed Compression.
What is current liquidity like on-SEF?
I think it is interesting that the market voluntarily chooses to trade non-MAT products on-SEF under the allowable SEF execution methods. I think it is probably due to a combination of transparency and liquidity caused by the current execution protocols.
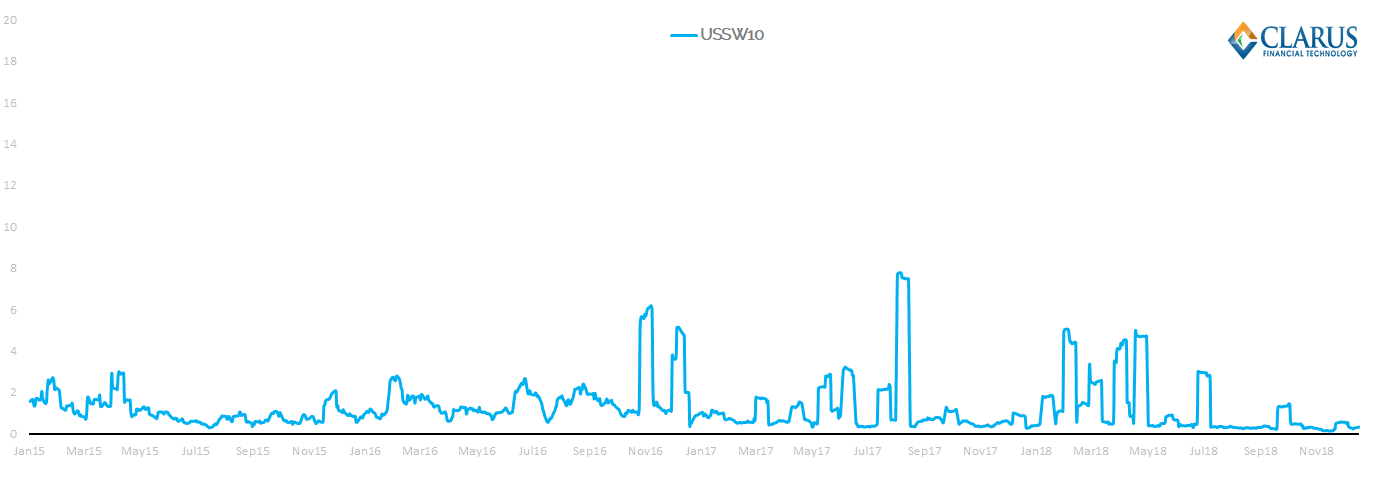
We ran a series of blogs, based on the Bank of England’s work on SEF liquidity, centred around price dispersion. If there were a single chart that emphasises how beneficial trading on-SEF is at the moment, I think it is the price-dispersion (or lack there-of) that we have seen in SEF-executed 10 year USD Fixed-Float over the past four years:
 Showing;
- A remarkably small price dispersion for a non-continuous market such as swaps.
- In recent times (2018), the price dispersion across the day was regularly below 1 basis point.
- And even under stressed conditions, we never saw price dispersion getting even into double figures – we see a high of just 8 basis points.
- Running the same for off-SEF ten years shows a price dispersion two orders of magnitude higher!
- And to prove how the market is choosing on-SEF execution, I cannot even run the time series for off-SEF trades in 8 years (a non-MAT maturity) as there have been only 25 trades in the past 4 years!
- This helps to quantify the benefits of existing SEF execution protocols.
Clearing Mandated Credit Activity
We can also run the same analysis on Credit products.
![]()
Showing;
- A different picture to Rates products. 94% of Clearing Mandated volumes are MAT products that are transacted on-SEF.
- Just 4% of total Clearing Mandated volumes are executed off-SEF.
In Summary
- In Rates, up to 65% of volumes are transacted on-SEF.
- In Credit, 94% of Clearing Mandated volumes are in MAT products executed on-SEF.
- Of the voluntarily SEF-executed products, most are USD denominated FRA and OIS products when measured by notional.
- Liquidity is very high for SEF-executed, standardised products under current execution protocols. The price dispersion of a USD 10 year swap was regularly below 1 basis point during 2018.