I was fortunate enough to be able to write about Cross Currency Swaps a few times during 2020. At the height of the market turmoil in March and into April, I wrote about:
- Cross Currency Swaps Trading During a Crisis
- Mechanics of Central Bank FX Swap Lines
- Central Bank Responses to COVID-19: FX Swap Arrangements
- $300bn FX Swap Rollover
As Amir highlighted last week, Cross Currency Swaps continue to be a hot topic over on the Clarus blog. Our top new blog of 2020 was Cross Currency Swaps Trading During a Crisis. Our top blog overall was again Mechanics of Cross Currency Swaps, which attracted over 5,000 views, as it has done each year since being published in 2017.
In light of which, I thought it was about time we looked at what actually trades in this most important of markets!
SDRView Volumes
SDRView shows the monthly volumes transacted of Cross Currency Basis swaps. These are, on the whole, the vanilla interbank type of mark-to-market cross currency swaps.
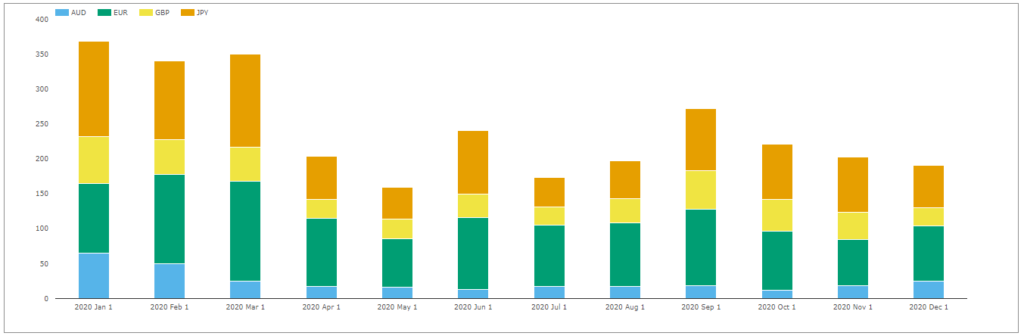
Showing;
- No great surprises in how the cross currency volumes evolved during 2020.
- January is always a big month for XCCY, as large cross-border issuance drives demand.
- Q1 in 2020 was clearly unusual, as this typical seasonal demand for XCCY swaps ran uninterrupted into the peak of the pandemic worries. As we wrote about at the time, much of this was short-end focused.
- Cross currency swaps shorter than 2Y made up $750bn in Q1 2020, compared to just $350bn in Q4 2020. The drop-off in short-dated activity therefore accounted for most of the reduction in volumes from Q1 into the rest of the year.
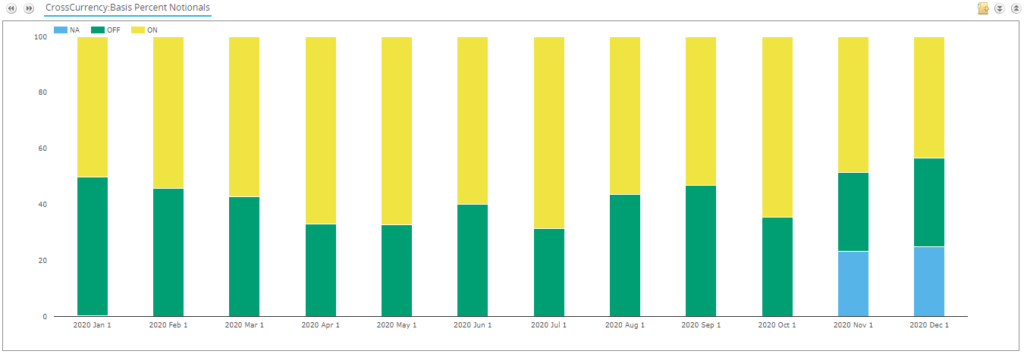
In terms of SEF Trading in vanilla XCCY basis, it continues to be somewhat of a lottery whether an SDR-reported swap is transacted on- or off-SEF. SEF trading did reach nearly 70% of volumes in July and October 2020:
At this juncture, I will repeat my frustrations with the quality of data for this product. Cross Currency Swaps are naturally a global market, as with any FX-related product. To get a true overview of the market we need quality global data. European data remains impossible to access or to use. We continue to believe that US SDR data is representative of overall market trends, but it is not gospel.
Client Volumes
SDRView also provides an insight into Client traded volumes in XCCY. The interdealer market in the major currencies is exclusively transacted in Float vs Float basis trades. Therefore, any Fixed-Float or Fixed-Fixed trades in the SDR are related to Client activity.
The Fixed-Float portion of this market, as reported to SDRs, is surprisingly tiny at less than $8bn per month. This could be due to:
- Reporting exemptions from those issuers swapping into floating.
- An almost complete absence of European issuers in SDR data as they report into the blackhole of European transparency.
- Block caps in SDR data meaning that those few issuance swaps making their way to the screens are still capped and not revealing full size.
However, Fixed-Fixed swaps are much larger, running at nearly $20bn a month, so well worth taking a quick look at:
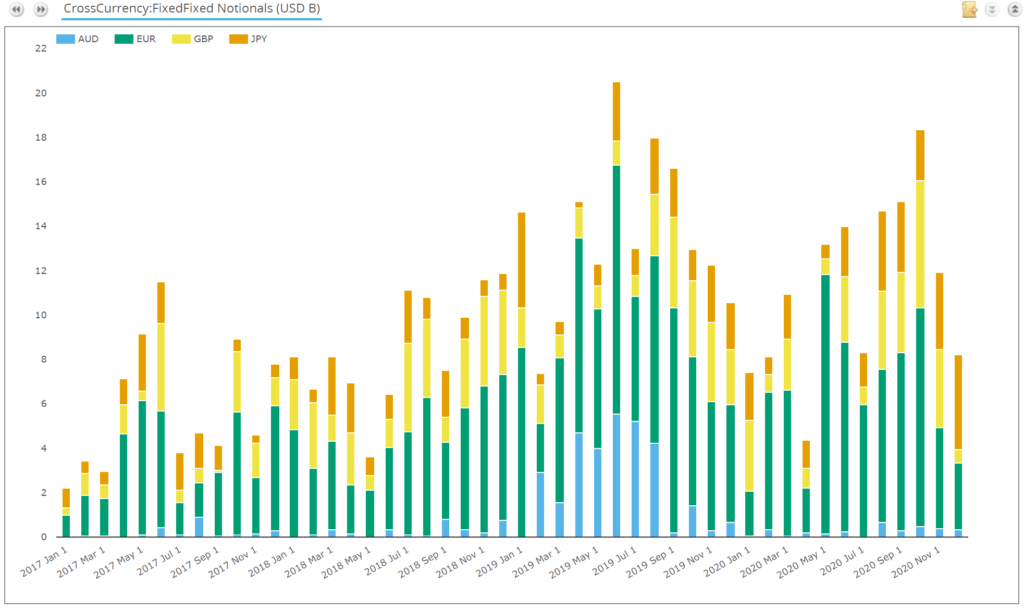
Showing;
- 2020 was a very active year in these Client transactions.
- Volumes were double those of 2017, and 30% higher than in 2018.
- Only 2019 saw higher overall volumes of Fixed-Fixed, driven largely by activity in AUD vs USD structures which all but disappeared after Q3 2019.
- October 2020 was the second most active month on record, and the most active month on record for the G3 currencies.
Clearly lots of interesting data here and something to follow in 2021.
DV01 Volumes
We have recently added DV01 data to SDRView for Cross Currency Swaps, allowing us to more accurately analyse trends in the amount of risk being transacted. The data will no longer be skewed by short-dated trades.
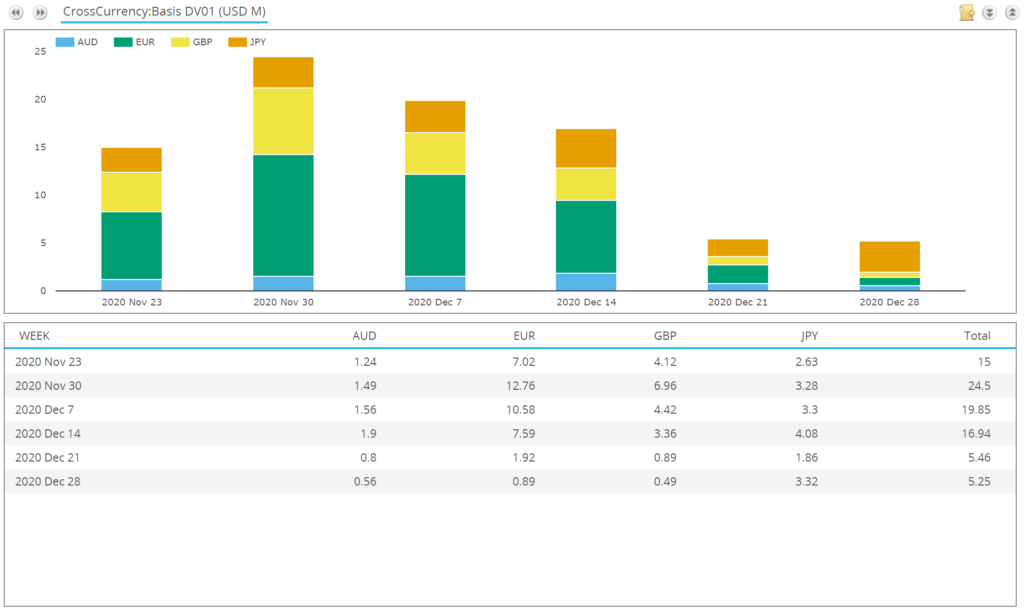
Looking at the year that was 2020 reveals some surprises here:
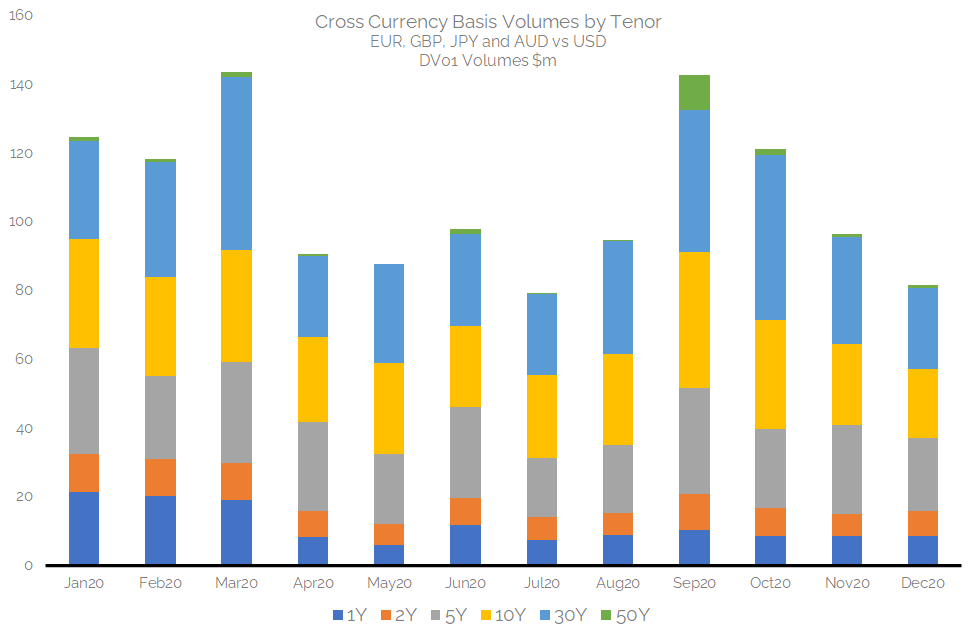
Showing;
- In terms of risk traded (DV01), XCCY basis enjoyed two record months – March 2020 (as expected) AND September 2020 both saw $140m+ of DV01 traded (as reported to SDRs!).
- DV01 risk was larger in October 2020 than it was in February at $120m+.
- Consistent with the rest of the data sources, April through to August saw really depressed volumes.
Stability is Key
Finally, I have run the DV01 volumes over a longer time period for XCCY Basis volumes in EUR, GBP, JPY and AUD vs USD:
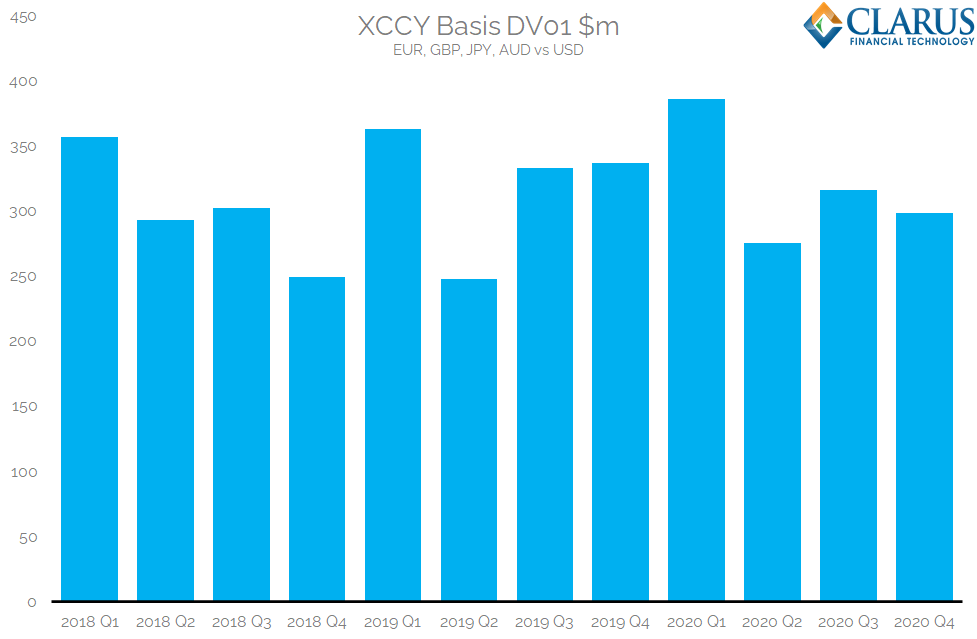
Showing;
- Every quarter sees over $250m DV01 traded.
- From year to year, the variation is remarkably small in overall volumes.
- Every single year, between $1.2bn and $1.28bn in DV01 has traded.
- It really is remarkable how stable the amount of risk transacted (reported) has been over the past three years.
Brexit
Finally, there have been a few incomings this week as to whether our data shows any derivatives trading moving away from UK platforms, and potentially onto either European or US venues. All European data relating to this activity is delayed by four weeks, so we cannot use this. Daily SEF volumes are too volatile to identify any trends over such a short period (a matter of days). So we will remain in the dark, thanks again to the pitfalls of the European transparency regime.
In Summary
- Cross Currency Swap content is extremely popular on the Clarus blog, taking both of the top spots in the 2020 blog review (old and new content).
- Our SDR data for Cross Currency Swaps now also includes DV01 metrics to monitor the amount of risk traded.
- We find that both January and September 2020 saw extremely large amounts of risk traded, over $140m in DV01.
- The overall amount of XCCY risk reported to SDRs is extremely stable, with $1.2-$1.3bn total DV01 traded each year.